 Yong Sun
 Wenhui Hu
 Chaoyu Shi
95% of researchers rate our articles as excellent or good
Learn more about the work of our research integrity team to safeguard the quality of each article we publish.
Find out more
ORIGINAL RESEARCH article
Front. Energy Res. , 07 September 2022
Sec. Smart Grids
Volume 10 - 2022 | https://doi.org/10.3389/fenrg.2022.990989
This article is part of the Research Topic Advanced AI Applications for Modelling, Optimization, Control, and Planning of Smart Grid View all 39 articles
Since deterministic prediction errors of wind power cannot be avoided, probabilistic prediction can adequately describe the uncertainty of wind power and, thus, provide further guidance to dispatching authorities for decision making. Current probabilistic prediction methods for wind power are still incomplete in mining its physical variation process. Therefore, this study constructs a new framework for short-term wind power probabilistic forecasting considering the spatio-temporal dependence of errors by mining the spatio-temporal characteristics of historical wind power data and numerical weather forecasts at numerical weather prediction (NWP). First, the deterministic prediction results are obtained by an improved deep belief network (DBN); then, a multi-location NWP is introduced to propose a multi-level error scenario partitioning method considering the spatio-temporal dependence property. Finally, a new error sample set is formed by reconstructing the kernel density estimation method to adapt the model, and the short-term wind power probability prediction at different confidence levels is carried out. It is, thus, concluded that the effectiveness of the overall framework under the probabilistic prediction considering spatio-temporal dependence is verified in a wind farm in Jilin, China, and the prediction accuracy is effectively and significantly improved compared with the same confidence level, and the coverage of the evaluation index prediction interval is improved by 1.23, 0.72, and 0.80%, and the average bandwidth of the prediction interval is reduced by 2.14, 1.40, and 0.63%, which confirms the proposed effectiveness and feasibility of the method.
Today’s global fossil energy sources are decreasing. The development of new energy sources has become a necessary initiative, and wind and solar energy play an irreplaceable role in the green and sustainable development of new energy sources. Traditional statistical methods for wind power prediction generally consider the time series of historical statistical information (Yang et al., 2019), NWP, and a combination of the two prediction methods to achieve better prediction results; deterministic prediction cannot accurately predict the wind power in future time periods, which poses risks to the safe and stable operation of the system. For estimating the potential risk of wind power grid connection to the system, probabilistic prediction overcomes the limitations of deterministic prediction and can predict this impact in advance. Probabilistic prediction can better fill the gap of deterministic prediction in the uncertainty prediction error. The short-term probabilistic prediction in this study focuses on the cumulative distribution function or probability density function of wind power for the next 24 h.
Wang et al. (2018) showed that improving the accuracy of wind power forecasting can effectively reduce the impact of power uncertainty. Most of the studies on uncertainty prediction are holistic modeling and error analysis (Teng et al., 2017) for analyzing the potential impact of wind power uncertainty on system dispatch (Fan et al., 2018). In the work of Yang et al. (2020b), a wind turbine power curve is proposed to describe the conversion relationship between the output power and the wind turbine speed; the power curve of the wind turbine can be calculated to obtain the results of its power prediction. Verma et al. (2018) proposed a wind power day-ahead scenario generation method based on an improved Markov chain model, but the wind power sequence has only low-order Markov properties. In the work of Daisuke et al. (2020), an error analysis method incorporating probabilistic and deterministic prediction of wind power is proposed to analyze the prediction error within each power interval using the estimation method of prediction error distribution characteristics (Yang and Yang, 2016).
There is a spatial correlation and a temporal persistence in wind power (Huang et al., 2022), and the prediction accuracy is improved by considering the spatio-temporal dependence property, as the dimensionality of the reference information is enhanced. The work of Wang et al. (2016) fits the time-series prediction error, but considering only the time-series will produce the problem of overfitting due to the small sample size. Xia et al. (2018) developed a spatial correlation model for wind farms while considering the wake effect. Parametric methods (Gaussian distribution, Cauchy distribution, and Laplace distribution) and non-parametric methods (fuzzy logistic regression, neural networks, and K-nearest neighbor methods) are the main methods to achieve probabilistic predictions (Yang et al., 2020b). Jeon and Taylor (2012) proposed to fit the power prediction error using a non-standard distribution after optimizing the parameters, which provides a basis for the decision making of the operator; the volatility of the wind power causes the prediction error to differ from one of the distributions. Non-parametric fitting essentially does not require the assumption of a priori models and is based on the data structure to infer the regression curve of the measured sample, such as the quantile regression method that can more comprehensively describe the impact of distribution characteristics among variables, while the phenomenon of quantile crossover easily affects the prediction results; the selection of kernel function to some extent affects the performance of kernel density estimation (Sun et al., 2019), and different bandwidth calculation methods are applicable to different data. The results of wind power interval forecasting often require effective evaluation of uncertainty and risk, which requires the forecast interval to ensure the index requirements in terms of clarity and reliability (Wang and Cheng, 2021). Compared with the wind power point forecasting method, the implementation method of the interval forecasting method is more complicated, and the evaluation of the pros and cons of the interval is more difficult. The interval prediction model needs to ensure that the interval coverage index is at a certain level while making the interval width index smaller (Liu et al., 2022), and the model needs to have the ability to balance the two indicators, so as to show good comprehensive ability in the prediction performance.
Aiming at the abovementioned problems, this study proposes a general framework for probabilistic forecasting that considers the spatio-temporal dependence characteristics and is more suitable for modeling. First, the error characteristics of wind power forecasting are analyzed, and a sample separation method that considers both the time series and space is proposed. Second, the random forest (RF) weighted extraction feature of multi-location NWP is used as the input feature in space, and the power values of several dimensions after the correlation test are introduced as the input feature in the time series, taking into account the multiple spatio-temporal scales of wind speed error. Then, based on the particle swarm optimization–deep belief network (PSO–DBN) deterministic prediction model, a joint probability density distribution function of wind speed–wind power prediction error is established; then, kernel density estimation is used. Finally, the overall probability prediction framework proposed in this study is verified by the measured data of a wind farm in Jilin, China. The main contributions of this study include the following: 1) The spatio-temporal model takes into account various meteorological factors of the wind power cluster and extracts its features on the same time plane, which not only retains the spatiality of the data but also ensures its time-series characteristics. 2) Combining both the multi-location NWP features and the error has a greater predictive advantage than the single case of only considering the error. 3) At the same time, the joint probability density modeling of wind speed and prediction error can effectively reflect the spatio-temporal dependence existing in the wind farm.
The typical characteristics of deterministic prediction errors are time-dependent characteristics and spatially independent characteristics, which require the construction of probability density functions on the subset of samples obtained after sample separation of the errors. The samples are extracted according to the time continuity, mainly considering the time-dependent characteristics. While the opposite is true when considering the spatial dependence, the spatial distribution characteristics are needed to extract the samples. The change process of historical data affects the non-smoothness of wind power, which is mainly expressed as the variability of wind power short-term prediction error distribution in different sample subsets.
Most traditional methods for probabilistic wind power prediction consider the accuracy of the prediction model as the main influencing factor of the prediction error distribution without considering that the prediction error is also affected by the time-series and meteorological factors. In this study, we obtain the joint probability density distribution model of different wind speed–wind power prediction errors, which can describe the differences in the distribution of various types of wind speed–wind power prediction errors and improve the prediction performance of the model according to the characteristics of the temporal distribution of probabilistic prediction errors. One of the joint probability distributions is shown in Figure 1. It can be seen that there are significant differences in the distribution of prediction power errors corresponding to different NWP wind speeds.

FIGURE 1. Joint probability distribution of prediction error.
Coalescing and splitting as the two main ways of hierarchical clustering are not good or bad in nature, but it is necessary to choose the required method based on the data characteristics when analyzing the actual problem. Since hierarchical clustering can obtain a complete and multi-level clustering tree, this study mainly uses this coalescent clustering method for sample clustering. The order of input samples has little effect on hierarchical clustering, and the clustering results are more accurate, especially for samples with a small amount of data. Figure 2 shows the specific process of the hierarchical clustering method for clustering the sample data.
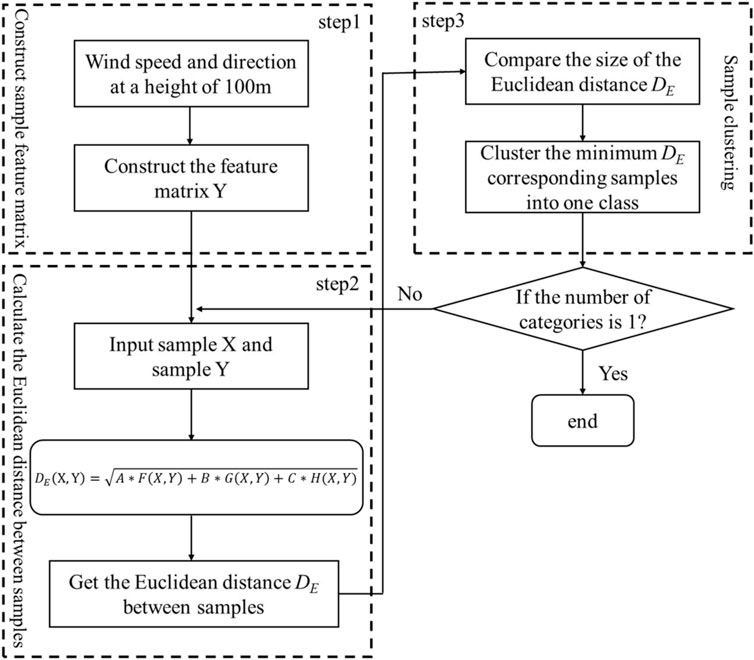
FIGURE 2. Flow chart of hierarchical clustering method.
Step 1: the information of multi-location NWP is processed by RF-weighted feature extraction to assign weights, and the power values of autocorrelation and bias correlation tests are used as inputs to construct the sample feature matrix and assign weighted clustering indicator weights according to the clustering results when clustering individual indicators for hierarchical clustering of combined weights.
Step 2: for input samples X and Y, the conventional Euclidean distance lacks the description of the dynamic change characteristics of the time-series curve (Yang et al., 2022). Therefore, this study chooses the weighted distance between samples to be obtained by the following weighted clustering index calculation formula
In Eq. 1,
Step 3: we compare the magnitudes of the weighted distance metrics and coalesce the two types of samples with the highest similarity as a new set by the obtained
Step 4: we repeat steps 2 and 3, and the clustering stops when the final number of categories is 1.
A back propagation (BP) layer is added and superimposed on a model based on multiple restricted Boltzmann machines (RBM) to form a DBN, which is a combination of a neural network and a probability statistic (Hinton et al., 2006). The RBM consists of a visual layer and an implicit layer, as shown in Figure 3, where the visual layer
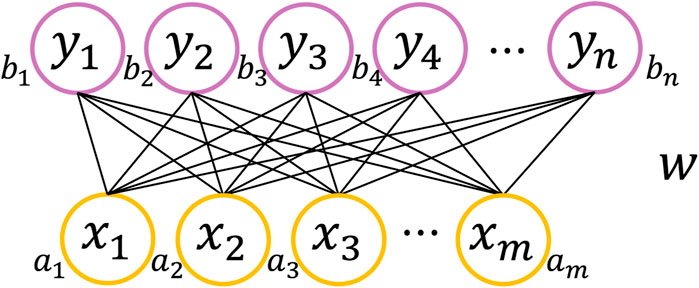
FIGURE 3. RBM structure.
In Eq. 2,
The DBN is shown in Figure 4, and the training process is to train each layer of the restricted Boltzmann machine in turn from the bottom up. By continuously extracting the relevant features of the previous hidden layer, the final layer can obtain the final data features. Kennedy and Eberhart jointly proposed the particle swarm optimization algorithm (PSO) (Hu et al., 2021). This algorithm is currently applied to the problem of combinatorial optimization (Coelho and Sierakowski, 2008), which has the advantage of strong generality and simple implementation. DBNs can cause the training process to fall into local optimal solutions if the initial weights are not chosen properly.
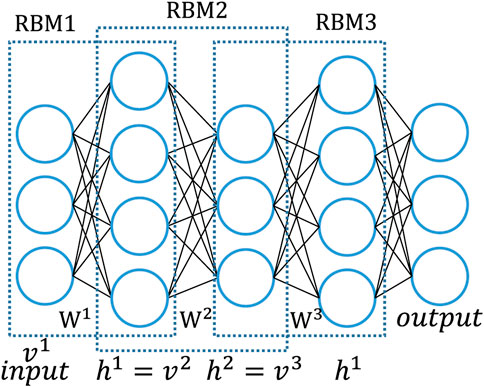
FIGURE 4. DBN structure.
In this study, we chose the PSO algorithm to optimize the neurons and initial weights of each input layer so that the model can map the original information to different feature spaces with the most appropriate number of implied nodes while minimizing the loss of feature information. The construction process of the PSO–DBN network is shown in Figure 5. Let the implicit layer
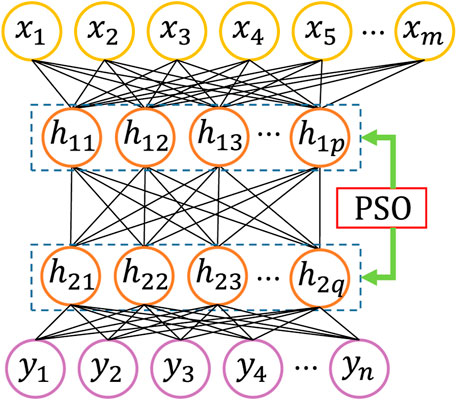
FIGURE 5. PSO–DBN network structure.
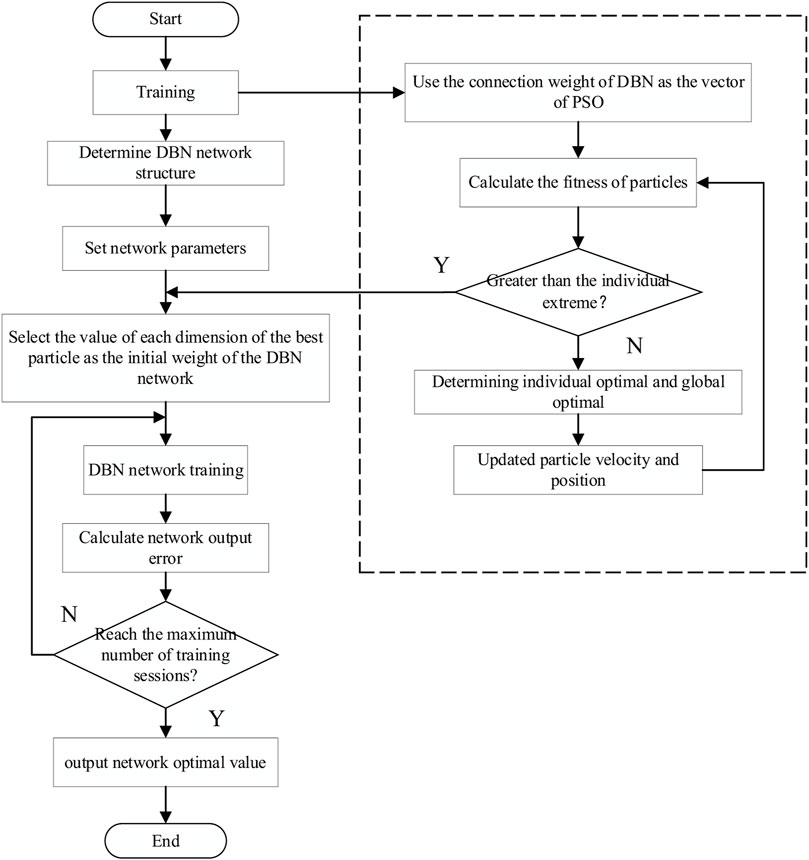
FIGURE 6. Flow chart of PSO–DBN network algorithm.
The traditional quantile regression method based on the continuous distribution function is not used in this study given that the probability density function obtained from the fit is non-continuous. As for the uniform distribution of the cumulative function on (0,1), the introduction of kernel density estimation can be considered as obtained by integrating a window centered on each sample point, and the selection of the kernel density function and bandwidth determines its performance. If the bandwidth is too small, the whole estimation, especially the tails, appears to be more disturbed and, thus, has a tendency to increase the variance; if the bandwidth chosen is too large, some features will be masked. Therefore, the selection of bandwidth is an important parameter to control the estimation accuracy. Because kernel density estimation is a non-parametric estimation method, it can also directly calculate the probability density of the predicted value of wind power without making distribution assumptions. The choice of the kernel function has a great influence on the kernel density estimation. The form of the kernel function is mainly determined by the bandwidth d and the kernel function K. The calculation formula for the kernel density estimation is as follows:
In Eq. 3 d is a smoothing parameter called the bandwidth (d > 0), n is the total number of quantiles, T is the dataset consisting of conditional quantiles, and K is the kernel function (where,
In this study, the kernel density estimation is used to sample the fluctuation interval for obtaining the power uncertainty, which is solved by a given confidence level. The prediction flow using kernel density estimation is shown in Figure 7. First, wind farm data are pre-processed, and deterministic prediction errors are performed based on the PSO–DBN model of historical time period data, considering time dependence and spatial independence, as well as multiple locations of historical time period after processing by RF weighting NWP features, and the classification of prediction errors by hierarchical clustering of several dimensional power values after correlation test of the corresponding moment. Then, for the probability density distribution under different wind resource types, the cumulative probability density distribution of errors under different wind resources is matched by providing multiple locations of the moment to be predicted by RF-weighted processing NWP features and several dimensional power values after the correlation test of the corresponding moment, and using the statistics of the probability density distribution of the historical moment. The magnitude of the cumulative probability density is estimated by kernel density. Finally, according to the corresponding confidence interval provided, such as 85%, the probability and prediction results for that moment can be obtained based on the resulting error series distribution.
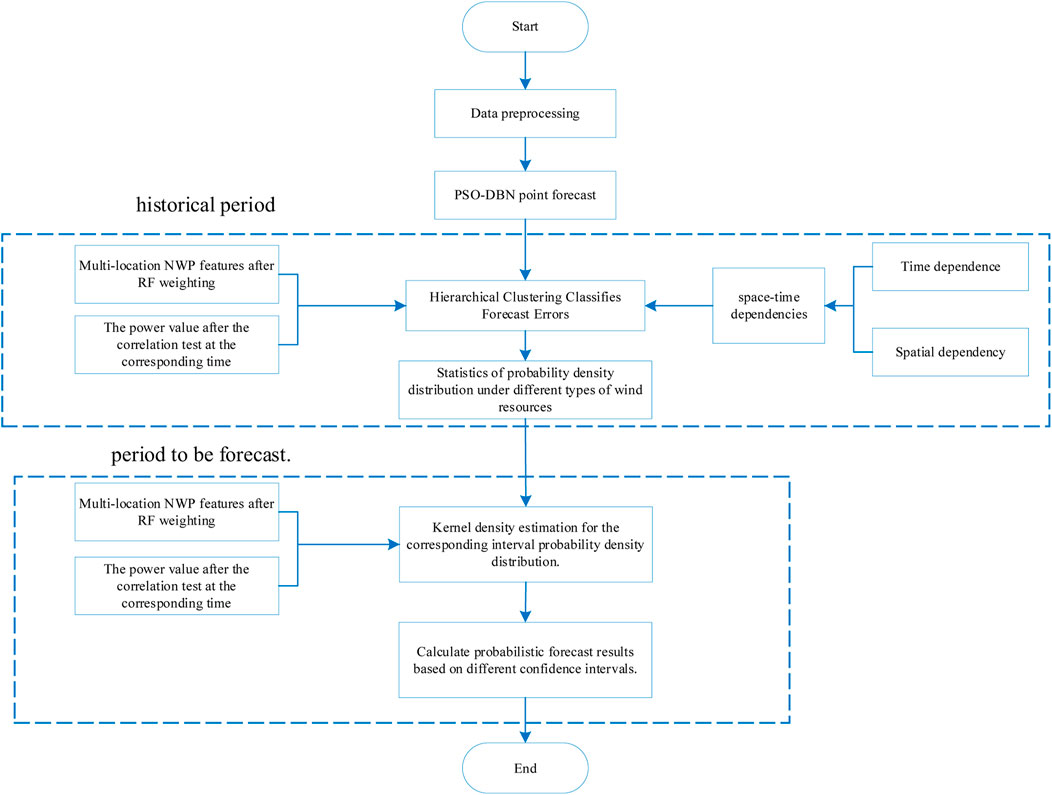
FIGURE 7. Flow chart of short-term prediction of wind power based on kernel density estimation.
In this study, the accuracy and the mean absolute error are selected to evaluate the prediction results for the short-term wind power deterministic prediction results.
The accuracy rate (AR) is used as a basis for assessing the variability of the prediction model results from the true values, and a value closer to 1 indicates that the classification results are more accurate.
The mean absolute error (MAE) is a good reflection of the difference between the predicted and actual values, and thus can accurately reflect the mean value of the point prediction error over the prediction interval.
In Eqs. 4, 5, N denotes the total number of samples in the test set; p denotes the actual value of wind power;
For the results of short-term wind power interval prediction, two indicators, interval coverage, and interval average bandwidth, are selected for evaluation.
The prediction interval coverage probability (PICP), as a basis for assessing the reliability of the prediction model, mainly reflects the probability that the actual power falls within the predicted fluctuation interval.
In Eq. 6,
The prediction interval normalized average width (PINAW)reflects the mean value of the width between the upper and lower limits of the prediction and serves as the primary basis for assessing the clarity of the prediction model.
In Eq. 7,
The average coverage error (ACE) is the difference between PICP and the confidence level
In this study, the measured data of a wind farm with a total installed capacity of 400.5 MW in Jilin, China, are used for arithmetic analysis, and the measured data and NWP data with a temporal resolution of 15 min are selected. Among them, the data of the wind farm for the first 2 months of each season in 2 years were selected as the training set, and the prediction errors of the last month of each season in the previous year were used as the deterministic prediction statistics. The short-term wind power interval prediction uses data from the last month of each season in the latter year.
The accuracy of deterministic prediction is not only related to the network model but also deeply influenced by the network input. The NWP information is diverse, containing wind speed, wind direction, pressure, and temperature at each different height, etc. In this study, the RF-weighted extracted features of multi-position NWP are used as the input features spatially, and the power values of several dimensions after the correlation test are introduced as the meteorological input of the PSO–DBN model. The correlation power values of several dimensions after the correlation test are used as the power inputs to the PSO–DBN model and the correlation power values of several dimensions after the correlation test as the power inputs to the PSO-DBN model.
Figure 8 shows the comparison of the deterministic prediction effect of a day in four seasons. As shown in Figure 8, the power prediction value curve of this paper's method matches the actual power curve better, and the PSO–DBN model can effectively capture some ranges of upward and downward trends to achieve global tracking, while the other two models cannot sense it and can only complete the range over by smoothing. In the interval of small power changes, the PSO–DBN model can still achieve the best fit between the prediction curve and the actual value, while the other two models are mostly higher or lower than the actual value curve, which can achieve a close fit with the change trend but cannot achieve a numerical approximation. In the case of high overall wind farm output levels in autumn, models such as ELM produce large fluctuating errors of dramatic nature, which is highly detrimental to subsequent probabilistic forecasting and affects the forecasting effect. Accurate deterministic forecasting provides a good basis for improving the effectiveness of interval forecasting.
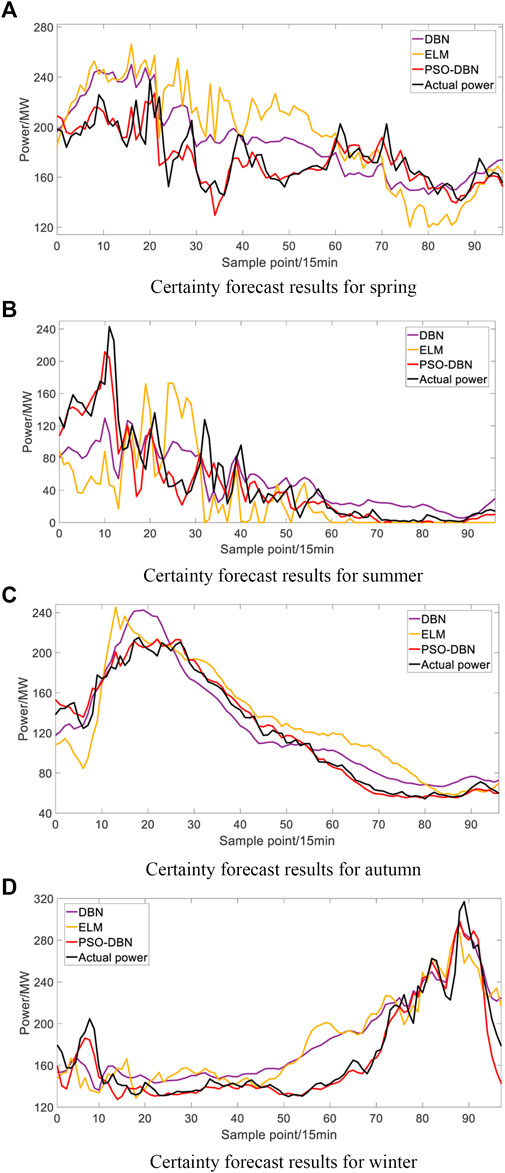
FIGURE 8. Comparison of forecast effects in four seasons.
The specific indexes of each model are shown in Table 1. The prediction effect of ELM and DBN models is unstable in different seasons. In summer, the accuracy of ELM is higher than that of DBN, which is 1.47% higher than that of the previous year; in autumn, the accuracy of DBN is higher than that of ELM, which is 0.74% higher than that of the previous year. The deterministic forecasting errors of the PSO–DBN model in different seasons are lower than those of the two comparison models, and compared with ELM and DBN models, the short-term average absolute errors were 2.34% and 2.91% lower in spring; and 0.29% and 1.17% lower in winter, respectively. In summary, the PSO–DBN model used in this study effectively avoids the influence of seasonal factors and wind farm output level on the deterministic prediction, making the prediction more accurate and stable.
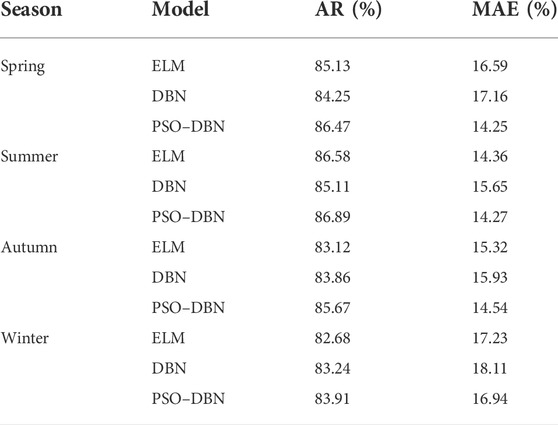
TABLE 1. Comparison of prediction results in four seasons.
Figure 9 shows the effect of interval prediction for a 3-day period in all seasons. As shown in Figure 9, the proposed model can accurately track the wind power variation trend at a given confidence level. In the same confidence interval, the PICP of the proposed method increases and the PINAW decreases to achieve the improvement of both indexes and provide more accurate prediction information for the reliable operation of the system. Whether the wind speed changes smoothly or steeply, the prediction interval width performs well, and it has a relatively good prediction width range in the entire test data set, indicating that it has good interval width adaptability.

FIGURE 9. Prediction effect chart of 3 days in four seasons.
In order to more obviously reflect the superior performance of the model in this study, the widely used quantile regression method, Gaussian distribution, and Bootstrap sampling were selected as the comparison models, and the interval prediction assessment indexes of each model were calculated, and the results are shown in Table 2.
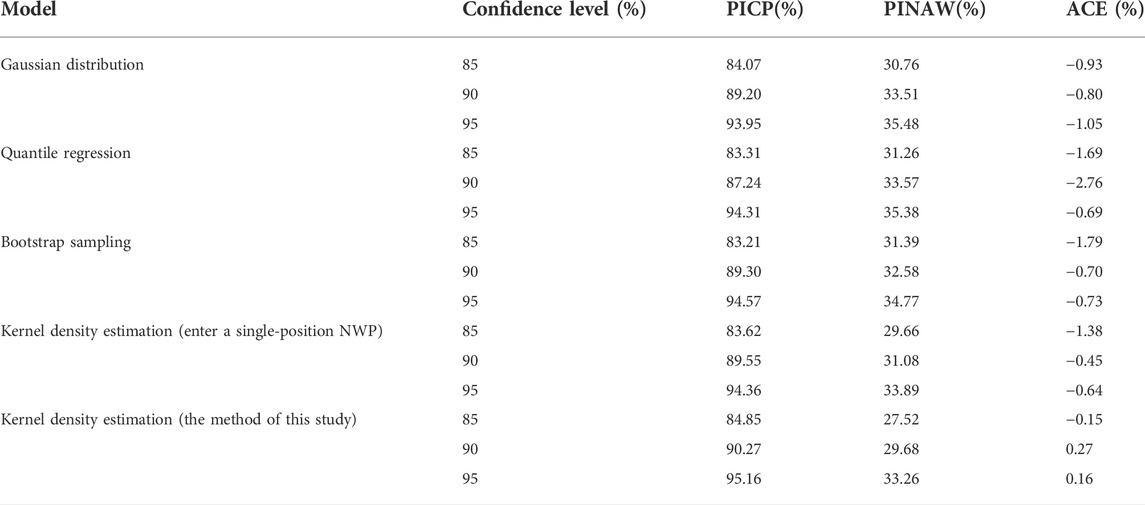
TABLE 2. Comparison of prediction evaluation indicator of each model.
As can be seen from Table 2, compared with other models, the short-term interval forecasting method proposed in this study has the best results, with PICP greater than the other three comparison models at all confidence levels and PINAW less than the other three comparison models. On the premise of ensuring a good forecasting effect, the system reliability is improved and the proposed model has a certain stability; for example, the PICP of the Gaussian distribution increases by 0.86% and PINAW decreases by 0.63% at 85% confidence level compared with the bootstrap resampling method; but at 95% confidence level, the PICP decreases by 0.62% and PINAW increases by 0.71% compared with the Bootstrap resampling method. The ACE indicators of Gaussian distribution, quantile regression, and bootstrap sampling are all less than 0, indicating that the PICP indicator is less than the corresponding confidence level. Compared with the other three methods, the kernel density estimation method has a lower ACE indicator and higher reliability. Compared with the probabilistic prediction method without considering spatio-temporal dependence, the method in this study increased PICP by 1.23%, 0.72%, and 0.80% and reduced PINAW by 2.14%, 1.40%, and 0.63% at each confidence level, respectively.
In this study, a short-term wind power probability prediction method considering the spatial and temporal dependence of prediction errors is developed and concluded as follows:
1) To be able to better reflect the adaptability of the model under different wind resources, the error is statistically analyzed by considering the spatio-temporal dependence, and the proposed model effectively improves the prediction accuracy of probabilistic forecasting
2) Compared with Gaussian distribution, the quantile regression method, and the bootstrap resampling method, the method in this study has higher reliability at different confidence levels, and the average PICP is improved by 1.02%, 1.80%, and 1.06%, and PINAW is reduced by 3.10%, 3.25%, and 2.76%
3) Compared with the probabilistic prediction methods that do not consider spatio-temporal dependence, the method in this study enables the short-term probabilistic prediction of wind farms to be improved
Predicting wind power is of great value to power systems, and its accuracy directly affects the system dispatch and reliable operation of the grid. In order to improve the prediction accuracy, the error is classified by using a hierarchical clustering method based on the consideration of spatial and temporal dependence. The errors of wind power time-series and meteorological factors are fully considered in this study when constructing the prediction model, but the accuracy of the power characteristic curve also affects the accuracy of power prediction, and this part will be further studied in the subsequent work.
The original contributions presented in the study are included in the article/Supplementary Materials; further inquiries can be directed to the corresponding author.
All authors contributed to this research. WH conducted the experiments, performed the experiments, and wrote the draft of this manuscript. YS, BL, ZL, and CS suggested the study idea and shared work in writing and revising the manuscript.
The authors declare that this study received funding from the State Grid Corporation of China Science and Technology project “The Research and Demonstration of the Technology of Probabilistic Optimal Dispatch Considering the Electric/Thermal Load and the New Energy Uncertainty” under Grant 52230020002J. The funder had the following involvement in the study: All authors contributed to this research. WH conducted the experiments, and wrote the draft of this manuscript. YS, BL, ZL, and CS suggested the study idea and shared work in writing and revising the manuscript.
All claims expressed in this article are solely those of the authors and do not necessarily represent those of their affiliated organizations, or those of the publisher, the editors, and the reviewers. Any product that may be evaluated in this article, or claim that may be made by its manufacturer, is not guaranteed or endorsed by the publisher.
Coelho, L. D. S., and Sierakowski, C. A. (2008). A software tool for teaching of particle swarm optimization fundamentals. Adv. Eng. Softw. 39, 877–887. doi:10.1016/j.advengsoft.2008.01.005
Daisuke, N., Masamichi, O., Takeshi, W., and Shinji, K. (2020). Probabilistic wind power prediction based on ensemble weather forecasting. IFAC-Papers. OnLine 53, 12151–12156. doi:10.1016/j.ifacol.2020.12.983
Fan, K., Zhao, D., Chen, M., Bi, W., and Ding, Z. (2018). Evaluation of frequency regulation capability of wind power considering its uncertainty. 2018 Chinese automation congress. Xi'an, China: CAC, 2938
Hinton, G. E., Osindero, S., and Teh, Y. W. (2006). A fast learning algorithm for deep belief nets. Neural Comput. 18, 1527–1554. doi:10.1162/neco.2006.18.7.1527
Hu, S., Xiang, Y., Huo, D., Jawad, S., and Liu, J. (2021). An improved deep belief network based hybrid forecasting method for wind power. Energy 224, 120185. doi:10.1016/j.energy.2021.120185
Huang, Y., Zhang, B., Pang, H., Wang, B., Lee, K. Y., Xie, J., et al. (2022). Spatio-temporal wind speed prediction based on Clayton Copula function with deep learning fusion. Renew. Energy 192, 526–536. doi:10.1016/j.renene.2022.04.055
Jeon, J., and Taylor, J. W. (2012). Using conditional kernel density estimation for wind power density forecasting. J. Am. Stat. Assoc. 107, 66–79. doi:10.1080/01621459.2011.643745
Liu, H. Y., Han, H., Sun, Y., Shi, G. Z., Mei, S., Liu, Z. J., et al. (2022). Short-term wind power interval prediction method using VMD-RFG and Att-GRU. Energy 251, 123807. doi:10.1016/j.energy.2022.123807
Sun, M., Feng, C., and Zhang, J. (2019). Conditional aggregated probabilistic wind power forecasting based on spatio-temporal correlation. Appl. Energy 256, 113842. doi:10.1016/j.apenergy.2019.113842
Teng, Q. J., Wang, C. F., Liang, J., and Liang, Z. T. (2017). “Modeling the temporal correlation of ultra-short term wind power forecast error based on copula theory,” in 2017 IEEE Conference on Energy Internet and Energy System Integration (EI2), Beijing, China, November 26-28, 2017. doi:10.1109/EI2.2017.8245257
Verma, Samidha Mridul, Reddy, Vasanth, Verma, Kusum, and Kumar, Rajesh (2018). “Markov models based short term forecasting of wind speed for estimating day-ahead wind power,” in 2018 International Conference on Power, Energy, Control and Transmission Systems, Chennai, India, November 04, 2018 (ICPECTS), 31–35.
Wang, C., Wang, Z., Sun, H., Liang, Z., Liang, J., and Han, X. (2016). Model of unit commitment with wind farm considering time series characteristic of wind power forecast error. Proc. CSEE 36, 4081. doi:10.13334/j.0258-8013.pcsee.150891
Wang, J., Abdullah, AlShelahi, You, M., Byon, E., and Saigal, R. (2018). Integrative density forecast and uncertainty quantification of wind power generation. IEEE Trans. Sustain. Energy 12, 1864–1875. doi:10.1109/tste.2021.3069111
Wang, J. Z., and Cheng, Z. S. (2021). Wind speed interval prediction model based on variational mode decomposition and multi-objective optimization. Appl. Soft Comput. 113, 107848. doi:10.1016/j.asoc.2021.107848
Xia, Q., Lei, A., Yan, Z., Fenhua, L., Hao, Z., and Jie, Y. (2018). Comparative study of multiple power curve modelling methods. Renew. Energy Resour. 36, 580. doi:10.13941/j.cnki.21-1469/tk.2018.04.018
Yang, M., Dai, B., and Liu, L. (2020b). A review of wind power probabilistic prediction. J. Northeast Electr. Power Univ. 40, 1. doi:10.19718/j.issn.1005-2992.2020-02-0001-06
Yang, M., Shi, C. Y., and Liu, H. Y. (2020a). Day-ahead wind power forecasting based on the clustering of equivalent power curves. Energy 218, 119515. doi:10.1016/j.energy.2020.119515
Yang, M., and Yang, C. (2016). “Uncertainty analysis of wind power prediction based on Granular Computing,” in 2016 International Conference on Probabilistic Methods Applied to Power Systems, Beijing, China, October 16-20, 2016 (PMAPS), 1–5.
Yang, M., Zhang, L., Cui, Y., Zhou, Y., Chen, Y., and Yan, G. (2019). Investigating the wind power smoothing effect using set pair analysis. IEEE Trans. Sustain. Energy 11, 1161–1172. doi:10.1109/tste.2019.2920255
Keywords: spatio-temporal dependence, short-term probabilistic prediction of wind power, hierarchical clustering, improved deep confidence networks, kernel density estimation method
Citation: Sun Y, Li B, Hu W, Li Z and Shi C (2022) A new framework for short-term wind power probability forecasting considering spatial and temporal dependence of forecast errors. Front. Energy Res. 10:990989. doi: 10.3389/fenrg.2022.990989
Received: 11 July 2022; Accepted: 01 August 2022;
Published: 07 September 2022.
Edited by:
Junhui Li, Northeast Electric Power University, ChinaCopyright © 2022 Sun, Li, Hu, Li and Shi. This is an open-access article distributed under the terms of the Creative Commons Attribution License (CC BY). The use, distribution or reproduction in other forums is permitted, provided the original author(s) and the copyright owner(s) are credited and that the original publication in this journal is cited, in accordance with accepted academic practice. No use, distribution or reproduction is permitted which does not comply with these terms.
*Correspondence: Wenhui Hu, MTQwMTgyMjg4N0BxcS5jb20=
Disclaimer: All claims expressed in this article are solely those of the authors and do not necessarily represent those of their affiliated organizations, or those of the publisher, the editors and the reviewers. Any product that may be evaluated in this article or claim that may be made by its manufacturer is not guaranteed or endorsed by the publisher.
Research integrity at Frontiers
Learn more about the work of our research integrity team to safeguard the quality of each article we publish.