 Mohamed Alashqar
 Ying Xue
 Conghuan Yang
 Xiao-Ping Zhang
94% of researchers rate our articles as excellent or good
Learn more about the work of our research integrity team to safeguard the quality of each article we publish.
Find out more
ORIGINAL RESEARCH article
Front. Energy Res., 01 September 2022
Sec. Smart Grids
Volume 10 - 2022 | https://doi.org/10.3389/fenrg.2022.987773
This article is part of the Research TopicIncreasing Penetration of Renewable Sources in Power Systems: Opportunities and ChallengesView all 18 articles
Countries around the world are rapidly deploying renewable energy generation to reduce carbon emissions. Countries in the Gulf Cooperation Council (GCC) are investing heavily in PV generation due to their rich solar resources. As PV technology becomes more mature, future PV developments will largely depend on the cost of the PV generation but there is currently very limited published work that shows a detailed design and in particular the economic analysis of large-scale PV farms. Therefore, this paper uses the Qatar’s first PV farm, the 800MWp Alkarsaah PV farm as a case study to explain the design considerations and especially the economic benefits of large-scale PV farms. Economic comparisons will be made with the most efficient CCGT (combined cycle gas turbine) plants in the network to highlight the economic benefits of PV farms. The results show that the Levelized cost of electricity (LCOE) for this PV farm is 14.03$/MWh, much lower than the LCOE of 39.18$/MWh and 24.6$/MWh from the most efficient CCGTs in the network, highlighting the significant economic benefits of developing PV farms in a low carbon power networks in the future.
Reducing energy-related CO₂ emissions is at the heart of the energy transition and developing renewable energy generation is one of the key measures. Moreover, it helps improve the air quality (Akella et al., 2009; Hung, 2010; Petinrin and Petinrin, 2014; IRENA, 2019) and energy security, especially during instability in the energy market (e.g., during sudden changes in the fossil fuel market (Franco et al., 2017; Chen et al., 2022)).
In the last decade, renewable energy (RE) witnessed a dramatic cost decrease. The Levelized Cost of Electricity (LCOE) is commonly used to evaluate the generation assets or the power system as well as to compare the cost of energy gained from different sources. The LCOE estimates the income necessary to develop and run a generator over a particular cost recovery time. The LCOE calculations include different costs: capital costs, decommissioning, fuel costs, fixed and variable operations and maintenance costs, finance costs, and an anticipated utilisation rate (McCulloch and McCulloch, 2017; Wang et al., 2018a; U.S. Energy Information Administration, 2022; Cucchiella et al., 2017; Kosmadakis et al., 2022; Heidari Yazdi et al., 2022).
Figure 1A shows the LCOE comparison for diverse generation technologies. It illustrates the significant fall in solar power from around 359$/MWh in 2009 to approximate 36$/MWh in 2021, which means a 90% decline in the last decade. In the same period, the LCOE of wind generation decreased from 135$/MWh to 38$/MWh, a 72% reduction. The considerable declines in solar and wind are due to the drop in capital costs (Mcelroy and Chen, 2017).
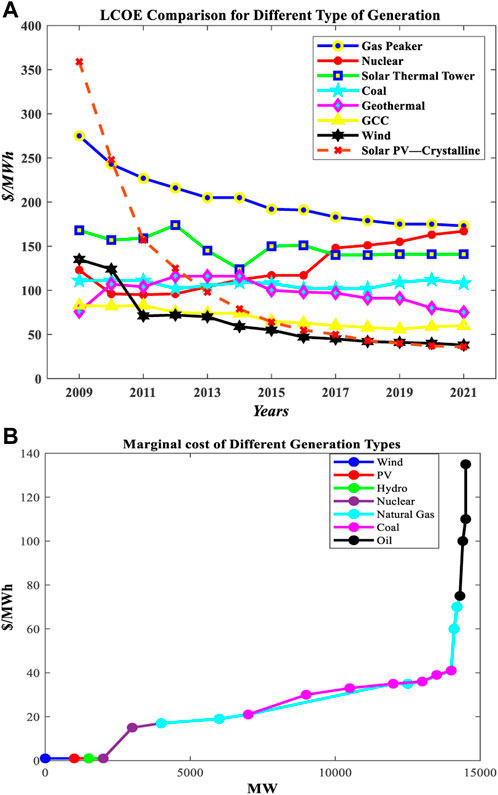
FIGURE 1. Comparison between different types of generation (A) LCOE comparison, (B) Marginal cost comparison (Hartman, 2016; Ray, 2021).
RE systems need significant upfront financial commitments similar to thermal or nuclear power plants. However, the marginal costs of operating the asset and generating electricity are much lower, as illustrated in Figure 1B (e.g., this includes replacing selected PV modules or inverters for solar PV projects and periodic lubrication and general maintenance for wind turbines (Wang et al., 2018b; Srinivasan, 2019; Tian et al., 2020)). It can be seen from Figure 1B that the marginal cost of wind and solar is almost negligible. In contrast, the marginal cost of other generation types increases with increasing power production. For example, it is around 75$/MWh for natural gas, and around 140$/MWh for oil as shown in Figure 1B. It is mainly because the marginal cost of generation for conventional generators is dominated by fuel costs (coal, oil, and gas). On the other hand, for renewable generation, the fuel from the sun and wind is essentially free, and the operations and maintenance (O&M) costs dominate the marginal costs.
These remarkable changes motivate countries to implement renewable energy resources. For example, Figure 2 illustrates that at the end of 2020, the total cumulative PV installations were at 710GWp (Bett, 2022), where China represents 36% of the PV installations, Europe 23%, North America 12%, Japan 9%, India 6%, and the rest of the world 14%.
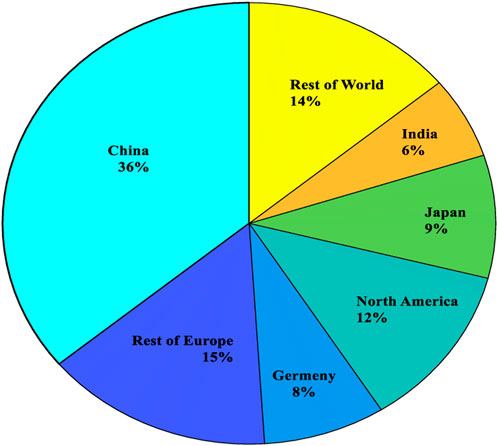
FIGURE 2. PV installation worldwide by region.
Many countries have started utilising deserted areas for installing renewable energy sources (Shah et al., 2019). However, each region around the world has unique challenges. For example, India installed many large-scale PV plants in tropical regions to benefit from the summer sunshine. However, in a tropical climate, the rain caused by monsoon seasons influences the performance of PV plants (gopi et al., 2021). In addition, the paper (Shah et al., 2019) concludes that during the southwest monsoon season, the energy generation dropped by 36% compared to the annual average generation.
In Qatar, the weather plays a factor during summertime due to the dust waves and high humidity. To reduce its impact, at Alkarsaah PV farm, four flees of six robots in each fleet are used to perform cleaning activities at night for 10 hours daily to maintain the PV plant’s performance. There was a coupling between water and power production in Qatar, which makes a stumbling block in front of renewable integration, but with the reverse osmosis (RO) system, the flexibility of integrating renewable energy increases. Qatar focused on RO technologies to decuple water and power production in the recent water project.
Some research discusses small-scale PV farms with rated capacity within 2 MW (Díez-Mediavilla et al., 2010; Chandel et al., 2014; Shah, 2018; Brodziński et al., 2021). Most of these researches focused on PV farms connected to the distribution network and its techno-economic impacts. Other research concentrated on analysing the economic impact of PV installations at the residential level (Woodhouse et al., 2011), (Kizito, 2017). Other research analysed the RE economy in the electricity market framework (Liu et al., 2020) and showed that a continued support policy is required to make wind and solar energy competitive in the energy market (Okere and Iqbal, 2021). compared various solar PV modules for utility-scale PV installation in California and concluded that the bifacial technology gives the best performance in terms of annual energy production. So far, very limited published work on the development and economic analysis of large-scale PV farms. Therefore, this paper contributes to this aspect by presenting a comprehensive analysis of Alkarsaah PV Farm in Qatar under the context of PV developments in the Gulf Cooperation Council (GCC) regions. The objective is to share the experience and especially the economic rationale of large-scale PV farm development with the research and industry community to promote future PV farms’ development further.
This section discusses the motivations that lead GCC countries to move toward renewable energy, the benefits of the GCC interconnection, and the existing and agreed-upon solar energy projects.
The GCC countries, namely the Kingdom of Saudi Arabia (KSA), Kuwait, Bahrain, Qatar, United Arab Emirates (UAE), and Oman, are in the top 25 globally in CO2 emissions per capita. Concerns about global climate and environmental challenges have been raised in the GCC region, necessitating an integrated plan to take a more proactive approach to ecological modernisation and energy policies. The requirements for forming a strategic partnership focused on the GCC region’s sustainability and well-being have been highlighted by regional authorities (Csala and Csala, 2020).
Years ago, it may appear irrational to invest in renewable energy technologies in a location where the oil and gas sectors dominate (Ferroukhi et al., 2013). In addition, such investments do not provide sufficient short-term financial returns and instead create competitors for the region’s key exports. However, this perspective has changed due to the enormous opportunities with renewable generation, and the GCC’s reliance on oil and gas earnings is decreasing.
The GCC Interconnection was established in 2009 by connecting the member states in the GCC (Aljohani and Alzahrani, 2014), (Al-Ebrahim and Jones, 2017). This interconnection aims to share energy during emergencies, reduce the spinning reserves and improve the efficiency of the interconnected power system (Csala and Csala, 2020), (Aljohani and Alzahrani, 2014). Figure 3 shows the GCC interconnection’s single line diagram (SLD). It shows that the member states are connected via a 400 kV extra-high voltage (EHV) network, while the KSA (Kingdom of Saudi Arabia, 60 Hz) is connecting to the GCCIA (50 Hz) through a high-voltage direct-current (HVDC) back-to-back converter. The strength and modernity of the Gulf connection encouraged member states to launch renewable energy projects.
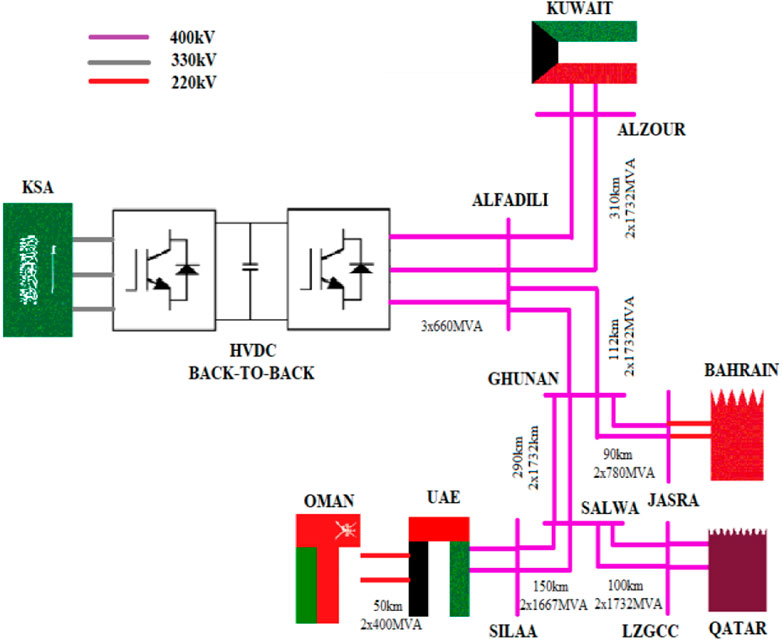
FIGURE 3. SLD of GCC interconnection.
The region witnessed a rapid movement with the launch of renewable energy projects, especially photovoltaic energy. For instance, the KSA constructed a 300 MW PV project in Sakaka province in 2019 (Alnaser et al., 2022), (Alharbi and Csala, 2021).
The United Arab Emirates (UAE) started earlier than other GCC member states and built the first phase of the 13 MW Mohammed bin Rashid Al Maktoum (MBR) solar park in 2013, followed by the second phase rated at 200 MW in 2018, then in 2020, the third phase started operation with a rated capacity of 800 MW. The fourth phase combined three technologies of clean energy: 100 MW from a concentrated solar tower, 250 MW from photovoltaic panels, and 600 MW from a parabolic basin complex (Saqib, 2018; Obaideen et al., 2021; Xiao et al., 2022). The fifth phase started in stages from the second quarter of 2021 with a total capacity of 900 MW (Saqib, 2018). These projects align with the plan to reach 5 GW production from clean energy in 2030 with $13.6bn of investments. In addition, in 2019, a 1177 MW Sweihan solar plant was operated in Abu Dhabi (Ramachandran, Mourad, Hamed). Moreover, the 2 GW Al Dhafra solar project is under construction and expected to be operated by 2022 (Apostoleris and Chiesa, 2019; Cheema et al., 2021; Jim, 2021). As a result, these projects placed the UAE at the top of the renewable energy deployment in the GCC region.
Bahrain comes into the picture with a 100 MW Askar landfill solar project in 2019 (Apostoleris et al., 2021). Furthermore, in 2019, Kuwait commissioned 10 MW at Shagaya renewable energy park (Wang et al., 2021a). Also, Oman started implementing solar energy with 100 and 500 MW in 2020 and 2021, respectively (Wang et al., 2021b). Likewise, in 2020, Qatar announced an 800 MW AlKarsaah PV farm to be entirely operated in 2022. A detailed economic analysis of this PV farm project will be presented in the rest of this paper.
Table 1 shows the existing solar project in the GCC region, and it can be observed that within 4 years, more than 3 GW generation came from PV only, with more projects in the pipeline. Figure 4 shows the LOCE of the existing solar projects in the GCC member states. It can be seen from Figure 4 that from 2018 to 2020, the LOCE of PV solar project cost is decreased by 76.5%, resulting in more PV farm deployment in the GCC countries.
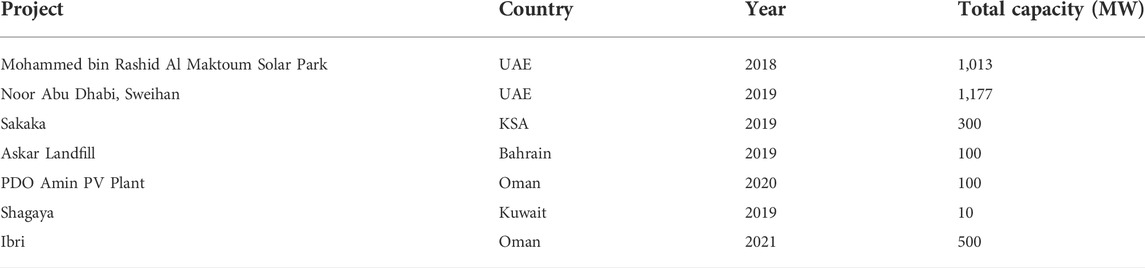
TABLE 1. PV solar projects operated in the GCC region.
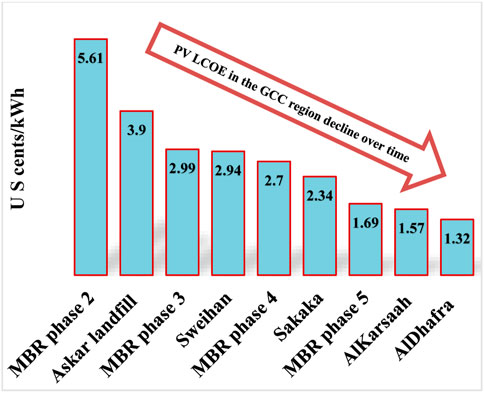
FIGURE 4. The LCOE of the existing solar project in the GCC region.
Qatar General Electricity and Water Corporation (KAHRAMAA) was established in July 2000 to manage and maintain electricity and water supply to the consumers in Qatar. Since its establishment, the electricity sector has witnessed extraordinary growth due to many factors. For example, the population in Qatar has increased by 378% from 2004 (744029) to 2022 (2811774). This significantly increases peak demand and annual energy consumption, as shown in Figure 5. It can be seen from Figure 5 that in 2000, the maximum demand and energy consumption were 1855 MW and 8332GWH, respectively; in 2021, they increased to 8875 MW (468% increase) and 48683 GWh (584% increase). This gives significant challenges in developing generation capacities in Qatar.
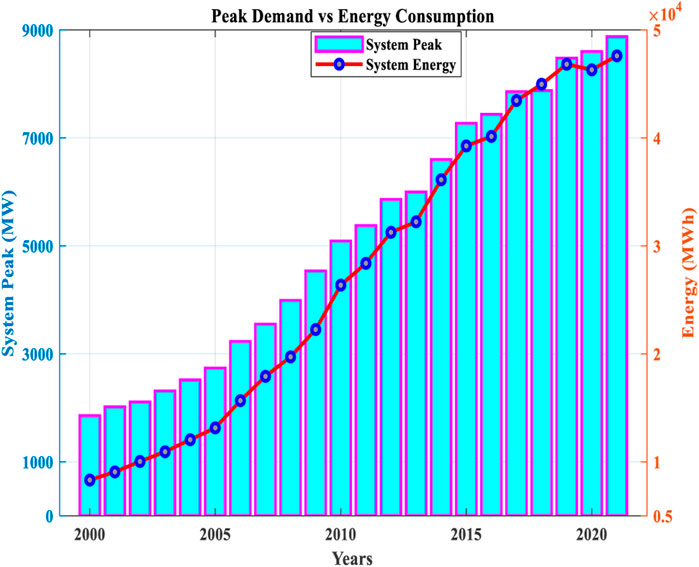
FIGURE 5. Historical peak demand and annual energy consumption from 2000 to 2021.
To meet high demand growth as described above, KAHRAMAA, in collaboration with Independent Power Producers (IPP), expanded the generation capacity from 4032 MW in 2008–10575 MW by commissioning three large-scale power plants in 2009, 2010 and 2017, with an installed capacity of 1995, 2730, and 2520 MW respectively as shown in Figure 6. All these power plants use natural gas to produce electricity. Furthermore, the electricity demand rise has led to the expansion of the transmission network with the commissioning of a new voltage level at 400 kV. Accordingly, the primary substations are increased from 87 in 2000 to 400 in 2021.
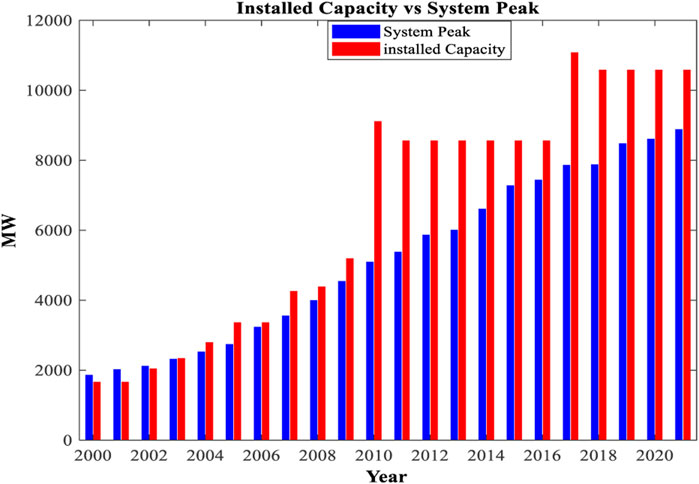
FIGURE 6. The installed capacity and system peak from 2000 up to 2021.
At the same time, the distribution network also witnessed a colossal expansion where the number of substations increased to 18613 in 2020, with a 5% growth compared to 2019. This number is planned to rise further to reach 23400 substations by the end of 2026 to serve the urban development, economic activities and events hosted by Qatar. This expansion paralleled with the specific crucial projects in the country, including but not limited to Lusail City, Metro project, New Port, and 2022 World Cup Stadiums.
The project is planned to be connected to the grid in two phases. The first phase is 350 MW which will be grid-connected in June 2022, and the second phase is expected to be fully operational in July 2022. The total cost of the project is 448.4$M for 800MWp including connection equipment 220 and 132 kV substations. With this capacity, Alkarsaah PV farm is the third largest project in the GCC region of its kind.
The project is designed as build, own, operate, and transfer (BOOT) for 25 years, then the ownership will be transferred to KAHRAMAA. Consequently, KAHRAMAA signed a 25-years Power Purchase Agreement (PPA) with Siraj 1 (the purpose company that was established to build, operate and manage the project) in January 2020 to acquire electricity from the power plant. After the agreement of all relevant parties, AlKharsaah area was chosen as the project site, which is located 80 km2 west of Doha, as shown in Figure 7B. The location was chosen based on several key criteria:
1) The high potential of Global Horizontal Irradiation (GHI) with 2,145 kWh/m2/yr, as shown in Figure 7A, these figures are based on the findings of solar radiation monitoring stations at various locations in Qatar, including AlKharsaah, which were conducted by the Qatar meteorological department (QMD), Qatar Environment and Energy Research Institute (QEERI), Total, Marubeni, and Kahramaa.
2) The local environment impacts because it is located in a desert environment where living creatures are scarce.
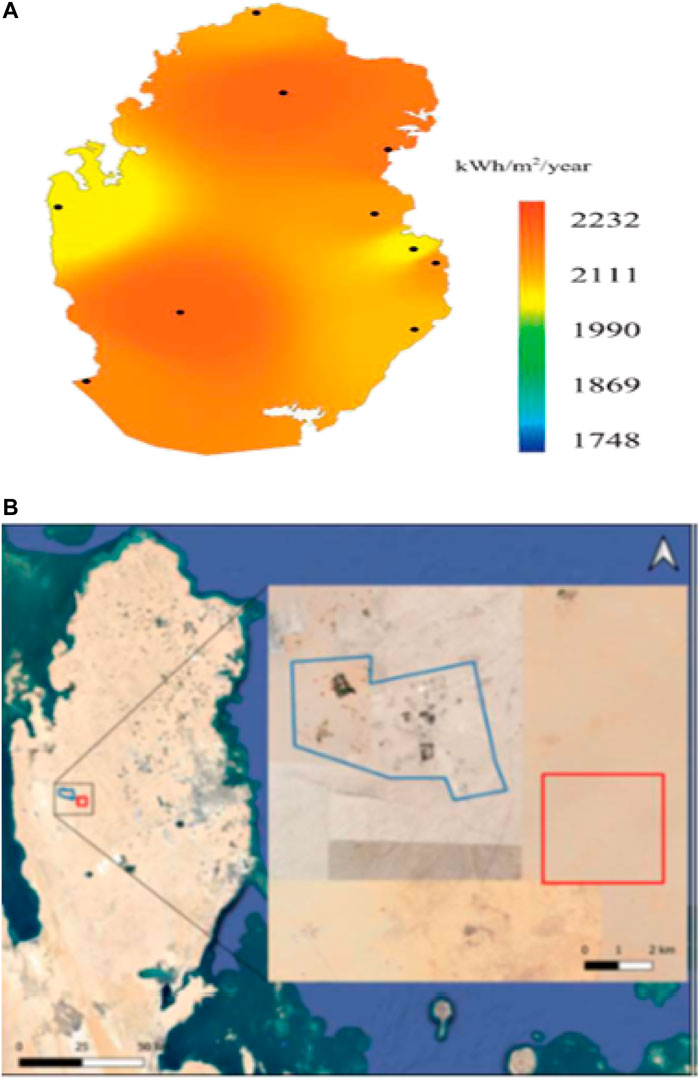
FIGURE 7. (A) Qatar solar GHI (kWh/m2/yr). (B) Alkarsaah PV farm location.
The structure of the PV farm is shown in Figure 8, with the detailed SLD of the system shown in Figure 9. It consists of 1,803,240 modules, where 1,357,920 modules of 445W and 445,320 modules of 440W. There are 108 blocks in the PV plant. Each block is connected to 1 MV substation, and there are 30 inverters connected to 17,280 PV modules that generate 7.5 MW. Hence there are in total 3,240 inverters for the project. Capacitor banks are installed at the AC substation, as shown in Figure 8, to meet the reactive power control requirement as explained subsection D.
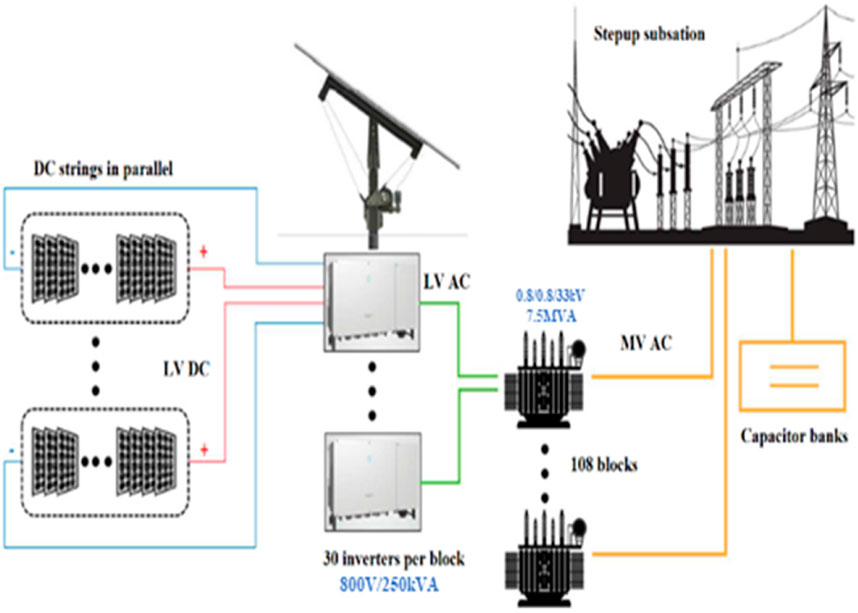
FIGURE 8. PV farm structure.
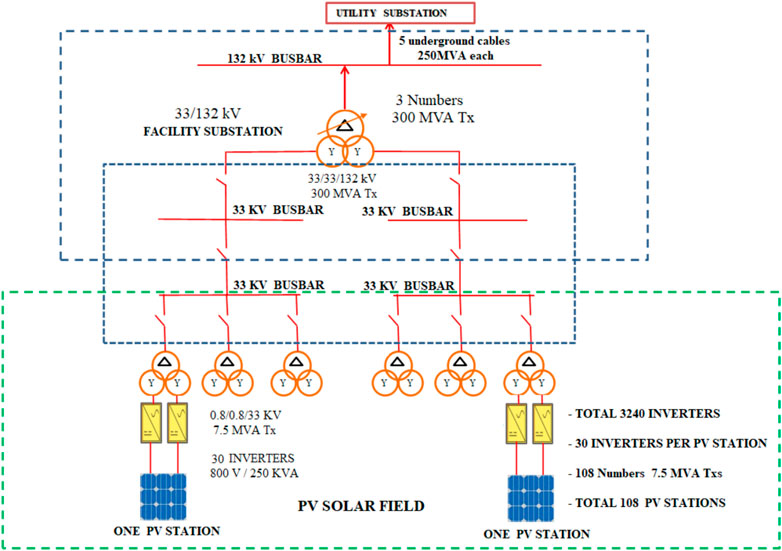
FIGURE 9. PV farm in detail.
The overall capacity of the solar project will be able to cover 7.5% of the 2022 peak demand. Also, the project will contribute to Qatar’s commitment in hosting a carbon-neutral FIFA World Cup in 2022, which is a goal of the Qatar National Vision 2030. In addition, the plant will save 26 million tonnes of CO2 throughout its lifespan, contributing to the ambitious goal of reducing carbon emissions by one million tonnes every year starting from 2022. Furthermore, the project will help achieve sustainable development by reducing the dependency on gas for energy generation. AlKharsaah PV farm uses cutting-edge solar energy technology such as twin panels to conserve space, automated sun-tracking systems, and robotic solar panel cleaning to enhance production efficiency and lower plant operating costs. Additionally, more than two million bifacial solar modules with trackers will maximise efficiency.
The power system of Qatar consists of eight power plants as shown in Figure 10A with a 10.6 GW installed capacity. Three combined cycle power plants with 2730, 2520, and 1992 MW are connected to the 400 kV level, and another two combined cycle power plants with 756 and 1025 MW are connected to the 220 kV level. In addition, three open cycle power plants are connected to the 220 kV level. All power plants use gas as a fuel supply. The GCCIA interconnector is connected to the grid at 400kV, as shown in Figure 10A as well.
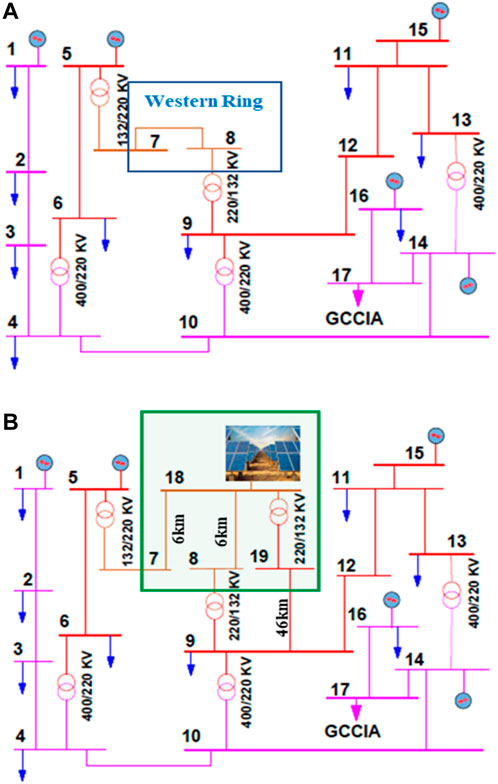
FIGURE 10. Qatar power system SLD (A) without PV farm. (B) With PV farm.
The weakest point in the network is the western ring from bus 7 and bus 8 in Figure 10A. This ring has double circuit overhead lines of 205 km in length. Therefore, the ring suffers from voltage stability in case of n-2 contingency, and during normal operation, the voltage profile is poor because there is no reactive power compensation. Consequently, due to the high radiation in the Alkarsaah area and reactive power support ability (explained below) from the PV farm, the preferred option is to connect AlKarsaah PV farm to the 132 kV subnetwork as a loop-in-loop-out (bus 18 in Figure 10B) between two existing substations (bus 7 and 8) in the western ring. The length between the existing substation and the PV farm is 6 km as shown in Figure 10B. In addition, the substation will be connected to the new Kahramaa substation (LILO substation), bus 18 in Figure 10B, through five underground cables to meet the n-2 criteria. Moreover, the PV farm will be connected to the 220 kV network via a double circuits overhead line for a 35 km distance, then an 11 km cable portion to the existing substation, bus 9 in the single line diagram (SLD), as shown in Figure 10B.
For reactive power control capability of the PV farm, according to the PPA and the grid code, it must be able to provide reactive power at the Point of interconnection (POI) at any operating point inside the P-Q/Pmax profile as shown in Figure 11.
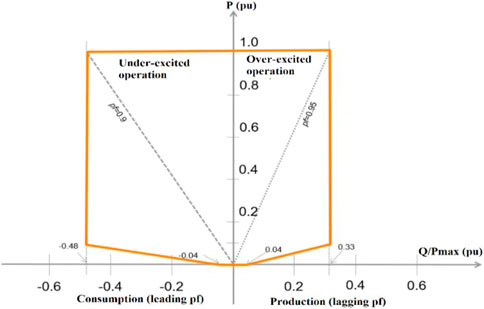
FIGURE 11. Q/P operation.
To achieve that, the Power Plant Controller (PPC) of Al-Kharsaah PV farm controls the inverters and capacitor banks to change its reactive power generation/absorption to achieve a reactive power setpoint imposed either by the on-site operator or by the grid operator. Consequently, during the daytime, when the load increases, the PV farm will inject up to 462.9MVAR to the network to maintain the voltage at the POI within the operational limits. Therefore, the inverters will operate with a power factor between −0.95 and +0.95 (±252.9MVAr), and capacitor banks (6 × 35MVar) will compensate for the remaining reactive power. On the other hand, during nighttime, when the load decreases, the inverters will absorb reactive power so that the KAHRAMAA grid can deliver to the PV plant 359 MVAr at POI. The reactive power capability analysis concluded that the PV farm with additional reactive power support (capacitor banks 6 × 35 MVA) is capable to meet the reactive power requirements at POI and there is no need for reactors to absorb the reactive power from the network during low load.
In addition, the PV farm will remain at the maximum available power when the frequency range between 47.5≤ f ≤ 50.5, then gradually curtail its output when the frequency hits 50.5 Hz to reach zero at a frequency equal to 51.5 Hz. Figure 12 shows This slope is programmed into the Active Power—frequency function of the PPC, taking into consideration the limitation during over frequency.
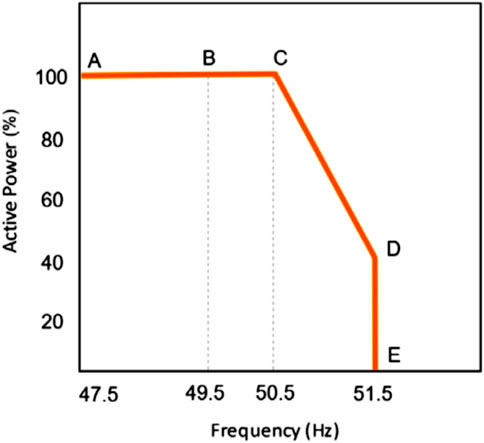
FIGURE 12. Active Power limitation during over frequency.
Table 2 shows the cost of network modifications (as shown in Figure 10B) due to integrating the 800 MW Alkarsaah PV farm. The cost of 220 and 132 kV Gas-insulated substations is 44M$, while the cost of both 220 and 132 kV overhead lines is 67.2M$, and the cost of modification at the existing substations is 0.5M$.
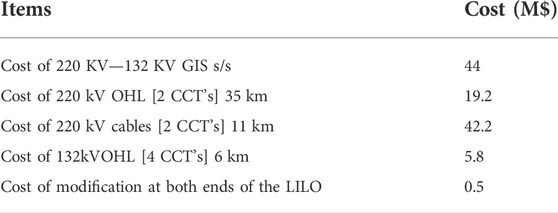
TABLE 2. Cost of modificationsin the network.
The PV farm generates power during the daytime. Due to the stability of weather in summer in Qatar, the generated power from the PV is predictable when there is no cloud. Figure 13A shows a typical daily generation during June when the electricity demand is at its peak. It can be seen that power starts to be injected into the grid at around 4:30 a.m. at sunrise and increases to reach the maximum at 9 a.m. because of the maximum power point tracking. The maximum output power remains for 6 hours, then declines to zero at 6 p.m. (sunset) due to the drop in irradiance. This generation behaviour will allow grid operators to stop the inefficient conventional generation on the system. Figure 13B accentuates the generation forecasted and actual PV generation profile throughout 1 day. It displays the pattern of the PV generation from the sunrise to the sunset, where it jumps in the actual profile because the system operators allow the PV farm to generate more power than the plan during peak to utilise the cheapest available energy instead of synchronising conventional generation to pass the peak time.
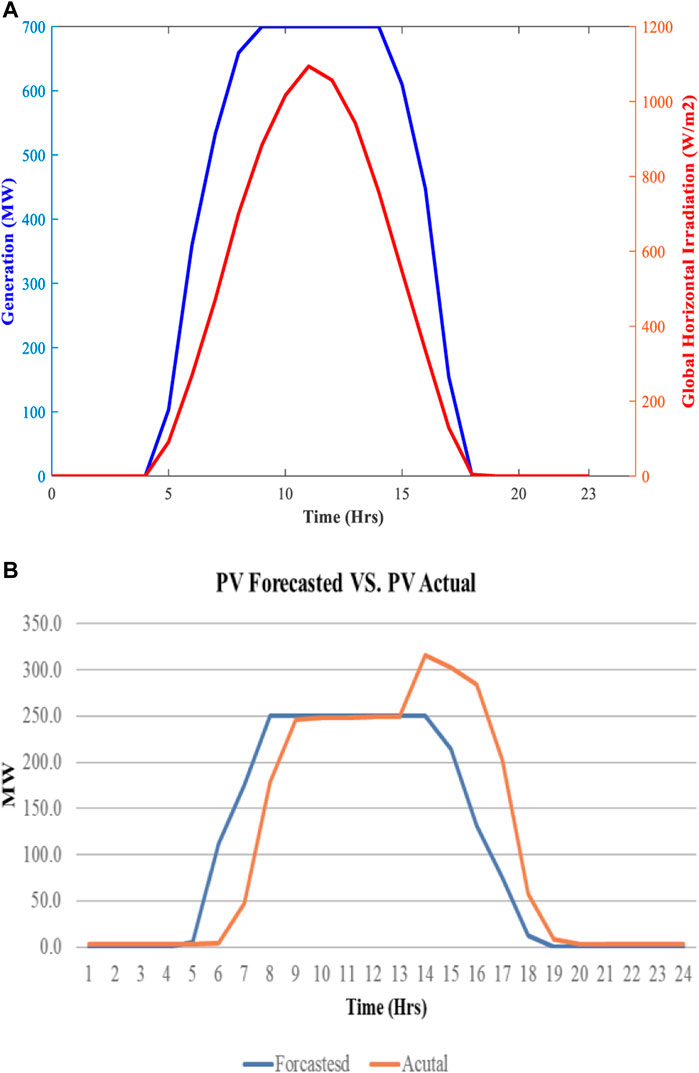
FIGURE 13. (A) Typical daily generation profile. (B) Forecasted and actual generation profile for 1 day.
Figure 14 illustrates the active power produced from the PV farm for 2 weeks since the date of commissioning and shows only the 1st phase, while the 2nd phase has not yet operated because the network upgrading under commissioning is expected by mid of August.
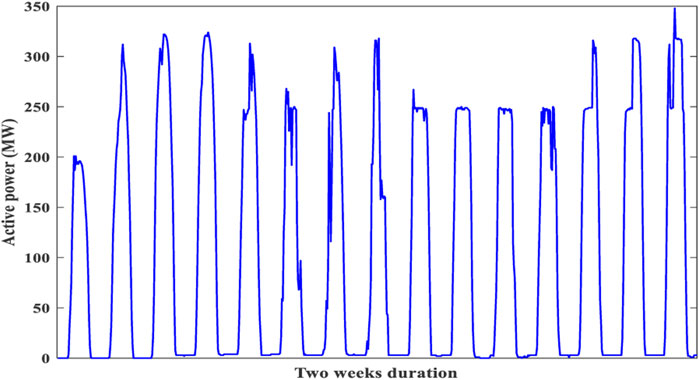
FIGURE 14. Hourly active power generated from PV farm.
After the first phase of commissioning, the PV fluctuations occurred due to the partly cloudy weather. It was the first time that system operators experienced this phenomenon, as shown in Figure 15. However, these changes in generation output did not affect the system frequency because it happened early morning when the minimum demand and the spinning reserve were at the highest and the automatic generation control (AGC) took action to maintain the balance.
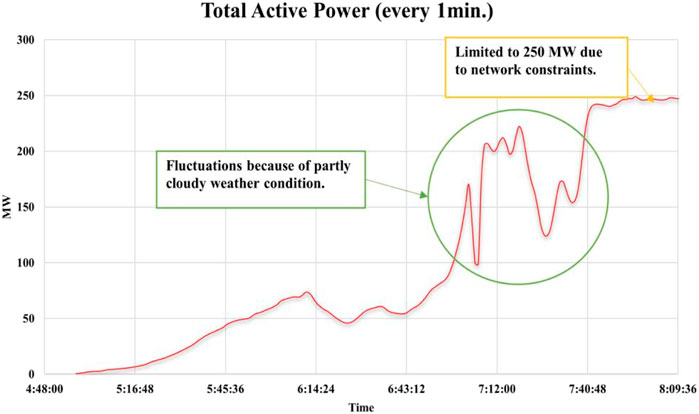
FIGURE 15. PV fluctuation due to partly cloudy weather conditions.
Figure 16 shows the power flow at the PV farm area and the voltage at different buses during the peak time. In addition, Figure 17A,B represent the voltage at the PV farm and POI buses and the reactive power flow from the PV farm. It can be seen that the inverters operate according to network requirements and within the Q/P operation curve, as shown in Figure 11. It can be seen that the voltage at each bus is close to the nominal value for 132 and 220 kV voltage levels.
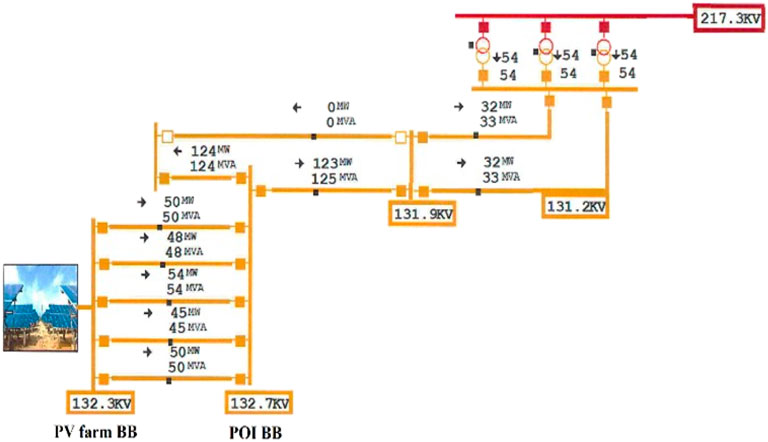
FIGURE 16. Power flow at peak time.
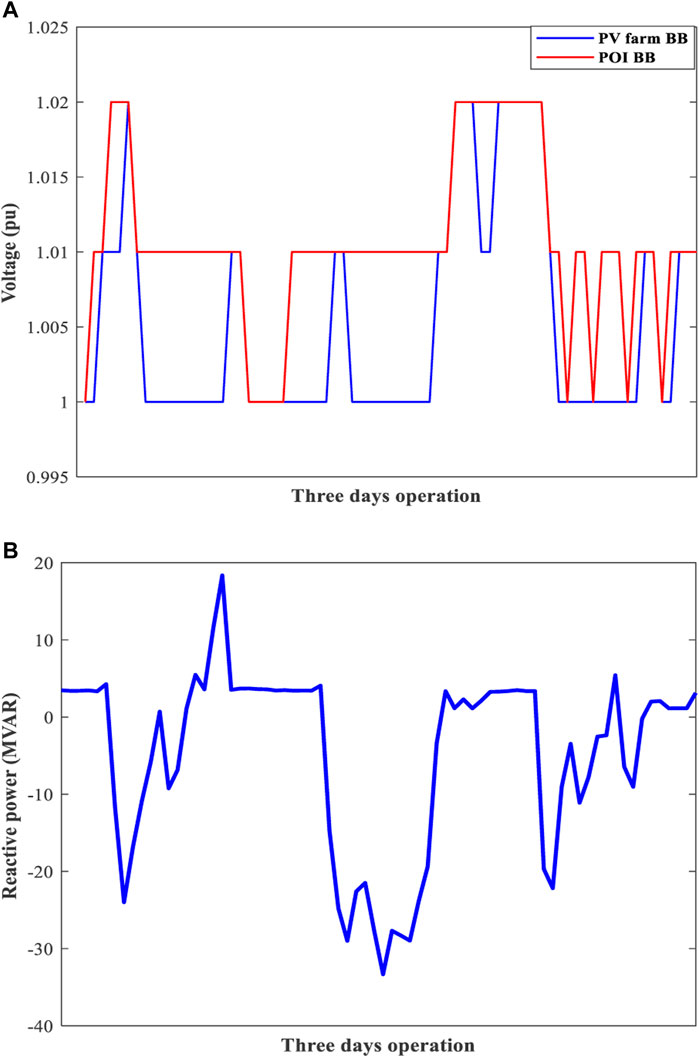
FIGURE 17. (A) Voltage at PV farm and POI buses for 3 days of operation. (B) Reactive power flow from the PV farm for 3 days of operation.
The base case forecasted peak demand for summer 2022 is 9300MW, higher than the peak recorded in summer 2021, 8875 MW. However, the high forecast scenario is 9557MW, and the PV farm will contribute positively because of its availability during peak times. Figure 18 illustrates the forecasted peak demand in 2022 and the generation contributions to meet the demand on the designated date. It is also noticeable that solar power production remains at its peak during the peak demand because of solar tracker usage. Therefore, the thermal units reduce the output power to leave the space for the cheapest energy in the grid. Also, when solar power production decreases due to the low irradiance, the conventional power plant ramps up to maintain the balance between demand and generation.
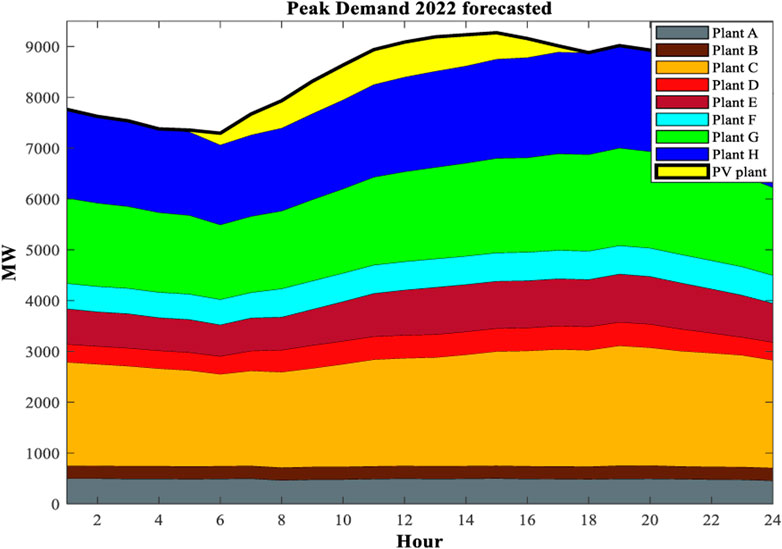
FIGURE 18. The forecasted peak demand in 2022.
The FIFA World Cup (FIFA WC) is planned to start on 18th November 2022 and will continue for 1 month; it is considered the most challenging tournament due to the considerable increase in demand. Figure 19 explains the pattern of the electricity demand during the FIFA WC. Also, it shows the peak demand is shifted to the evening peak during winter compared to the afternoon peak during summer in Figure 18; this is due to the considerable change in weather and temperature reduction. In addition, Figure 19 clarifies the PV generation during the WC tournament, which has slight variations that will be covered by the existing thermal units or the GCCIA interconnector.
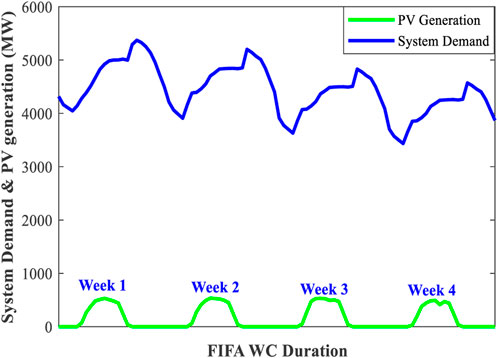
FIGURE 19. System demand and PV generation during the FIFA WC.
Table 3 shows that the most efficient existing plants in Qatar power system, plant D and plant E, are compared with the PV farm to highlight the economic benefits. These two plants have the biggest generation in the system and use gas as a fuel supply. Plant D has a 2730 MW capacity, and plant E has a 2520 MW capacity. Table 3 shows the detailed comparison of costs between these two plants and the PV farm. First, the total capacity cost of $ per KW of the solar is higher than the total capacity cost of both plant D and plant E, considering the size of all plants. In addition, Solar’s fixed operations and maintenance (O&M) costs are higher than others.
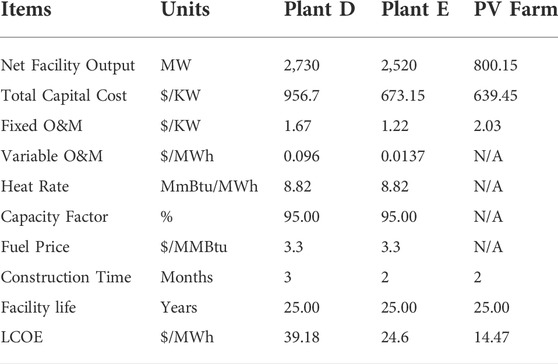
TABLE 3. Comparison between two newest conventionalgeneration and PV farm.
However, the variable O&M of plants D and E are 0.096$/MWh and 0.0137$/MWh, respectively, whereas the variable O&M is not applicable for the solar project. Finally, the LCOE of the solar project is relatively low at 14.03$/MWh, while Plant D is 39.18$/MWh and Plant E is 24.6$/MWh. The calculation of the LCOE is based on the following equations where the system’s lifetime, the amount of energy it will produce, and the input costs are considered.
where TLC represents the total lifetime cost, TLO represents the total lifetime output,
The above calculations can be directly applied to other PV farm projects as well by considering subsidies, tax rebates, tax abatements, and other government initiatives that may further decrease the LCOE of PV farm. For example, if the government provides a subsidy for the capital investment in a solar system, the initial cost of establishing the system falls, and the total cost falls proportionally. In addition, the high solar irradiation directly relates to the low LCOE of a project. For example, building an 800 MW PV farm in a different country, e.g., the UK, will require more PV panels to capture more solar irradiation, which leads to an increase in the capital cost of the project and the LCOE. Moreover, the effective daily irradiation time is one of the most critical variables in analysing the total lifetime energy production PV. For example, Qatar has more GHI yearly than the UK, and the weather throughout the year in Qatar is more stable than in the UK. Therefore, increasing the energy production throughout the lifetime of the PV farm will reduce the LCOE.
Another important financial consideration for utility companies and LCOE is the capacity and output charges. For a conventional power plant, the capacity charge is paid based on the availability of the generation in $/MW/h, and the output charge is based on the actual energy output in $/MWh. In Qatar, only the output charge is considered for PV farm, but for thermal units, the utility must pay the capacity charges for the units, as long as they are available but not necessarily running. Table 4 shows the capacity and output charge rates for thermal units and PV. It can be seen from Table 4 that the charges to the utility company for the PV farm is much less than that for thermal units.
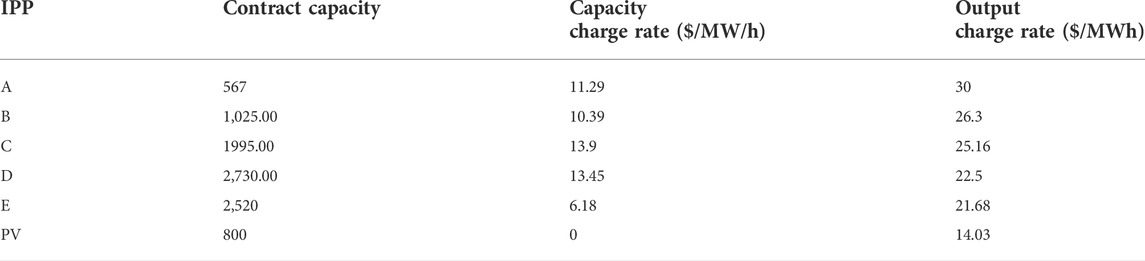
TABLE 4. Capacity and output charge rates.
From an environmental point of view, the use of RE saves the use of fossil fuels and hence the associated costs. Table 5 shows a detailed financial comparison between the Alkarsaah PV farm and the most efficient gas power plant (i.e., plant E as mentioned above) to highlight the benefits of PV generation. It can be seen from Table 5 that the total energy forecasted from all generations is around 51 TWh in 2022, and the energy forecasted from Alkarsaah PV farm is around 2 TWh, representing 4% of the total energy. Consequently, the total consumed gas is 484,529,036 MMBTU, and the average amount of gas saved in 2022 is around 14,400,000MMBTU, which saves 44M$. If Alkarsaah PV farm is not installed, the most efficient CCGT will be running with a total equivalent cost of around 2.063B$ for 25 years of operation, including the capacity and operating charges. In contrast, the total payment of the solar project for the 25-years contractual period will be 750M$ as shown in Table 5. As a result; the total savings will be 1.313B$.
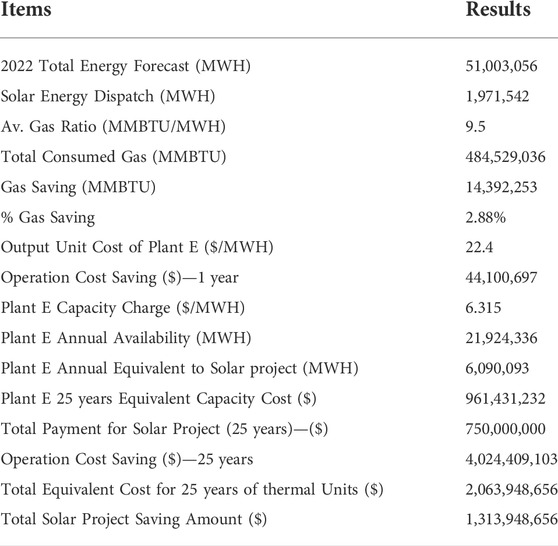
TABLE 5. Financial comparison between PV solar operation and thermal operation.
Many PV farm projects have been commissioned in the last 5 years in the GCC region due to the high potential of solar irradiance. As a result, some GCC solar projects recorded the lowest LCOE globally at that time. In order to share the experience of large-scale PV farm development in the GCC region and further promote the development of PV farms, the 800MWp Alkarsaah PV Farm in Qatar has been discussed in detail in this paper. Its site selection and structure are explained, and its financial benefits are discussed in detail. In particular, detailed economic analysis has shown that this PV farm can achieve a record low LCOE at 14.03$/MWh, much lower than the 39.18$/MWh and 24.6$/MWh of the most efficient CCGTs in the network. Such analysis can provide useful information for the research community and industry in developing future large-scale PV farms.
As part of our future work, the impact of Alkarsaah PV farm on the practical network operation will be analysed and reported after the system is put into service.
The original contributions presented in the study are included in the article/supplementary material, further inquiries can be directed to the corresponding authors.
MA and YX developed the original ideas and prepared the manuscript; CY and X-PZ helped revise the paper.
The authors declare that the research was conducted in the absence of any commercial or financial relationships that could be construed as a potential conflict of interest.
All claims expressed in this article are solely those of the authors and do not necessarily represent those of their affiliated organizations, or those of the publisher, the editors and the reviewers. Any product that may be evaluated in this article, or claim that may be made by its manufacturer, is not guaranteed or endorsed by the publisher.
Akella, A. K., Saini, R. P., and Sharma, M. P. (2009). Social, economical and environmental impacts of renewable energy systems. Renew. Energy 34 (2), 390–396. doi:10.1016/j.renene.2008.05.002
Al-Ebrahim, A. (2017). “Integrating new and renewable energy in the GCC region,” in Renewable energy integration. Editor L. E. Jones. Second Edition (Boston: Academic Press), 189–197. doi:10.1016/b978-0-12-809592-8.00014-7
Alharbi, F. R., and Csala, D. (2021). Wind speed and solar irradiance prediction using a bidirectional long short-term memory model based on neural networks. Energies 14 (20), 6501. doi:10.3390/en14206501
Aljohani, T. M., and Alzahrani, A. M. (2014). The operation of the GCCIA HVDC project and its potential impacts on the electric power systems of the region. Int. J. Electron. Electr. Eng., 207–213. doi:10.12720/ijeee.2.3.207-213
Alnaser, N. W., Albuflasa, H. M., and Alnaser, W. E. (2022). The transition in solar and wind energy use in Gulf cooperation Council countries (GCCC). Renew. Energy Environ. Sustain. 7 (4). doi:10.1051/rees/2021034
Apostoleris, H., Al Ghaferi, A., and Chiesa, M. What is going on with Middle Eastern solar prices, and what does it mean for the rest of us? Prog. Photovolt. Res. Appl., 2021, 29.6: 638–648. doi:10.1002/pip.3414
Apostoleris, H., and Chiesa, M. (2019). “The role of financing in realising ultra-low solar electricity prices in the Middle East,” in 2019 IEEE 46th Photovoltaic Specialists Conference (PVSC), 0595–0600.
Brodziński, Z., Brodzińska, K., and Szadziun, M. Photovoltaic farms—economic efficiency of investments in north-east Poland. Energies 14 (8). Art. no. 8, Jan. 2021.
Chandel, M., Agrawal, G. D., Mathur, S., and Mathur, A. (2014). Techno-economic analysis of solar photovoltaic power plant for garment zone of Jaipur city. Case Stud. Therm. Eng. 2, 1–7. doi:10.1016/j.csite.2013.10.002
Cheema, A., Shaaban, M. F., Ismail, M. H., and Azzouz, M. A. (2021). “A new approach for long-term optimal scheduling of photovoltaic panels cleaning,” in 2021 International Conference on Electromechanical and Energy Systems (SIELMEN), 319–324. doi:10.1109/sielmen53755.2021.9600271
Chen, J., Su, F., Jain, V., Salman, A., Tabash, M. I., Haddad, A. M., et al. (2022). Does renewable energy matter to achieve sustainable development goals? The impact of renewable energy strategies on sustainable economic growth. Front. Energy Res. 10. doi:10.3389/fenrg.2022.829252
Csala, F. R., and Csala, D. (2020). GCC countries' renewable energy penetration and the progress of their energy sector projects. IEEE Access 8, 211986–212002. doi:10.1109/access.2020.3039936
Cucchiella, F., D’Adamo, I., and Gastaldi, M. (2017). Economic analysis of a photovoltaic system: A resource for residential households. Energies 10 (6). Art. no. doi:10.3390/en10060814
Díez-Mediavilla, M., Alonso-Tristán, C., Rodríguez-Amigo, M. C., and García-Calderón, T. (2010). Implementation of PV plants in Spain: A case study. Renew. Sustain. Energy Rev. 14 (4), 1342–1346.
Ferroukhi, R., Ghazal‐Aswad, N., Androulaki, S., Hawila, D., and Mezher, T. (2013). Renewable energy in the GCC: Status and challenges. Int J Energy Sect. Man 7 (1), 84–112. doi:10.1108/17506221311316498
Franco, A., Shaker, M., Kalubi, D., and Hostettler, S. (2017). A review of sustainable energy access and technologies for healthcare facilities in the Global South. Sustain. Energy Technol. Assessments 22, 92–105. doi:10.1016/j.seta.2017.02.022
gopi, A., Sudhakar, K., Ngui, W. K., Kirpichnikova, I. M., and cuce, E. (2021). Energy analysis of utility-scale PV plant in the rain-dominated tropical monsoon climates. Case Stud. Therm. Eng. 26, 101123. doi:10.1016/j.csite.2021.101123
Hartman, D. (2016). Economic characteristics of electricity. Washington, D.C: R STREET’S ELECTRICITY 101 SERIES NO.
Heidari Yazdi, S. S., Rahimi, T., Khadem Haghighian, S., Bagheri, M., and Gharehpetian, G. B. (2022). Over-voltage regulation of distribution networks by coordinated operation of PV inverters and demand side management program. Front. Energy Res. 10. doi:10.3389/fenrg.2022.920654
Hung, C. (2010). Environmental impacts of renewable energy: An overview of life cycle results. MS thesis. Trondheim: Institutt for energi-og prosessteknikk.
IRENA (2019). Future of solar photovoltaic, Abu Dhabi. IRENA. [Online]. Available media/Files/IRENA/Agency/Publication/2019/Nov/IRENA_Future_of_Solar_PV_2019.pdf (Accessed January 10th, 2022).
Jim, K. (2021). “Pairing coal with solar: The UAE’s fragmented electricity policy,” in Low carbon energy in the Middle East and North africa (Cham: Palgrave Macmillan), 57–91.
Kizito, R. M. (2017). An economic analysis of residential photovoltaic systems with and without energy storage. Fayetteville: University of Arkansas.
Kosmadakis, M., and Kosmadakis, G. (2022). “Resource, environmental, and economic aspects of SGHE,” in Salinity gradient heat engines. Editors A. Tamburini, A. Cipollina, and G. Micale (Sawston: Woodhead Publishing), 319–353. doi:10.1016/b978-0-08-102847-6.00006-1
Liu, W., Zhang, X., Wu, Y., and Feng, S. (2020). Economic analysis of renewable energy in the electricity marketization framework: A case study in guangdong, China. Front. Energy Res. 8. doi:10.3389/fenrg.2020.00098
McCulloch, C. S., and McCulloch, M. D. (2017). Levelized cost of electricity for solar photovoltaic and electrical energy storage. Appl. Energy 190, 191–203. doi:10.1016/j.apenergy.2016.12.153
Mcelroy, M. B., and Chen, X. (2017). Wind and solar power in the United States: Status and prospects. Csee Jpes 3 (1), 1–6. doi:10.17775/cseejpes.2017.0002
Obaideen, K., Nooman AlMallahi, M., Hai Alami, A., Ramadan, M., Abdelkareem, M. A., Shehata, N., et al. (2021). On the contribution of solar energy to sustainable developments goals: Case study on Mohammed bin Rashid Al Maktoum Solar Park. Int. J. Thermofluids 12, 100123. doi:10.1016/j.ijft.2021.10012
Okere, A., and Iqbal, M. T. (2021). “Techno-economic comparison of emerging solar PV modules for utility scale PV installation,” in 2021 IEEE 12th Annual Information Technology, Electronics and Mobile Communication Conference (IEMCON) (IEEE), 0827–0833. doi:10.1109/iemcon53756.2021.9623086
Petinrin, M., and Petinrin, J. O. (2014). Renewable energy potentials in Nigeria: Meeting rural energy needs. Renew. Sustain. Energy Rev. 29, 72–84. doi:10.1016/j.rser.2013.08.078
Ramachandran, T., Mourad, A.-H. I., and Hamed, F. (). A review on solar energy utilization and projects: Development in and around the UAE. Energies 15 (10), 3754.
Saqib, S. (2018). “Hybrid steam supply system for saving fuel gas and reducing carbon footprint of the Oil & Gas Industry,” in Research and development petroleum conference and exhibition 2018 (Houten: European Association of Geoscientists & Engineers), 172–174.
Shah, N. (2018). ANALYSIS OF THE KEY FACTORS AFFECTING LEVELIZED COST OF ELECTRICITY OF SOLAR PV IN INDIA, 3, 7.
Shah, S. F. A., Khan, I. A., and Khan, H. A. (2019). Performance evaluation of two similar 100MW solar PV plants located in environmentally homogeneous conditions. IEEE Access 7, 161697–161707. doi:10.1109/access.2019.2951688
Srinivasan, S. (2019). Power relationships: Marginal cost pricing of electricity and social sustainability of renewable energy projects. Technol. Econ. Smart Grids Sustain Energy 4 (1). doi:10.1007/s40866-019-0070-4
Tian, K., Sun, W., Liu, W., and Song, H. (2020). Coordinated RES and ESS planning framework considering financial incentives under centralised electricity market. CSEE J. Power Energy Syst., 1–8.
U.S. Energy Information Administration (2022). Levelized costs of new generation resources in the annual energy outlook 2021, U.S. Energy information administration (EIA). [Online]. Available: https://www.eia.gov/outlooks/aeo/pdf/electricity_generation.pdf (Accessed March 26th, 2022).
Wang, M. -H., He, Y., Xu, Y., and Xu, Z. (2021b). A power-decoupled current-source inverter for PV energy harvest and grid voltage regulation. IEEE Trans. Ind. Electron. 68 (10), 9540–9549. doi:10.1109/tie.2020.3026264
Wang, M. -H., Li, S., He, Y., Jia, J., and Jia, Y. (2021a). Leakage current suppression of single-phase power-decoupled current-source inverters. IEEE J. Emerg. Sel. Top. Power Electron. 9 (6), 6846–6853. doi:10.1109/jestpe.2021.3085684
Wang, M., Mok, K., Tan, S., and Hui, S. Y. (2018). Multifunctional DC electric springs for improving voltage quality of DC grids. IEEE Trans. Smart Grid 9 (3), 2248–2258.
Wang, M., Tan, S., Hui, C., and Hui, S. Y. (2018). A configuration of storage system for DC microgrids. IEEE Trans. Power Electron. 33 (5), 3722–3733. doi:10.1109/tpel.2017.2723909
Woodhouse, M., James, T., Margolis, R., Feldman, D., Merkel, T., and Goodrich, A. (2011). “An economic analysis of photovoltaics versus traditional energy sources: Where are we now and where might we be in the near future?,” in 2011 37th IEEE Photovoltaic Specialists Conference (Seattle, WA, USA, 002481–002483.
Keywords: LCOE, marginal cost, capital cost, fixed cost, PV solar project, renewable energy
Citation: Alashqar M, Xue Y, Yang C and Zhang X-P (2022) Comprehensive economic analysis of PV farm -A case study of Alkarsaah PV farm in qatar. Front. Energy Res. 10:987773. doi: 10.3389/fenrg.2022.987773
Received: 06 July 2022; Accepted: 19 July 2022;
Published: 01 September 2022.
Edited by:
Minghao Wang, Hong Kong Polytechnic University, Hong Kong SAR, ChinaReviewed by:
Hao Fu, Central Southern China Electric Power Design Institute, ChinaCopyright © 2022 Alashqar, Xue, Yang and Zhang. This is an open-access article distributed under the terms of the Creative Commons Attribution License (CC BY). The use, distribution or reproduction in other forums is permitted, provided the original author(s) and the copyright owner(s) are credited and that the original publication in this journal is cited, in accordance with accepted academic practice. No use, distribution or reproduction is permitted which does not comply with these terms.
*Correspondence: Conghuan Yang, Y29uZ2h1YW55YW5nQGZveG1haWwuY29t
Disclaimer: All claims expressed in this article are solely those of the authors and do not necessarily represent those of their affiliated organizations, or those of the publisher, the editors and the reviewers. Any product that may be evaluated in this article or claim that may be made by its manufacturer is not guaranteed or endorsed by the publisher.
Research integrity at Frontiers
Learn more about the work of our research integrity team to safeguard the quality of each article we publish.