
94% of researchers rate our articles as excellent or good
Learn more about the work of our research integrity team to safeguard the quality of each article we publish.
Find out more
BRIEF RESEARCH REPORT article
Front. Energy Res., 09 January 2023
Sec. Advanced Clean Fuel Technologies
Volume 10 - 2022 | https://doi.org/10.3389/fenrg.2022.987098
This article is part of the Research TopicAdvanced Methods of Mathematical Modeling and Experimental Study in Oil and Gas ReservoirsView all 15 articles
 Huzhen Wang1,2*
 Tiancheng Liu1Zhuangzhuang Sun1Chunyao Wang1,3*Yangang Zhang3Yulin Chen3Zhenyu Liu1,2Zhijun Zhou1,2
In ultralow permeability tight oil reservoirs, the fracturing scale of multistage fractured horizontal wells (MFHWs) is relatively large, and the artificial fracture system is generally more complex. Analytical and semi-analytical methods are difficult to characterize the stimulated area in detail, which includes main fractures, branch fractures, and microfractures. Numerical methods have unique advantages in studying such problems. The mathematical model of oil–water two-phase seepage is established by the finite element method, the permeability and pseudo threshold pressure gradient that vary with spatial position are proposed to characterize the stimulated area except the main fracture. A single well numerical model was established to study the influence of the width and permeability of the stimulated area on the pressure response. The analysis shows that the transient pressure response of MFHW is controlled by main fracture conductivity. Main fractures have high conductivity can better communicate the stimulated area, and MFHW can be better developed.
In recent years, the application of horizontal well volume fracturing technology has made important breakthroughs in the development of unconventional oil and gas reservoirs. Core flooding studies show that low-velocity non-Darcy flow exists in tight reservoir development. It is generally believed that non-Darcy flow has three flow states: no flow part, non-linear flow part, and linear flow part. The no flow part is when the pressure gradient is less than the threshold pressure gradient (TPG), the fluid does not flow. The flow rate under low-pressure gradient is very small, and it is difficult to measure directly. Many scholars believe that TPG does not exist, and the non-linear flow part should start from zero pressure gradient (wang et al., 2017). The intersection point of the linear flow section extension with the X-axis (pressure gradient) at high pressure gradients is called the pseudo threshold pressure gradient (PTPG). PTPG is easy to obtain, and the processing in the mathematical model is relatively simple. The non-Darcy flow is treated as two parts: no flow and linear flow. When detailed data on non-linear flow are not available, non-Darcy flow can be approximated by PTPG. Prada and Civan (1999) studied non-Darcy flow phenomena using salt water and analyzed the effect of permeability and fluid viscosity on PTPG. In practical application, it was found that the PTPG value estimated by the experiment was very large, and the same problem was found in similar experiments (Zeng et al., 2010).
After volume fracturing of horizontal wells, a large number of branch fractures and microfractures are formed. Regardless of the analytical method or the numerical method, the characterization of the main fracture and the stimulated area is an important work in well test analysis. The trilinear-flow model presented by Brown, the whole drainage area is decomposed into three contiguous flow regions: outer reservoir, inner reservoir, and hydraulic fractures (Brown et al., 2011). Stalgorova and Mattar (2012a) developed an enhanced fracture region model with a higher permeability region near each hydraulic fracture and unstimulated region in the bulk of the space between fractures . A more advanced five-region model that encompasses both the existing trilinear-flow model and previous enhanced fracture region model further represented (Stalgorova and Mattar, 2012b). Fuentes-Cruz presented an induced permeability field within SRV to improve the continuous assumption of linear-composite permeability model and extended to the dual porosity idealization model (Fuentes-Cruz et al., 2014a; Fuentes-Cruz et al., 2014b). Many scholars conventional multiple hydraulic fractured horizontal (MFH) well into a composite model to describe the stimulated reservoir volume (SRV). Simplify the SRV into a circle (Zhao et al., 2014; Hu et al., 2021), rectangular shape (Wang et al., 2016; Li et al., 2021), irregular shape (Chen et al., 2018, 2021; Zhang and Yang, 2021), and ellipse shape (Wang and Sheng, 2017). Some scholars use embedded discrete fracture model (EDFM) (Xu et al., 2017; He et al., 2022) and discrete fracture model (DFM) (Liu et al., 2020) to treat MFHW, considering the complexity of fractures and not considering the stimulated area near the fractures.
In summary, ultralow permeability tight oil reservoirs have large fracturing scale and complex artificial fractures. The analytical and semi-analytical methods generally do not consider the stimulated area, or consider stimulated area with a single permeability. The numerical methods generally divide the stimulated area into multiple areas, each area has different properties, and the characterization of stimulated area is not detailed enough. For this problem, the parameters of the stimulated area are characterized by using the formation permeability and the starting pressure gradient that change with the spatial position. The finite element numerical method was used to build the mathematical model.
Basic assumption: there is oil–water two-phase fluid in homogeneous anisotropic reservoir, and both fluid and rock are weakly compressible, ignoring the influence of gravity. Several vertical fractures are fractured along the horizontal well pressure, and the fractures run through the entire reservoir.
The two-dimensional oil-phase pressure differential equation of the matrix system considering the threshold pressure gradient is:
where
The water-phase saturation equation (ρw treated as constant):
A mixed element discrete fracture model is used to characterize artificial fractures, ignoring the flow in the fracture perpendicular to the direction of the fracture, and the flow in the fracture is simplified to one dimension, which is described by line elements. The effect of threshold pressure gradient is not considered in the fracture. Then the equations of oil-phase pressure and water-phase saturation in the artificial fracture system are:
Assuming that the fracturing horizontal well only has production at the fracture, and the sum of the production of all fractures is equal to the production of the horizontal well, the intersection of the artificial fracture and the horizontal well is treated as the inner boundary.
When considering the effects of wellbore storage coefficient and skin factor, the pressure at the inner boundary node is taken as the wellface pressure pwb. According to the definition of the skin coefficient, when the wellbore friction is not considered, the pressure at each inner boundary node is equal to the bottom hole flowing pressure pwf, and the additional pressure drop ΔpS caused by the skin effect should also be equal at each inner boundary node. The relationship between bottom hole flowing pressure pwf and wellface pressure pwb, sand face flow rate qb:
According to the definition of the wellbore storage coefficient, the relationship between the sand face flow rate qb and the well flow rate q at the node is obtained:
In Eq. 5, let
The aforementioned formula is the bottom hole production expression of the inner boundary node, considering the influence of well storage coefficient and skin factor.
Equation 1 applies the principle of virtual displacement (δp is the virtual displacement of pressure) to obtain the equivalent integral form:
Partial integration at the left end of the aforementioned formula can obtain:
where
The fixed production of a horizontal well, the integral along the bottom hole boundary
In the same way, the weak solution integral form of the water-phase saturation equation can be obtained:
The total seepage velocity vt in the aforementioned formula is treated explicitly.
The weak solution integral form of the fracture system can be obtained, which will not be repeated here.
The oil-phase pressure equation and the water-phase saturation equation were solved by implicit pressure and explicit water saturation. The time was discretized by the Crank–Nicolson scheme. The linear equations were solved by the direct method of LDLT decomposition. Both the water cut and the pressure gradient were solved using the least squares method.
The tight oil reservoir of Lucaogou Formation in Jimusar Sag of Changji Oilfield has an average porosity of 9.17%, an average permeability of 0.15 × 10⁻³μm2, and more than 70% permeability of the cores is less than 0.1 × 10⁻³μm2. The reservoir has the characteristics of low porosity and ultralow permeability. The basic parameters of reservoirs, wells, and fractures are shown in Table 1.
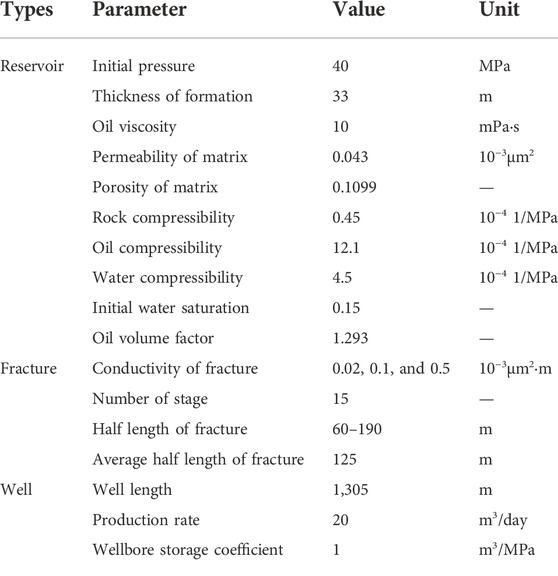
TABLE 1. Basic parameters of the reservoir, well, and fracture.
Characteristics of relative permeability curve: irreducible water saturation 0.15, residual oil saturation 0.422, and relative permeability of water-phase at residual oil saturation is 0.272.
Take a MFHW in a homogeneous tight oil reservoir, the outer boundary is closed. The single well numerical model is established as shown in Figure 1A. The size of the simulation area is 1500 m × 600 m. The matrix is meshed with arbitrary triangular elements, and the fractures are meshed with 2-node line elements. The mesh size of the fracture line element is 1 m, the maximum mesh size of the matrix is about 25 m, the total number of nodes is 25011, and total number of triangular elements is 49740.
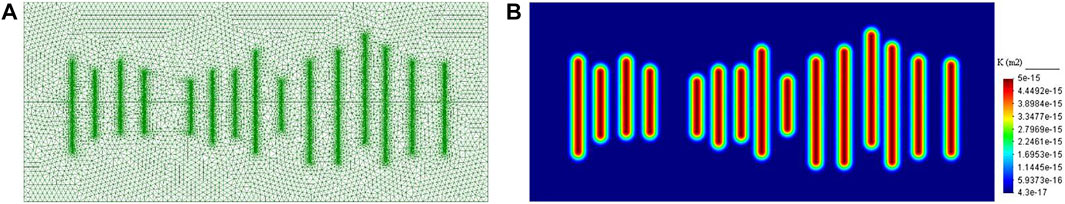
FIGURE 1. Numerical model and permeability distribution in the stimulated area. (A) Grid of the numerical model; (B) Permeability distribution in the stimulated area.
It is assumed that the position in the formation with the same vertical distance from the fracture surface has the same stimulation effect, and the smaller is the distance from the fracture surface, the better is the stimulation effect. Two parameters can be used to characterize the stimulated area: the width and permeability. The maximum permeability of the stimulated area is at the fracture surface and assuming an exponential change in the direction perpendicular to the fracture surface, the following formula is used:
In addition, due to the improvement of formation permeability in the stimulated area, the fluid PTPG should also be reduced, and it can be reset according to permeability. The width of the stimulated area is 40 m, the matrix permeability at the fracture surface is 5 × 10⁻³μm2, and PTPG is calculated according to the empirical formula G = 0.0828K−0.66, which are obtained from laboratory experiments. The permeability distribution of the stimulated area is shown in Figure 1B. The permeability ranges from 0.043 × 10⁻³ to 5 × 10⁻³ μm2, and PTPG ranges from 0.6606 to 0.0286 MPa/m. The method established in this article has the advantage of being able to characterize the stimulated area parameters in detail, the disadvantage is that the unstructured grid is used, the number of grids and computational workload are large, so only a two-dimensional model can be used for numerical calculation.
The stimulated area width Wgz designs four cases: 10 , 20 , 30 , and 40 m, and fracture conductivity KW designs three cases: 0.5 , 0.1 , and 0.02 μm2m. The permeability of the fracture surface is set to 1.0 × 10⁻³µm2. The pressure transient response curves of the four stimulated area width cases are shown in Figures 2A–C. The smaller the width of the stimulated area, the more obvious the upturning feature of the curve. The larger the width of the stimulated area, the more obvious the linear flow characteristics of the fracture. The lower the fracture conductivity, the smaller the influence of the width of the stimulated area on the pressure response curve, and the more obvious the bilinear flow characteristics. The higher the fracture conductivity, the smaller the distance between the pressure curve and the derivative curve, and the more obvious the linear flow characteristics. The width of stimulated area is 40 m, and the pressure distributions (10000 h) of the three fracture conductivity schemes are shown in Figures 2D–F. It can be seen from the comparison that the higher is the fracture conductivity (Figure 2D), the larger is the range of the low-pressure area, the effect of stimulated area is stronger, and the low-pressure area near the fracture is distributed along the fracture. The lower the fracture conductivity (Figure 2F), the effect of the stimulated area is weaker, and the low-pressure area is mainly near the bottom hole. Combining the pressure response curve and the pressure distribution map, it can be seen that the higher is the fracture conductivity, the higher is the bottom-hole flow pressure, the earlier the linear flow appears in the pressure response curve, and the low-pressure area distribute along the fracture and has a larger range.
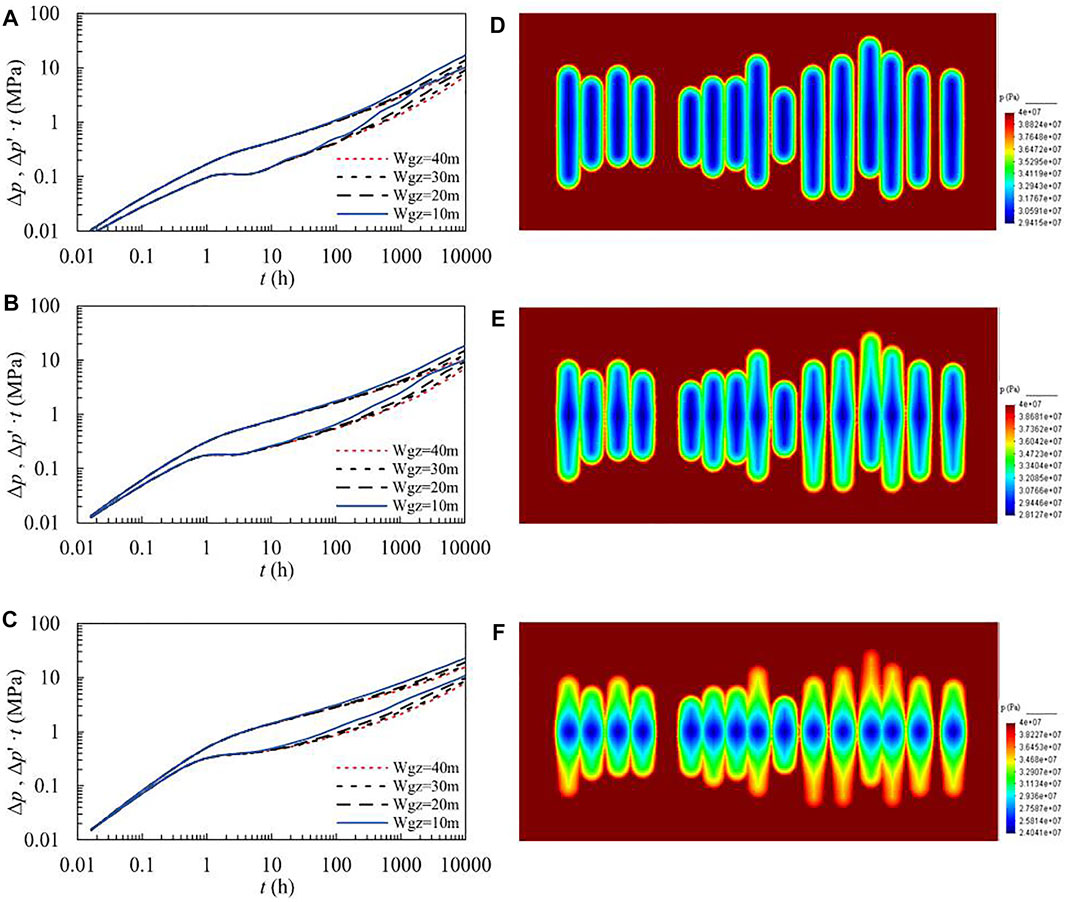
FIGURE 2. Log–log plot under different Wgz conditions and formation pressure distribution. (A) Kw = 0.5 μm2m; (B) Kw = 0.1 μm2m; (C) Kw = 0.02 μm2m; (D) Wgz = 40 m (Kw = 0.5 μm2m); (E) Wgz = 40 m (Kw = 0.1 μm2m); and (F) Wgz = 40 m (Kw = 0.02 μm2m).
The permeability at fracture surface Kgz designs three cases: 1.0 × 10⁻³, 5 × 10⁻³, and 10 × 10−3 μm2, and fracture conductivity Kw designs three cases: 0.5 , 0.1 , and 0.02 μm2m. The pressure transient response curves of the three stimulated area permeability cases are shown in Figures 3A–C. The effect of stimulated area permeability on the pressure response curve is mainly in the mid-term. The greater the stimulated area permeability, the stronger the supply capacity to fractures, and the derivative curve tends to be flat. From the comparison of different fracture conductivities, the lower is the conductivity, the less obvious is the effect of the stimulated area width. This is because the fracture conductivity is very low, and the effect of the stimulated area cannot be fully exerted (Figures 3D–F).
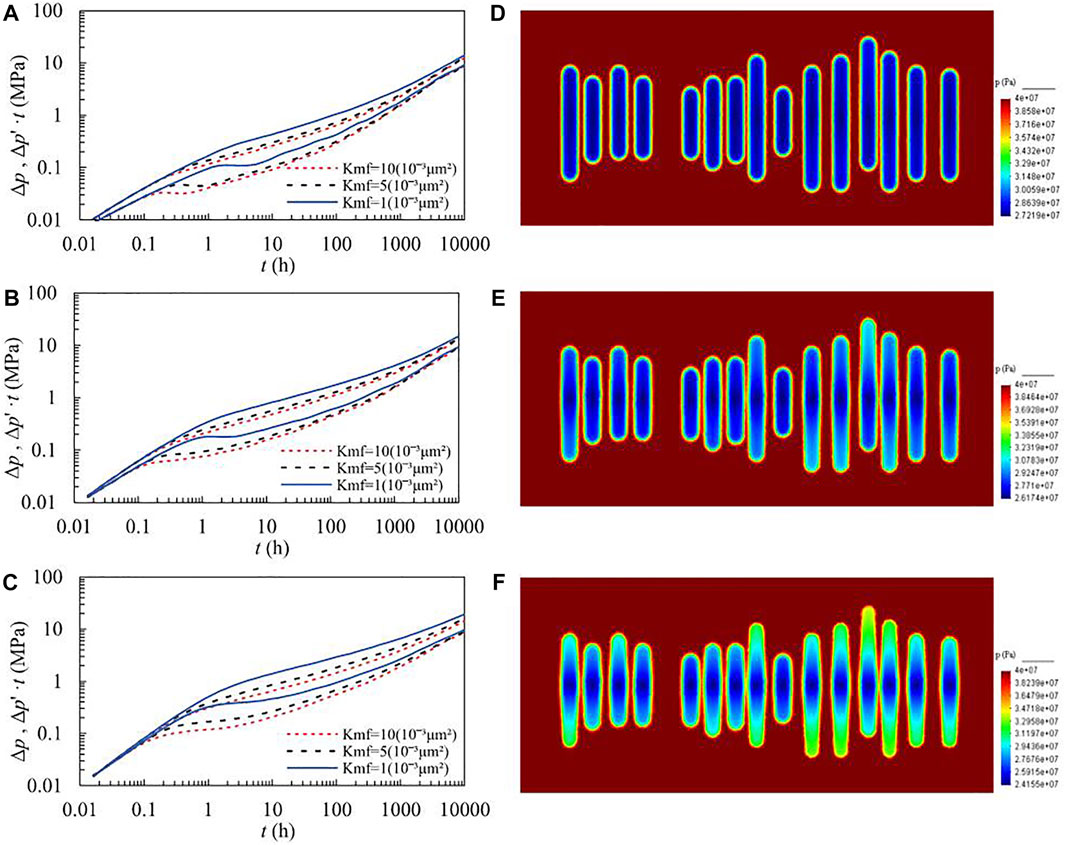
FIGURE 3. Log–log plot under different Kmf conditions and formation pressure distribution. (A) Kw = 0.5 μm2m; (B) Kw = 0.1 μm2m; (C) Kw = 0.02 μm2m; (D) Kmf = 5 × 10⁻³µm2(Kw = 0.5 μm2m); (E) Kmf = 5 × 10⁻³µm2(Kw = 0.1 μm2m); and (F) Kmf = 5 × 10⁻³µm2(Kw = 0.02 μm2m).
Applying the basic principle of finite element, according to the characteristics of tight oil reservoirs, a mathematical model of oil–water two-phase numerical well test is established considering the PTPG. Benefiting from the flexibility of finite element meshing, the DFM is used to describe artificial fractures for MFHW, which can achieve a reasonable characterization of the artificial fracture system.
A characterization method of stimulated area parameters changing with the spatial location is established. The stimulated area parameters of MFHW are described by the width, the permeability, and the PTPG that vary with the spatial position in the stimulated area. Based on the relationship between permeability and PTPG, an innovative detailed characterization of stimulated area can be achieved.
Both the width and the permeability of stimulated area have a great influence on the pressure response of the fracturing horizontal well, but their influence is controlled by the fracture conductivity. Very low fracture conductivity makes it difficult to obtain a good development effect even if there is a large stimulated area. Therefore, when fracturing, it is necessary to obtain a large SRV, more important thing is to ensure that the fractures have high conductivity, so as to achieve better development results.
The original contributions presented in the study are included in the article/Supplementary Material; further inquiries can be directed to the corresponding authors.
HW, ZL, and ZZ contributed to conception and design of the study. ZS and YC organized the database. HW, TL, ZS, YC, and YZ performed the numeral calculations and statistical analysis. HW, TL, ZS, and YZ wrote sections of the manuscript. All authors contributed to manuscript revision, read, and approved the submitted version.
This work is supported by the Daqing guiding science and technology plan project (No. zd-2021-51).
Authors HW, ZL, and ZZ were employed by Northeast Petroleum University. Authors CW, YZ, and YC were employed by the company Daqing Oilfield Co., Ltd.
The remaining authors declare that the research was conducted in the absence of any commercial or financial relationships that could be construed as a potential conflict of interest.
All claims expressed in this article are solely those of the authors and do not necessarily represent those of their affiliated organizations, or those of the publisher, the editors, and the reviewers. Any product that may be evaluated in this article, or claim that may be made by its manufacturer, is not guaranteed or endorsed by the publisher.
The Supplementary Material for this article can be found online at: https://www.frontiersin.org/articles/10.3389/fenrg.2022.987098/full#supplementary-material
Brown, M., Ozkan, E., Raghavan, R., and Kazemi, H. (2011). Practical solutions for pressure-transient responses of fractured horizontal wells in unconventional shale reservoirs. SPE Reserv. Eval. Eng. 14 (06), 663–676. doi:10.2118/125043-PA
Chen, P., Hu, C., Zou, P., Lin, L., Lu, S., and Gao, X. (2021). Pressure response of a horizontal well in tight oil reservoirs with stimulated reservoir volume. Lithosphere 2021 (1), 5383603. doi:10.2113/2021/5383603
Chen, P., Jiang, S., Chen, Y., and Zhang, K. (2018). Pressure response and production performance of volumetric fracturing horizontal well in shale gas reservoir based on boundary element method. Eng. Analysis Bound. Elem. 87, 66–77. doi:10.1016/j.enganabound.2017.11.013
Fuentes-Cruz, G., Gildin, E., and Valkó, P. P. (2014a). Analyzing production data from hydraulically fractured wells: The concept of induced permeability field. SPE Reserv. Eval. Eng. 17 (02), 220–232. doi:10.2118/163843-pa
Fuentes-Cruz, G., Gildin, E., and Valkó, P. P. (2014b). “On the analysis of production data: Practical approaches for hydraulically fractured wells in unconventional reservoirs,” in SPE hydraulic fracturing technology conference. doi:10.2118/168608-MS
He, Y., Xu, Y., Tang, Y., Qiao, Y., Yu, W., and Sepehrnoori, K. (2022). Multi-phase rate transient behaviors of the multi-fractured horizontal well with complex fracture networks. J. Energy Resour. Technol. 144 (4), 043006. doi:10.1115/1.4053247
Hu, Y., Zhang, X., Cheng, Z., Ding, W., Qu, L., Su, P., et al. (2021). A novel radial-composite model of pressure transient analysis for multistage fracturing horizontal wells with stimulated reservoir volume. Geofluids 2021, 1–14. doi:10.1155/2021/6685820
Li, Z., Wu, X., Han, G., Zhang, L., Zhao, R., and Shi, S. (2021). A semi-analytical pressure model of horizontal well with complex networks in heterogeneous reservoirs. J. Petroleum Sci. Eng. 202, 108511. doi:10.1016/j.petrol.2021.108511
Liu, H., Zhao, X., Tang, X., Peng, B., Zou, J., and Zhang, X. (2020). A Discrete fracture–matrix model for pressure transient analysis in multistage fractured horizontal wells with discretely distributed natural fractures. J. Petroleum Sci. Eng. 192, 107275. doi:10.1016/j.petrol.2020.107275
Prada, A., and Civan, F. (1999). Modification of Darcy's law for the threshold pressure gradient. J. Petroleum Sci. Eng. 22 (4), 237–240. doi:10.1016/s0920-4105(98)00083-7
Stalgorova, E., and Mattar, L. (2012a). "Practical analytical model to simulate production of horizontal wells with branch fractures," in Paper presented at the SPE Canadian unconventional resources conference, October 30-November 1, 2012. Paper Number: SPE-162515-MS. (Society of Petroleum Engineers (SPE)). doi:10.2118/162515-MS
Stalgorova, E., and Mattar, L. (2012b). Analytical model for unconventional multifractured composite systems. SPE 162516, 246–256. doi:10.2118/162516-PA
Wang, J., Jia, A., and Wei, Y. (2016). A semi-analytical solution for multiple-trilinear-flow model with asymmetry configuration in multifractured horizontal well. J. Nat. Gas Sci. Eng. 30, 515–530. doi:10.1016/j.jngse.2015.12.013
Wang, X., and Sheng, J. J. (2017). Effect of low-velocity non-Darcy flow on well production performance in shale and tight oil reservoirs. Fuel 190, 41–46. doi:10.1016/j.fuel.2016.11.040
Xu, Y., Cavalcante Filho, J. S., Yu, W., and Sepehrnoori, K. (2017). Discrete-fracture modeling of complex hydraulic-fracture geometries in reservoir simulators. SPE Reserv. Eval. Eng. 20 (02), 403–422. doi:10.2118/183647-PA
Zeng, B., Cheng, L., and Hao, F. (2010). "Experiment and mechanism analysis on threshold pressure gradient with different fluids," in Paper presented at the Nigeria annual international conference and exhibition, July 31-August 7, 2010. Paper Number: SPE-140678-MS. (Society of Petroleum Engineers (SPE)). doi:10.2118/140678-MS
Zhang, Y., and Yang, D. (2021). Modeling transient pressure behaviour of a multi-fractured horizontal well in a reservoir with an arbitrary boundary and different fracture networks by considering stress-sensitive effect. J. Hydrology 600, 126552. doi:10.1016/j.jhydrol.2021.126552
Zhao, Y. L., Zhang, L. H., Luo, J. X., and Zhang, B. N. (2014). Performance of fractured horizontal well with stimulated reservoir volume in unconventional gas reservoir. J. Hydrology 512, 447–456. doi:10.1016/j.jhydrol.2014.03.026
ϕ = porosity, fraction
So = oil saturation, fraction
Sw = water saturation, fraction
t = time, day
K = permeability, 10−3μm2
Kgz = permeability of stimulated area, 10−3μm2
Kmf = permeability of fracture surface, 10−3μm2
Kro = oil-phase relative permeability, fraction
Krw = water-phase relative permeability, fraction
μo = oil-phase viscosity, mPa·s
μw = water-phase viscosity, mPa·s
po = oil-phase pressure, MPa
pc = capillary pressure, MPa
pwb = wellface pressure, MPa
pwf = bottom hole flowing pressure, MPa
∆pS = additional pressure drop, MPa
qb = sand face flow rate, m3/day
q = well flow rate, m3/day
h = reservoir thickness, m
C = wellbore storage coefficient, m3/MPa
S = skin factor
B = volume factor
G = threshold pressure gradient, MPa/m
Ct = comprehensive compressibility, 10−4 1/MPa
Cf = rock compressibility, 10−4 1/MPa
Co = oil-phase compressibility, 10−4 1/MPa
Cw = water-phase compressibility, 10−4 1/MPa
λ = oil–water two-phase fluidity
λo = oil-phase relative fluidity
λw = water-phase relative fluidity
vt = total seepage velocity, m/s
A = seepage area, m2
∂ = differential operator
V = domain
Г = boundary
∇ = Hamiltonian operator
fo = oil-phase of fracture system
fw = water-phase of fracture system
fc = fracture capillary pressure
‘ = derivative
n = previous time step
Keywords: numerical well test, pressure transient analysis, multistage fractured horizontal wells, stimulated area, finite element method
Citation: Wang H, Liu T, Sun Z, Wang C, Zhang Y, Chen Y, Liu Z and Zhou Z (2023) Pressure transient analysis of multistage fractured horizontal wells based on detailed characterization of stimulated area. Front. Energy Res. 10:987098. doi: 10.3389/fenrg.2022.987098
Received: 05 July 2022; Accepted: 08 August 2022;
Published: 09 January 2023.
Edited by:
Xiukun Wang, China University of Petroleum, Beijing, ChinaReviewed by:
Xiangwen Kong, Research Institute of Petroleum Exploration and Development (RIPED), ChinaCopyright © 2023 Wang, Liu, Sun, Wang, Zhang, Chen, Liu and Zhou. This is an open-access article distributed under the terms of the Creative Commons Attribution License (CC BY). The use, distribution or reproduction in other forums is permitted, provided the original author(s) and the copyright owner(s) are credited and that the original publication in this journal is cited, in accordance with accepted academic practice. No use, distribution or reproduction is permitted which does not comply with these terms.
*Correspondence: Huzhen Wang, d2FuZ2h1emhlbkBuZXB1LmVkdS5jbg==; Chunyao Wang, d2N5MTM3MDQ2N0AxNjMuY29t
Disclaimer: All claims expressed in this article are solely those of the authors and do not necessarily represent those of their affiliated organizations, or those of the publisher, the editors and the reviewers. Any product that may be evaluated in this article or claim that may be made by its manufacturer is not guaranteed or endorsed by the publisher.
Research integrity at Frontiers
Learn more about the work of our research integrity team to safeguard the quality of each article we publish.