 Yang Liu1*
 Jiawei Meng1
 Xiaofang Lv1,2*
 Qianli Ma1Bohui Shi3,4Chuanshuo Wang1Huirong Huang5Chengxuan Wu1Shidong Zhou1
 Shangfei Song3
- 1Jiangsu Key Laboratory of Oil and Gas Storage and Transportation Technology, Changzhou University, Changzhou, Jiangsu, China
- 2Institute of Petroleum Engineering Technology, Sinopec Northwest Oil Field Company, Urumqi, Xinjiang, China
- 3State Key Laboratory of Natural Gas Hydrates/ National Engineering Laboratory for Pipeline Safety/ MOE Key Laboratory of Petroleum Engineering/ Beijing Key Laboratory of Urban Oil and Gas Distribution Technology, China University of Petroleum-Beijing, Beijing, China
- 4Shenzhen Kaifa Technology (Chengdu) Co., Ltd., Chengdu, Sichuan, China
- 5School of Petroleum Engineering, Chongqing University of Science and Technology, Chongqing, China
The coexistence of wax and hydrates will pose intractable challenges to the safety of offshore oil and gas production and transportation, especially for deep sea or ultra-deep sea reservoirs. Understanding the effect of wax crystals on hydrate formation, flow properties, and plugging risks of flow systems is imperative to the flow assurance industry. Experiments using systems composed of natural gas, water-in-oil emulsion with different wax contents, and AA (anti-agglomerant) were conducted in a high-pressure flow loop. For wax-containing systems, wax precipitates out during the induction period of hydrate formation. The induction time of hydrate formation decreased with the increasing wax content under the experimental conditions in this work. It was also found that the induction time for both wax-free and wax-containing systems increased with the increasing flow rate. The hydrate growth rate and the cumulative gas consumption were significantly reduced due to the existence of wax. Although the hydrate volume fraction of wax-containing systems was much smaller than that of wax-free systems, a stable slurry flow state could not be reached for wax-containing systems, the pressure drop of which gradually increased with the decreasing flow rates. The coexistence of wax and hydrates results in the deterioration of transportability and higher plugging risks. Based on the Darcy–Weisbach hydraulic formula, a dimensionless parameter was defined to characterize the plugging risk of flow systems with the coexistence of wax and hydrates. Additionally, regions with different levels of plugging risks could be evaluated and divided.
1 Introduction
With the growing demand for the cleanest fossil fuel, natural gas, and the gradual depletion of onshore gas resources, oil and gas exploitation is moving towards offshore reservoirs, especially deep sea and ultra-deep sea areas (Hassanpouryouzband et al., 2021). Wellbores and subsea multiphase transmission lines are prone to being affected by solid depositions or so-called flow assurance issues, such as hydrates, wax, asphaltenes, scales and so on (Daraboina et al., 2015; Farhadian et al., 2020; Mohammed et al., 2021), due to the complicated composition of fluids and the severe subsea environment of low temperature (typically 2∼4°C) and high pressure (typically >1000 psi) (Sloan and Koh, 2007; Sloan et al., 2010). Without proper management, these depositions or issues may lead to a reduction in production efficiency and even complete blockage of pipelines, threatening production safety and leading to both environmental disruption and economic losses (Sun et al., 2021; Zhang et al., 2022).
In real subsea pipelines, the transported products generally consist of water, light hydrocarbons, crude oil containing paraffin, resins, asphaltenes, etc., as well as other solids, such as sands, scales, and so on (Daraboina et al., 2015). On one hand, hydrates are ice-like crystalline compounds formed by gas molecules (including methane, ethane, propane, and so on) and water molecules under certain thermodynamic conditions, which take the shortest time from formation to provoking pipeline plugging (Hassanpouryouzband et al., 2020). Hydrate formation is regarded as the most important issue among flow assurance problems (Song et al., 2017; Aman, 2021; Chen et al., 2022). On the other hand, the complicated composition of products provides sufficient conditions for the coexistence of multiple flow assurance issues (Gao, 2008; Liu et al., 2019). As wax is particularly prevalent in crude oil, it has been found that the coexistence of wax and hydrates will greatly heighten the plugging risk of subsea pipelines (Oliveira et al., 2012; Liu et al., 2018). Therefore, it is of vital significance to investigate the effect of wax on hydrate formation characteristics and the flow properties of waxy hydrate slurries.
In water-in-oil (w/o) emulsion systems, wax would be adsorbed at oil-water interfaces, and both hydrate formation and agglomeration are interfacial phenomenon (Ma et al., 2017; Song et al., 2021). In recent years, some research has reported that wax would impact on hydrate nucleation and the corresponding induction time (Oliveira et al., 2012; Raman and Aichele, 2017; Zheng et al., 2017; Chen et al., 2021), hydrate growth (Shi et al., 2018; Zhang et al., 2021; Liu J. et al., 2022), particle agglomeration (Brown et al., 2020; Wang et al., 2020; Liu Y. et al., 2022), and slurry viscosity (Liu et al., 2018; Chen et al., 2019; Liu et al., 2021). However, consensus has not been achieved yet. As for hydrate nucleation, some researchers argued that wax crystals could provide the heterogeneous nucleation sites for hydrate formation and facilitate hydrate nucleation (Gao 2008; Raman and Aichele, 2017), while some held the opinion that wax hindered hydrate formation due to its interfacial adsorption (Zheng et al., 2017; Liu et al., 2018). As for hydrate growth, some researchers found that wax promotes the initial hydrate growth rate for their flow systems with 1 wt% wax content and a similar subcooling degree compared to wax-free systems (Liu et al., 2019), while others suggested that the precipitated wax crystals reduce the hydrate growth rate in autoclave systems with different wax contents (Shi et al., 2018; Chen et al., 2019; Liu J. et al., 2022). Consequently, the effect of wax on the amount of hydrate formation was also not well understood. The above divergence might result from the difference in experimental devices (e.g., flow loop versus autoclaves/rheometers) and fluids (e.g., crude oil versus model oil), which led to the variation in time sequence of wax precipitation and hydrate formation (Liu J. et al., 2022). Recently, Liao et al. (2021) showed that methane hydrate growth was promoted in the presence of ten C17 n-alkane wax molecules through molecular dynamics (MD) simulations. Based on the analysis of microscopic images of hydrate growth at the oil-water interface, Brown et al. (2020) found that wax could form a film around the hydrate particle, leading to the alteration in cohesive force between waxy hydrate particles; Song et al. (2021) found that the morphology of the formed hydrate shells varied with wax content; Guo et al. (2021) suggested that hydrate shell growth rate was influenced by wax crystals in terms of mass/heat transfer resistance or heterogeneous nucleation sites. The above information could provide evidence for the conjecture that the influence of wax on hydrate formation in w/o emulsions was achieved from microscopic interfacial aspects. However, among these studies, there is limited literature associated with the flow properties and the pipeline plugging characteristics of waxy hydrate slurries (Liu et al., 2018), especially with different wax contents.
As for the mitigation strategies to handle pipeline plugging due to the coexistence of wax and hydrates, methods that have been developed to prevent hydrate plugging, including the traditional thermodynamic method and the risk management strategy (Sloan et al., 2010; Hassanpouryouzband et al., 2020; Aman, 2021; Zhang et al., 2022), could provide significant insights. The traditional thermodynamic method focuses on the complete avoidance of hydrate formation where heating, insulation, or injection of thermodynamic hydrate inhibitors (THIs) is adopted (Sloan et al., 2010; Hassanpouryouzband et al., 2020; Shi et al., 2021). However, heating or insulation may not be cost-effective for most subsea scenarios. It requires large amounts of THIs for high water cut products, sometimes approaching 80 wt%. Besides, some categories of THIs are not environmentally friendly either. Considering the limitations of the above thermodynamic method, the latter method allows hydrate formation while manipulating the plugging risk to an acceptable level, and consequently is called a risk management strategy, which is thought to be promising and effective. This strategy is achieved through the addition of small quantities (typically 0.01∼3 wt%) of low dosage hydrates inhibitors (LDHIs), including kinetic hydrate inhibitors (KHIs) and anti-agglomerants (AAs) (Ke and Kelland, 2016; Hassanpouryouzband et al., 2020; Shi et al., 2021). KHIs can prolong the induction time of hydrate formation, inhibiting hydrate nucleation and/or growth and guaranteeing the oil and gas mixture products can be transported safely. AAs can weaken the agglomeration of hydrate particles, allowing the fluid to be transported in the form of hydrate slurry. In other words, hydrates suspend in the bulk phase as fine particles and are carried by the liquid phase after applying this strategy (Zhang et al., 2022). More details about the chemical-hydrate inhibition as well as the methods and facilities to screen better chemicals for hydrate-associated flow assurance challenges can be found in a recent review (Hassanpouryouzband et al., 2020).
In this work, with the assistance of a high-pressure flow loop, the effects of wax on hydrate nucleation, growth, and flow properties of waxy hydrate slurries were investigated using w/o emulsions with different wax contents under different flow rates. The induction time of flow systems was defined. The effect of wax content and flow rate on hydrate nucleation was analyzed. The hydrate growth characteristics in the presence and absence of wax were systematically compared, so as to understand the rate-limiting factors of hydrate growth. Wax-containing systems showed different flow properties and possessed higher plugging risks. The level of plugging risks was then clarified by a dimensionless parameter presented in this work. The findings of this work are meaningful to understanding the mechanism of wax on hydrate formation and provide guidance for the improvement of the hydrate risk management strategy.
2 Materials and methods
2.1 Materials
The materials used in the experiments include deionized water (resistivity of 18 MΩ cm), natural gas (see Table 1 for the composition), diesel oil, a type of paraffin mixture (wax solids with carbon numbers ranging from C28 to C41) and combined anti-agglomerant (AA). The composition of diesel can be found elsewhere (Liu et al., 2019). The combined AA is a mixture of Span 20 (C18H34O6) and ester polymers. Span 20 serves as the emulsifier, while the polymer works as an effective anti-agglomerate. Diesel dissolved with the paraffin mixture is used in this work so as to provide controllable wax content and to focus on the effects of wax on hydrate formation and agglomeration, considering the fact that there may be natural surface-active agents in the crude oil, such as asphaltenes and resins. AA is added to facilitate the emulsification of oil and water and examine whether the risk-management strategy is still applicable for wax-hydrate coexisting systems.

TABLE 1. Composition of natural gas.
2.2 Experimental apparatus
Hydrate formation and flow experiments were conducted in a high-pressure flow loop, the schematic diagram of which is shown in Figure 1. The main body of the loop is a 30 m long stainless-steel pipe with an internal diameter of 25.4 mm, which can sustain experimental pressure up to 150 bar. A separator with a volume of 220 L is selected to provide sufficient gas and liquid mixture space. Four water baths (JULABO GmbH, model FP51-SL) are used to adjust the system temperature at a range of −20 °C to 100°C with a temperature control error of ±0.05°C. A magnetic centrifugal pump (Dalian Sifang Motor-pump Co., Ltd., model SCG50-32-160/7.5) is used to provide a flow rate of up to 2200 kg/h (±1%) for the liquid phase. System temperature, pressure, pressure-drop, flow rate, and fluid density are acquired by the corresponding sensors distributed along the loop and logged by the data acquisition system (DASYLAB 8.0, sampling interval of 8 s). The model and error numbers of sensors can be found in Table 2. A Focused Beam Reflectance Measurement probe (FBRM, Mettler-Toledo Corporation, model D600X) and a Particle Video Measurement probe (PVM, Mettler-Toledo Corporation, model V819) are installed at the inlet of the flow loop, which can provide in-situ microscale information, such as particle size distribution or aggregate morphology. Details of the flow loop can be found in our previous work (Liu et al., 2019).
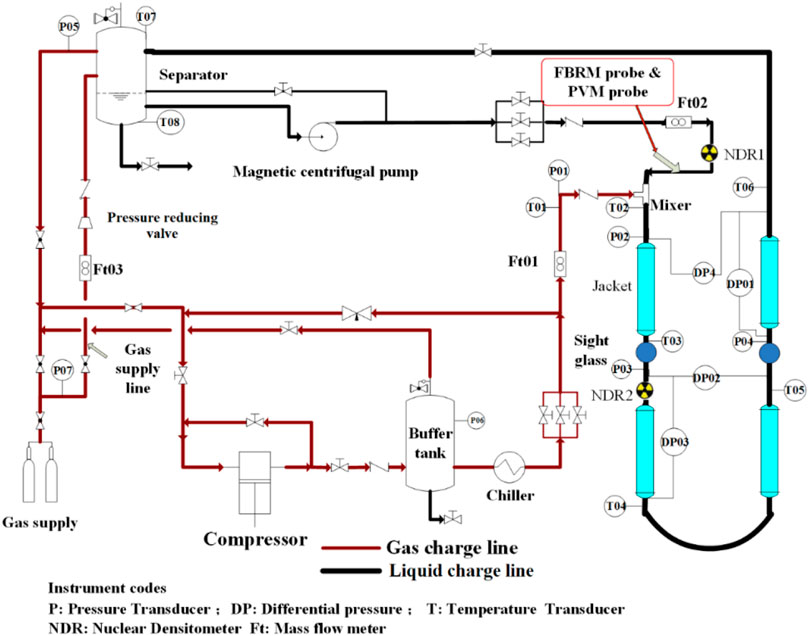
FIGURE 1. Schematic diagram of the high-pressure flow loop (Liu et al., 2018).
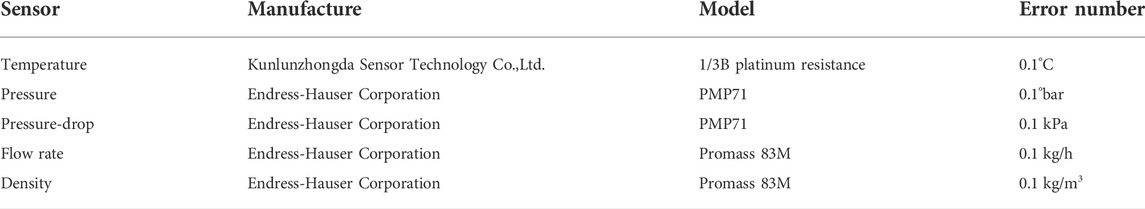
TABLE 2. Model and error numbers of temperature, pressure, pressure-drop, flow rate, and density sensors.
2.3 Methods and procedures
Water-in-oil systems composed of 80 vol% diesel oil and 20 vol% deionized water with 1.0 wt% AA were used to provide stable emulsions and perform the experiments. Three sets of wax contents (0, 0.75, and 1.25 wt%) and three initial flow rates (1120, 1400, and 1640 kg/h) were selected to conduct the experiments. Notably, the wax contents in this work were lower than those in common crude oils (typically 3 wt% or higher) to prevent severe wax deposition in our flow loop. Because hydrate formation in our flow system would be impossible when the wax deposition layer possessing an insulation effect was thick. The initial flow rates were chosen according to the industrial data (close to the typical velocity of 1 m/s) and the pump characteristics (corresponding to pump frequencies of 25, 30, and 35 Hz, respectively). Experiments without wax addition were carried out to be the comparative tests for the other experiments in the presence of wax. Specific experimental conditions are listed in Table 3. Wax content is defined as the weight fraction of wax to diesel under 20°C. The wax appearance temperature (WAT) of diesel with different wax contents was obtained via Differential Scanning Calorimetry (DSC), the results of which can be found in Appendix A1. As the degree of oil saturation increases with the increase in wax content, diesel with higher wax content exhibits higher WAT. Each of the experiments was performed twice or three times to provide confidence in the data reproducibility and reliability. A specific procedure for case 6 is described as follows:
1) The loop was evacuated to −1.0 bar using a vacuum pump to eliminate the influence of air.
2) 1.25 wt% wax was added into a stainless-steel oil container filled with 40 L diesel. And the container was then put into an electric heater at 80°C for 5 h.
3) 40 L heated diesel (with dissolved wax), 10 L deionized water and 100 g AA were loaded into the separator.
4) The magnetic centrifugal pump was started at a pump frequency of 30 Hz to provide a flow rate of 1400 kg/h with an error of ±1%. The water bath temperature (Tbath) was set to 20°C. The oil and water were circulated in the flow loop for no less than 24 h to achieve sufficient emulsification.
5) Natural gas from the gas cylinders was injected into the separator until a gauge pressure of 50 bar was reached (20°C).
6) Tbath was then set to 1°C to simulate the low temperature condition of subsea pipelines. The data acquisition system was started simultaneously.
7) After finishing the experiment, Tbath was set to 40°C for the dissociation of hydrates and wax.
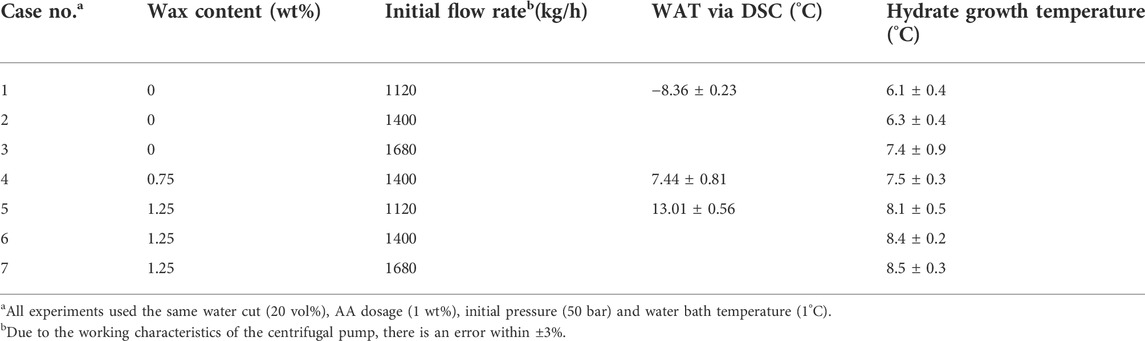
TABLE 3. Experimental conditions for hydrate formation and slurry flow in a flow-loop system.
2.4 Experimental data analysis
The amount of gas consumption in the flow-loop can be calculated based on the equation of state for the real gas, as expressed by Eq. 1, where pressure and temperature data are acquired by the sensors on the loop.
where ng is the moles of gas consumption, mol; P1 and P2 are the system pressure before and after hydrate formation, Pa; Vg is the gas volume in the separator, m3; z1 and z2 are the compressibility factors in the pressure of P1 and P2, and are calculated based on Peng-Robinson equation of state; R is the gas constant, J/(mol∙K); T1 and T2 are the system temperatures before and after hydrate formation, K.
Gas consumption rate dng/dt is calculated by an approximation method, as expressed as Eq. 2.
where t refers to time, s;
Based on the obtained gas consumption data, the hydrate volume fraction can then be expressed in Eq. 3 (Liu et al., 2018).
where φhyd is the hydrate volume fraction; Mg is the average molar mass of natural gas, kg/mol; Nhyd is the hydration number (for natural gas, Nhyd = 5.850); Mw is the molar mass of water, kg/mol; ρH and ρw are the densities of the hydrate and water respectively, kg∙m3; and VL is the volume of the liquid phase in the separator, m3.
Since the Darcy-Weisbach hydraulic formula (Eq. 4) is generally used to calculate the pressure drop, i.e., friction loss, of a flow system, it is also adopted to analyze the flow properties in this work.
where Δp is the pressure drop, Pa; ρ is the fluid density, kg∙m−3; g is gravitational acceleration, 9.8 m/s2; λ is the hydraulic friction coefficient, which is the function of Reynolds Number Re and relative roughness of the pipe; D is the flow diameter, m; L is the length of the pipeline, m; v is the velocity of the fluid, m/s.
3 Results and discussion
3.1 The effects of wax on hydrate nucleation and induction time
Figure 2 presents the traces of system temperature and pressure during the experimental process of case 6, including the hydrate formation phase and the subsequent slurry flow phase. Due to the function of water baths, temperature and pressure gradually decrease first. There is a sudden variation in both the temperature curve and the pressure curve at approximately 1.95 h due to the occurrence of hydrate growth that possesses an exothermic nature and consumes natural gas (Sloan et al., 2010). The system temperature at this time point is then defined as the hydrate growth temperature (HGT). As hydrate growth gradually ceases, the system temperature first reaches a small peak and then gradually stabilizes, and the system pressure also gradually stabilizes. Since it is difficult to directly describe the stochastic hydrate nucleation that occurs prior to hydrate growth, the hydrate induction time has been consistently used to investigate the nucleation kinetics (Sloan et al., 2010; Ke and Kelland, 2016; Zheng et al., 2017; Liu et al., 2019). The induction time of hydrate formation for flow systems can be defined as the time interval between the time point when the system temperature reaches hydrate equilibrium temperature (HET, see the green dashed curve in Figure 2) and the time point when the system temperature reaches HGT.
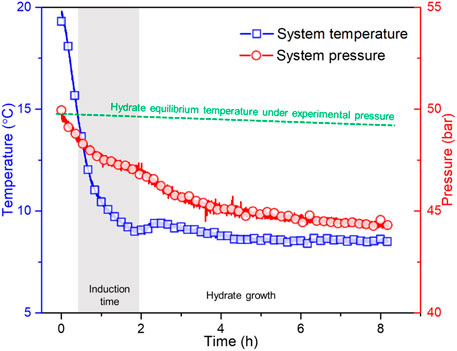
FIGURE 2. Variation trend of system temperature and pressure versus time during the experimental process of case 6. The hydrate equilibrium temperature under experimental pressure is calculated by the Chen-Guo model (Chen and Guo, 1998).
For the cases with 1.25 wt% wax content (cases 5∼7), since the wax appearance temperature (WAT) that is measured by the DSC (see Table 3) is significantly higher than HGT and lower than HET, the onset of wax deposition is subsequent to that of hydrate nucleation and prior to that of hydrate growth. In other words, wax deposition occurs during the hydrate induction period. Notably, although precipitation of wax crystals is also an exothermic phenomenon (Ji, 2004), wax deposition is a slow and continual physical process. Thus, the onset of wax deposition does not significantly affect the system temperature, while it significantly alters the flow properties of flow systems (see Section 3.3).
Based on the above definition, the induction times of wax-free systems (cases 1∼3) and 1.25 wt% wax content systems (cases 5∼7) under different initial flow rates are displayed in Figure 3A. As seen, under the same initial experimental conditions, the induction time of wax-containing systems is smaller than that of wax-free systems: the induction time of cases 5∼7 is 54.3%, 59.7%, and 74.4% of cases 1∼3 respectively, indicating the promoting effect of wax on hydrate nucleation. The reason could be ascribed to the emergence of large amount of heterogeneous nucleation sites for hydrate formation (Gao, 2008; Oliveira et al., 2012; Raman and Aichele, 2017) due to the precipitation of wax crystals. It is hypnotized that the function intensity of nucleation-rate-limiting factors, heterogeneous nucleation and mass-transfer, is different under different experimental conditions. The effect path of wax on hydrate nucleation is predominately determined by the time sequence of hydrate nucleation and wax precipitation since hydrate nucleation is a metastable process. When wax precipitation precedes hydrate nucleation (i.e., WAT > HET), the surface of water droplets where hydrate nucleation occurs is first adsorbed by wax crystals, which retards hydrate nucleation due to the increase in mass-transfer resistance (Liu et al., 2019). When hydrate nucleation precedes wax precipitation (i.e., WAT < HET), as there are some unstable hydrate nucleus at the oil-water interface, the introduction of wax crystals at these interfaces may promote the stability of the above hydrate nucleus, acting as the heterogeneous nucleation sites. Figure 3B illustrates that for cases with the same initial experimental conditions, the higher the wax content, the shorter the induction time. The induction time of case 2 (wax-free) is 148.63 ± 7.49 min, while that of case 4 (0.75 wt% wax content) and case 6 (1.25 wt% wax content) reduces to 72.7% and 59.7% of case 2, respectively. In other words, there are higher hydrate formation risks in flow systems with higher wax content under certain conditions, as there are larger amounts of wax crystals precipitating out. However, a higher wax content also produces a thicker wax deposition layer, possessing an insulation effect and consequently resulting in a longer cooling duration and a longer induction time. When the wax content of a flow system is high enough, this effect should not be ignored: hydrate may not form due to the insufficient subcooling degree.
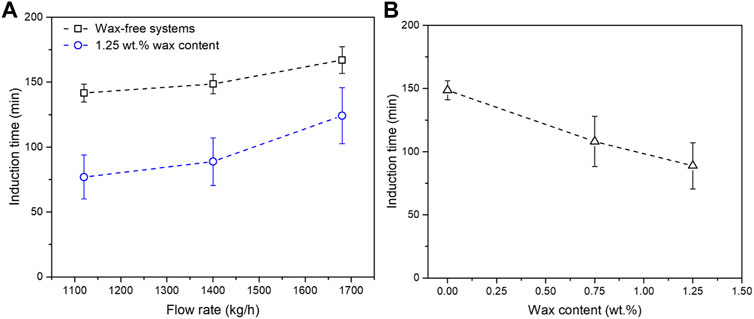
FIGURE 3. (A) Induction time of wax-free systems (cases 1∼3) and 1.25 wt% wax content systems (cases 5∼7) under different initial flow rates. Induction time is an averaged value of repeated experiments. The error bar refers to the standard deviation. (B) Induction times of different wax-content systems with the same experimental condition (cases 2, 4, and 6).
Figure 3A also depicts the effect of flow rate on hydrate induction time, i.e., hydrate nucleation. As seen, higher flow rates result in longer induction times: when the flow rate increases from 1120 kg/h (0.727 m/s) to 1680 kg/h (1.090 m/s), the induction time of wax-free systems rises from 141.6 ± 6.88 to 167 ± 10.28 min, an approximately 18% increase; and that of wax-containing systems rises from 76.9 ± 16.92 to 124.2 ± 21.53 min, an approximately 62% increase. It can be ascribable to the following fact: the efficiency of convective heat-transfer between the fluid and the coolant decreases with the increasing flow rate, leading to a longer duration before the system reaches its required subcooling degree of hydrate formation. For real subsea pipelines, a higher flow rate benefits the prevention of hydrate formation and is conducive to reducing blockage risks. On one hand, the introduction of wax crystals acting as heterogeneous nucleation sites promotes hydrate nucleation; on the other hand, the adsorbed wax crystals at oil-water interfaces (Liu et al., 2019; Liu J. et al., 2022) is suggested to enhance the mass-transfer resistance of gas diffusion, and consequently retarding hydrate nucleation. In this work, it is likely that this dual-effect of wax crystals functions simultaneously with different intensities: the effect of heterogeneous nucleation is stronger than that of mass-transfer resistance under conditions where wax precipitation occurs during the hydrate induction period. This conjecture can be supported by the variation trend of induction time versus flow rate: there might exist a high enough flow rate under which the induction time of wax-containing systems approaches that of wax-free systems. With the increase in flow rate, the amount of wax crystals suspended in the bulk phase becomes smaller due to the lower efficiency of convective heat-transfer; and the effect of mass-transfer resistance on hydrate nucleation is strengthened due to the decrease in the size of water droplets.
3.2 The effects of wax on hydrate growth
Figure 4 presents a series of gas consumption and gas consumption rate curves depicting the comparisons of hydrate growth kinetics between wax-free systems and 1.25 wt% wax content systems under the same initial flow rates. Here, relative time refers to the elapsed time after the onset of hydrate growth. As shown in Figure 4A–C, the gas consumption rate representing the hydrate growth rate in both cases gradually decreases with time and finally approaches zero. In w/o emulsion systems, the inward hydrate growth occurs at the hydrate-water interface, where guest molecules required by the continual inward growth are provided by gas diffusion from the outside; the outward hydrate growth occurs at the hydrate-oil interface, where the water molecules required by the continual outward growth are provided by water permeation from the inside; the heat generated due to the exothermic nature of hydrate formation would diffuse away into the water droplet and the bulk phase (Turner et al., 2009; Shi et al., 2011; Liang et al., 2021; Liang et al., 2022). In other words, mass transfer resistance provoked by water permeation and gas diffusion through the hydrate shell as well as heat-transfer resistance are the rate-limiting factors of hydrate growth (Liang et al., 2022). The mass- and heat-transfer resistance of the continual hydrate growth is relatively low at the initial stage when the hydrate shell that wraps the water droplets is thin. Then it increases as the hydrate shell becomes thicker. Additionally, hydrate particles are prone to collide with each other and form hydrate aggregates, which significantly decreases the amount of free water droplets and the effective surface area for hydrate formation (Liu et al., 2021). Hydrate agglomeration is likewise a rate-limiting factor for hydrate growth. Notably, another fundamental rate-limiting factor, i.e., intrinsic kinetics of hydrate growth is, presumably maintained unchanged when the variation in subcooling degree or over-pressure level is marginal. The above factors comprehensively result in the variation trend of gas consumption rate. Accordingly, the cumulative amount of gas consumption first increases quickly with time and then approaches a plateau.
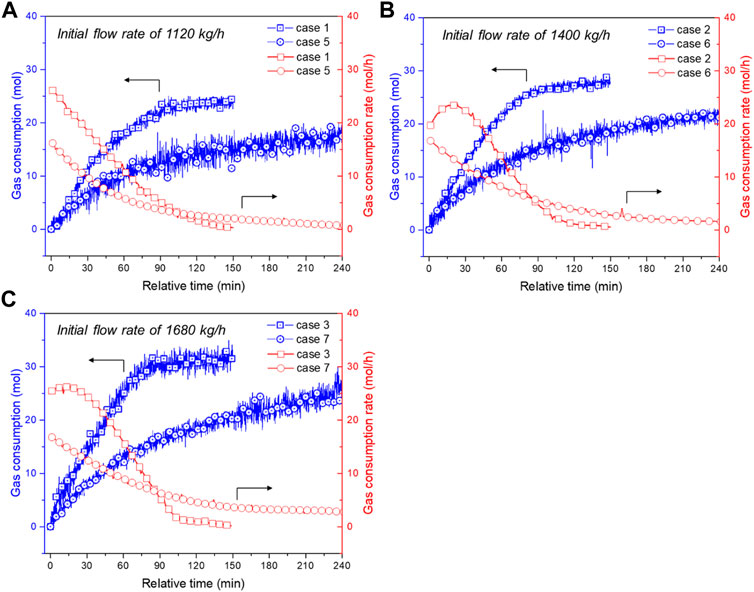
FIGURE 4. Comparisons of gas consumption and gas consumption rate of wax-free systems (cases 1∼3) and 1.25 wt% wax content systems (cases 5∼7) under initial flow rates of: (A) 1120 kg/h; (B) 1400 kg/h; and (C) 1680 kg/h. The other experimental conditions are the same.
Figure 4A–C also obviously displays that the gas consumption rate of wax-free systems is higher than that of wax-containing systems, and the total amount of gas consumption of wax-free systems is considerably higher than that of wax containing systems. Table 4 tabulated detailed comparisons of wax-free cases and their corresponding wax-containing cases at several time points: the ratio of the cumulative gas consumption of wax-containing cases to that of wax-free cases ranges from approximately 50%–70%, indicating the inhibiting effect of wax on hydrate growth. It can presumably be attributed to the following reasons: 1) the adsorbed wax crystals at oil-water interfaces boost the mass-transfer resistance for water permeation or gas diffusion through the hydrate shell; and 2) the existence of wax crystals results in the emergence of wax-hydrate coupling aggregates (Liu et al., 2018) that possess denser structure and larger size than normal hydrate aggregates, leading to smaller amount of unconverted free water droplets or effective surface area. However, these conjectures are difficult to be directly validated via the current experimental apparatus, while molecular dynamics simulation (Liao et al., 2021) and microscopic investigation (Song et al., 2021) are promising methods, which will be the focus of our next step of work.
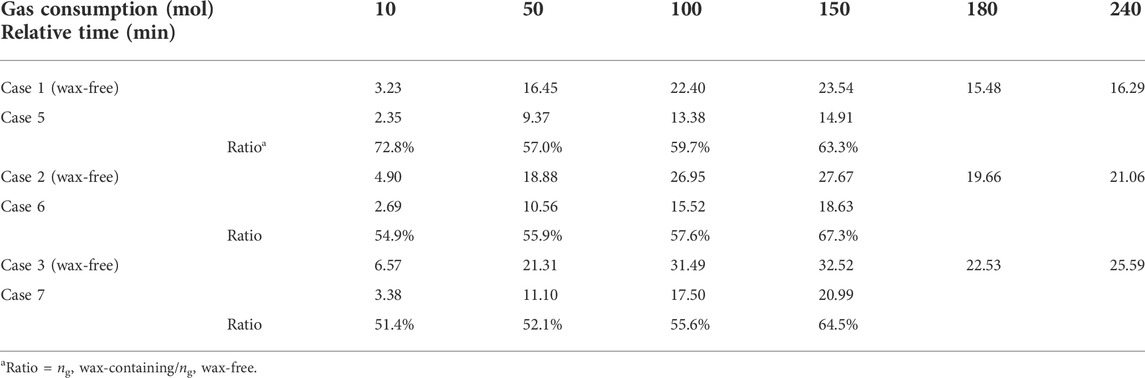
TABLE 4. Comparison of gas consumption of wax-free cases and their corresponding wax-containing cases at different relative times.
The effect of flow rate on hydrate growth in wax-containing systems is illustrated in Figure 5. As seen, the gas consumption curves of cases with different flow rates are basically close to each other for the first 60 min. During the early stage of hydrate growth, mass- and heat-transfer resistance may be the dominative rate-limiting factor, while the effect of flow rate i.e., shear condition, on the mass-transfer of gas and water molecules is considered to be marginal. Then deviations among these curves emerge and enlarge (60∼240 min). Finally, a higher initial flow rate (case 5 < 6<7) results in higher gas consumption: the final gas consumption of case 7 is around 25.59 mol, while that of case 5 and 6 is approximately 63.7% and 82.3% of case 7. During the latter stage of hydrate growth, particle agglomeration may be the dominating rate-limiting factor. The effect of flow rate on hydrate growth becomes perceptible. For wax-containing systems, the hydrate growth rate is maintained at a higher value than that of wax-free systems at the later stage. It is then hypothesized that the break-up and re-agglomeration of wax-hydrate coupling aggregates occurs more frequently in the bulk phase, resulting in the continual emergence of unconverted fresh water in a small amount. Herein, as the total gas consumption, or in other words, hydrate volume fraction (see Eq. 3), in wax-containing systems is much lower than that of wax-free systems, a significant question may arise: will the transportability of wax-containing cases be better than that of wax-free cases? Details can be found in the following subsection.
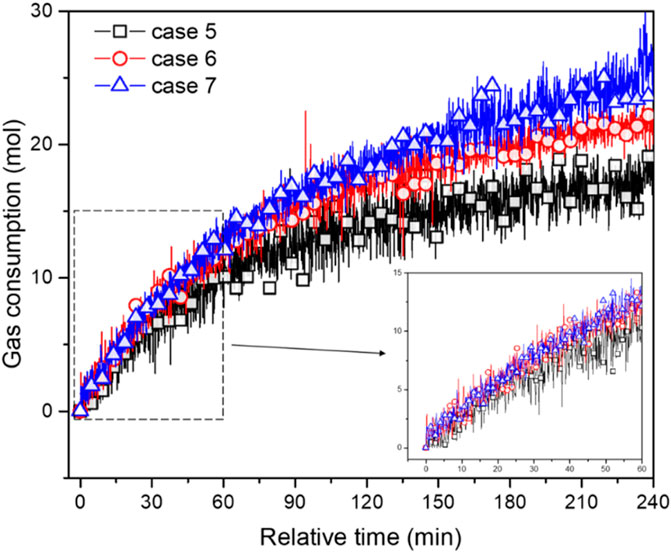
FIGURE 5. Variation trend of gas consumption of 1.25 wt% wax content systems under different initial flow rates (cases 5∼7) versus time.
3.3 The effects of wax on the flow properties of hydrate slurries
Figure 6 presents the variation trend of pressure drop, flow rate, and hydrate volume fraction during the experimental process of case 2 and 6. Note that other experimental conditions are the same for these two cases except for the wax content. For a wax-free system (case 2), pressure drop and flow rate are nearly stable before hydrate formation. After hydrate formation (2.5 h), both pressure drop and flow rate first decrease and then increase due to the dynamic balance between hydrate agglomeration and break-up of aggregates under the function of hydrate cohesive force and flow shear stress. At approximately 4.3 h, the flow rate restores to around 1310 kg/h, 93.6% of the initial value, while the pressure drop rises to 21.64 kPa due to the increment in viscosity of the fluid, an approximately 45.2% increase compared to the initial pressure drop. Finally, both pressure drop and flow rate plateau again with final hydrate volume fraction of around 10%, indicating that the wax-free flow system could reach a stable hydrate slurry flow state with 1 wt% addition of AA. Thus, hydrate risk-management strategy is applicable for this experimental condition. For wax-containing system (case 6), there is an abrupt increase in pressure drop at approximately 0.6 h, due to the reduction in flow diameter resulting from the onset of wax deposition. During the period of 0.6 h–1.95 h, the gradual deposition of wax results in a gradual increase in pressure drop from 15.83 kPa to 18.49 kPa, accompanied by an approximately 2.1% reduction in flow rate. At around 1.95 h, a sudden increase in pressure drop and a sudden decrease in flow rate are discerned, indicating the onset of hydrate formation, which is consistent with the judgement according to system temperature and pressure (see Figure 2). As seen, within 30min, the pressure drop rapidly increases from 18.49 kPa to 32.48 kPa, an approximately 75.7% increment, while the flow rate decreases from 1384 kg/h to 1185 kg/h. Then the pressure drop gradually increases with a gradual decrease in flow rate. Finally, there are an approximately 2-fold increase in pressure drop and a 36.8% reduction in flow rate compared to the initial values. The final hydrate volume fraction is around 6.4%, which is significantly smaller than that of case 2. Other wax-containing cases in this work exhibit similar variations in trends. Thus, it is found that the coexistence of wax and hydrates significantly deteriorates the transportability of flow systems and synergistically escalates the plugging risk compared to the wax-free situation. The reason can be ascribable to the coupling agglomeration of wax and hydrates that leads to the increase in fluid viscosity as well as the synergetic deposition of coupling aggregates that results in the reduction in flow diameter (Liu et al., 2018). Moreover, it is suggested that the effectiveness of AA is significantly weakened by wax crystals, which is possibly caused by the alteration of surface properties of water droplets in the presence of wax. The application of hydrate risk-management strategy should be carefully investigated for flow systems in the presence of wax, as there are high plugging risks even under low hydrate volume fraction (such as cases 5 and 6).
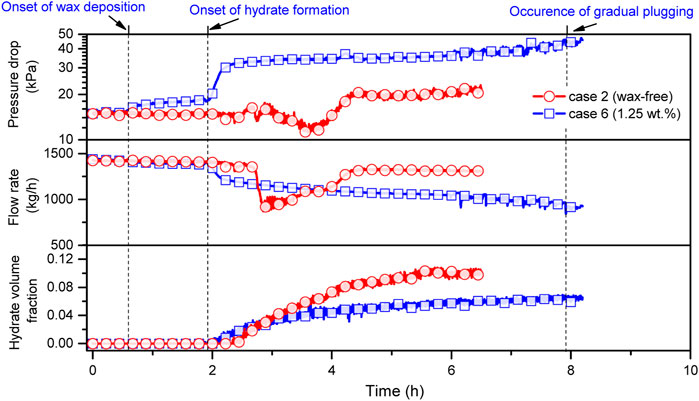
FIGURE 6. Variation trend of pressure drop, flow rate, and hydrate volume fraction of case 2 and 6 versus time.
For our experimental system, as the pressure drop, flow rate (i.e., velocity), and density can be acquired by the sensors equipped on the flow loop, the original Darcy formula (Eq. 4) can be transformed into Eq. 5.
where D0 is the initial diameter, m; α = D/D0, which represents the variation in flow diameter caused by solid deposition, 0<α ≤ 1; Qm is the flow rate, kg/s. The left-hand side of Eq. 5 can be directly calculated using the experimental data, while the right-hand side of Eq. 5 is a dimensionless parameter, which represents the overall friction coefficient caused by the emergence of solid phases, i.e., wax and/or hydrates, and the deposition of them. Since this dimensionless parameter and hydrate volume fraction (φhyd) during the experimental process can be calculated by Eqs. 3, 5 respectively, the relationship between them for both wax-free cases (cases 1∼3) and 1.25 wt% wax content cases (cases 5∼7) can then be obtained, as shown in Figure 7. Figure 7 clearly illustrates that the parameter λ/α5 should be the function of φhyd, wax content, and Re (flow rate). Regions with different plugging risk levels can then be divided by two critical values of λ/α5.
1) Region I (λ/α5 ≤ 0.1). Based on the fact that: 1) all the wax-free cases finally reach a stable hydrate slurry flow state with φhyd ranging from 6.5% to 12%; and 2) the parameter λ/α5 is always smaller than 0.1 no matter how φhyd varies, this region can be defined as low plugging risk. In this region, the size of hydrate aggregates could reach an equilibrium state with the function of flow shear stress (Camargo and Palermo, 2002) and AA, and is suggested to be relatively small. The possibility of occurrence of hydrate deposition is negligible. Moreover, the higher the flow rate, the lower the plugging risk. The parameter λ/α5 of case 3 that possesses a higher flow rate versus φhyd exhibit a nearly linear relationship. When φhyd of case 7 is smaller than 7%, plugging risk of case 7 is evaluated to be low.
2) Region II (0.1<λ/α5 ≤ 0.15). For cases 5 and 6 (1.25 wt% wax, lower flow rate), the parameter λ/α5 increases with the increase in hydrate volume fraction. When the hydrate volume fraction is relatively low (typically <1.5%), the pipe flow is capable of holding the aggregates, λ/α5 ≤ 0.1. As φhyd continues to increase, the viscosity of the flow system increases significantly due to the emergence of wax-hydrate coupling aggregates. However, as φhyd further becomes larger, some of the coupling aggregates with larger size can no longer be transported by the pipe flow, leading to the local deposition, which corresponds to the abrupt increase in the slope of λ/α5 versus φhyd curve when λ/α5 reaches approximately 0.15. In other words, it is the increment in viscosity rather than the deposition of aggregates that dominates λ/α5 in this region. Thus, this region is defined as medium plugged risk.
3) Region III (0.15<λ/α5). For cases 5 and 6, the parameter λ/α5 increases rapidly with the increase in φhyd, which is considered to be caused by the synergistic deposition of coupling aggregates. The occurrence of deposition would result in a decrease in flow diameter and flow rate, consequently resulting in a large amount of deposition. The transportability of pipe flow in this region severely deteriorates. Thus, this region is defined as high plugging risk.
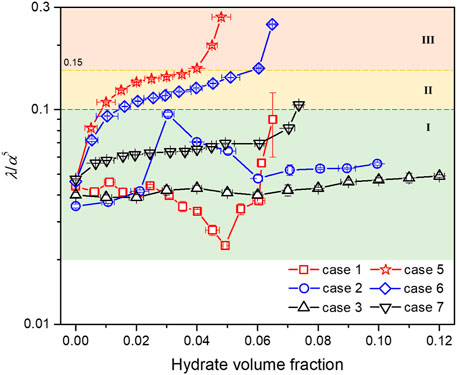
FIGURE 7. Variation trend of the dimensionless parameter λ/α5 versus hydrate volume fraction. The vertical axis is in log-scale. Regions marked by I, II, and III in different colors represent low, medium, and high plugging risks, respectively.
Therefore, the plugging risk of a flow system can be categorized into low, medium, or high according to the dimensionless parameter λ/α5. The higher the parameter, the higher the plugging risk. The plugging risk of the whole experimental process of wax-free cases under different flow rates was determined to be low, while that of wax-containing cases under relatively lower flow rates varied from low to high with the increasing hydrate volume fraction. Taking case 7 as an example, Figure 8 depicts the trace of parameters during the experimental process, where low (I) and medium (II) plugging risk regions are marked. Moreover, based on the relationship between this parameter and hydrate volume fraction, the reason that provokes different plugging risks can be analyzed. More experiments conducted under a wider range of experimental conditions, e.g., water cut, the dosage and category of AA, wax contents, flow rate, etc., are urgently required, mathematical models predicting the friction loss of flow systems as well as similarity criterions between experimental data and field data are urgently to be developed, so as to validate and expand the use of this dimensionless parameter for real subsea pipelines.
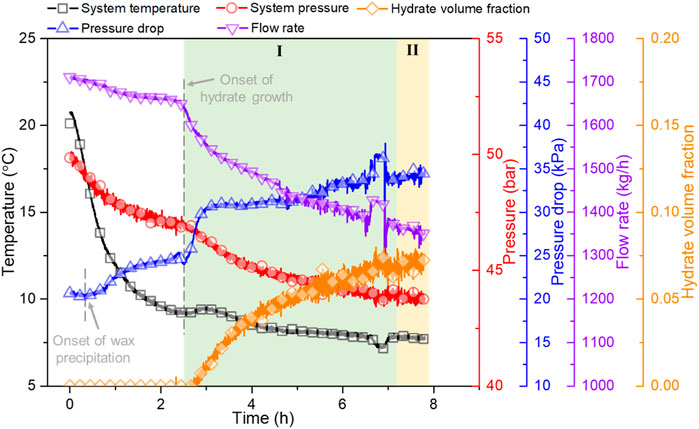
FIGURE 8. Variation trend of system temperature, system pressure, pressure drop, flow rate, and hydrate volume fraction during the experimental process of case 7. Regions marked by I and II represent low and medium plugging risks, respectively.
4 Conclusion
Flow experiments were conducted using w/o emulsion systems with 0, 0.75, and 1.25 wt% wax content under different initial flow rates. The effects of wax on hydrate nucleation as well as the flow properties of waxy hydrate slurries were investigated. The experimental results are summarized as follows:
1) In the flow systems of this work, the onset of wax precipitation was within the induction period of hydrate formation. The induction times of 1.25 wt% wax content systems were around 55%∼75% of those of wax-free systems. The induction time was shortened with the increasing wax content and prolonged with the increasing flow rate. As far as we know, it was the first time to find the heterogeneous nucleation effect of wax that promoted hydrate nucleation in flow systems. It was also suggested that the effect path of wax on hydrate nucleation was predominately determined by the time sequence of hydrate nucleation and wax precipitation.
2) The gas consumption rate (i.e., hydrate growth rate) of 1.25 wt% wax content systems was significantly smaller than that of wax-free systems. The ratio of the cumulative gas consumption (i.e., the amount of hydrate formation) of wax-containing cases to that of wax-free cases ranged from approximately 50%–70%, indicating the inhibiting effect of wax on hydrate growth. The above phenomenon was presumably caused by the enhanced mass-transfer resistance and severer coupling agglomeration due to the interfacial adsorption of wax. Notably, the effect of particle agglomeration on hydrate growth should not be ignored.
3) Different from the wax-free situation that reaches a stable slurry flow state with the addition of AA, the transportability of wax-containing systems deteriorates even with the same dosage of AA and lower hydrate volume fraction. The coexistence of wax and hydrates resulted in a higher plugging risk due to the coupling agglomeration and the synergetic deposition. Based on the Darcy-Weisbach hydraulic formula, a dimensionless parameter was then derived to evaluate and characterize the plugging risk level of flow systems, which should be the function of hydrate volume fraction, wax content, and Reynolds number (flow rate). This parameter comprehensively considers the effect of solid deposition and the increase in fluid viscosity due to particle agglomeration. The critical points were also determined according to the relationship between this parameter and the hydrate volume fraction.
The findings of this work can shed light on the mechanism of the effect of wax on hydrate formation to some extent and provide some meaningful data and reference for predicting the plugging risk for flow systems in the presence or absence of wax crystals.
Data availability statement
The original contributions presented in the study are included in the article/supplementary material; further inquiries can be directed to the corresponding authors.
Author contributions
YL and BS contributed to the conception and design of the study. CUW, JM, and CEW organized the database. YL, JM, and SZ performed the statistical analysis. YL wrote the first draft of the manuscript. XL, QM, and SS wrote sections of the manuscript. HH reviewed the manuscript. All authors contributed to manuscript revision, read, and approved the submitted version.
Funding
This work was supported by the National Natural Science Foundation of China (Grant No. 52004039 & 51974037), Beijing Municipal Natural Science Foundation (Grant No. 3192027), Open Project of Jiangsu Key Laboratory of Oil-gas Storage and Transportation Technology (Grant No. CDYQCY202102), China Postdoctoral Science Foundation (Grant No. 2021M693908) and a major project of universities affiliated with Jiangsu Province Basic Science (Natural Science) Research (No. 21KJA440001), all of which are gratefully acknowledged.
Conflict of interest
Author XL was employed by the company Sinopec Northwest Oil Field Company. Author BS was employed by the company Shenzhen Kaifa Technology (Chengdu) Co., Ltd.
The remaining authors declare that the research was conducted in the absence of any commercial or financial relationships that could be construed as a potential conflict of interest.
Publisher’s note
All claims expressed in this article are solely those of the authors and do not necessarily represent those of their affiliated organizations, or those of the publisher, the editors, and the reviewers. Any product that may be evaluated in this article, or claim that may be made by its manufacturer, is not guaranteed or endorsed by the publisher.
Appendix 1 WAT of the diesel with different wax contents
DSC is generally used to determine the WAT of a waxy oil sample. In the DSC tests (TA instruments, model Q20), the oil sample with wax was cooled from 80 °C to −20 °C at a rate of 5°C/min. For each sample, the reproducibility was verified by repeating the experiment three times. Appendix Figure A1 shows the DSC heat-flow diagrams of diesel with different wax contents. The first “small” exothermic peak in the DSC heat-flow diagram (B and C) corresponds to the precipitation of the additional wax content, while the second “large” exothermic peak represents the precipitation of the heavy ends of diesel oil (Liu et al., 2018). For diesel without wax addition, there is also an exothermic peak at around −8.3 °C.
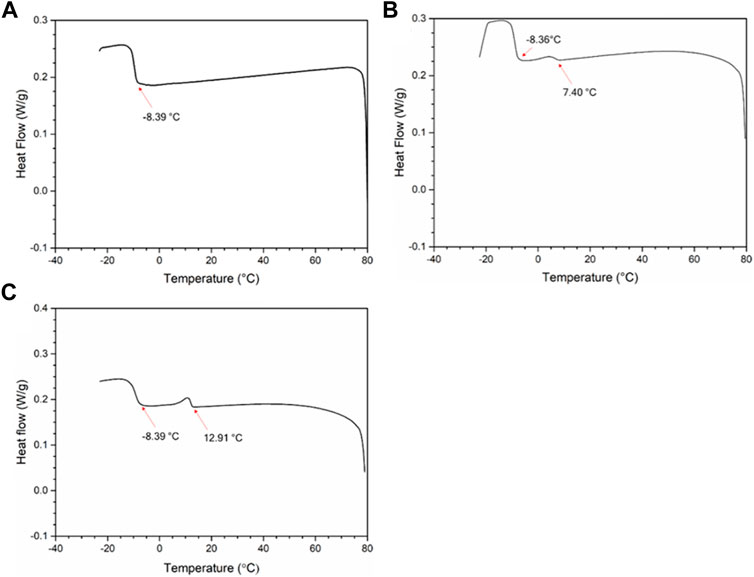
FIGURE A1. DSC heat-flow diagram of (A) pure diesel, (B) diesel with 0.75 wt.% wax content and (C) diesel with 1.25 wt.% wax content.
References
Aman, Z. M. (2021). Hydrate risk management in gas transmission lines. Energy fuels. 35 (18), 14265–14282. doi:10.1021/acs.energyfuels.1c01853
Brown, E. P., Turner, D., Grasso, G., and Koh, C. A. (2020). Effect of wax/anti-agglomerant interactions on hydrate depositing systems. Fuel 264, 116573. doi:10.1016/j.fuel.2019.116573
Camargo, R., and Palermo, T. (2002). Rheological properties of hydrate suspensions in an asphaltenic crude oil. Proceedings of the 4th International Conference on Gas Hydrates.
Chen, G. J., and Guo, T. M. (1998). A new approach to gas hydrate modelling. Chem. Eng. J. 71, 145–151. doi:10.1016/s1385-8947(98)00126-0
Chen, Y., Shi, B., Liu, Y., Ma, Q., Song, S., Ding, L., et al. (2019). In situ viscosity measurements of a cyclopentane hydrate slurry in waxy water-in-oil emulsions. Energy fuels. 33 (4), 2915–2925. doi:10.1021/acs.energyfuels.8b04268
Chen, Y. C., Shi, B. H., Fu, S., Li, Q., Yao, H., Liu, Y., et al. (2021). Kinetic and rheological investigation of cyclopentane hydrate formation in waxy water-in-oil emulsions. Fuel 287, 119568. doi:10.1016/j.fuel.2020.119568
Chen, L., Koh, C. A., and Sun, B. J. (2022). Insight into the plugging mechanism in water-continuous hydrate slurries. Fuel 316, 123360. doi:10.1016/j.fuel.2022.123360
Daraboina, N., Pachitsas, S., and Solms, N. V. (2015). Natural gas hydrate formation and inhibition in gas/crude oil/aqueous systems. Fuel 148, 186–190. doi:10.1016/j.fuel.2015.01.103
Farhadian, A., Varfolomeev, M. A., Rezaeisadat, M., Semenov, A. P., and Stoporev, A. S. (2020). Toward a bio-based hybrid inhibition of gas hydrate and corrosion for flow assurance. Energy 210, 118549. doi:10.1016/j.energy.2020.118549
Gao, S. Q. (2008). Investigation of interactions between gas hydrates and several other flow assurance elements. Energy fuels. 22 (5), 3150–3153. doi:10.1021/ef800189k
Guo, P., Song, G., Ning, Y., Li, Y., and Wang, W. (2021). Investigation on hydrate growth at oil–water interface: In the presence of wax. Energy fuels. 35 (15), 11884–11895. doi:10.1021/acs.energyfuels.1c01173
Hassanpouryouzband, A., Joonaki, E., Faragani, M. V., Takeya, S., Ruppel, C., Yang, J. H., et al. (2020). Gas hydrates in sustainable chemistry. Chem. Soc. Rev. 49, 5225–5309. doi:10.1039/c8cs00989a
Hassanpouryouzband, A., Joonaki, E., Edlmann, K., and Haszeldine, R. S. (2021). Offshore geological storage of hydrogen: Is this our best option to achieve net-zero? ACS Energy Lett. 6 (6), 2181–2186. doi:10.1021/acsenergylett.1c00845
Ji, H. Y. (2004). Thermodynamic modelling of wax and integrated wax-hydrate Doctor Dissertation. Edinburgh: Heriot-Watt University.
Ke, W., and Kelland, M. A. (2016). Kinetic hydrate inhibitor studies for gas hydrate systems: A review of experimental equipment and test methods. Energy fuels. 30, 10015–10028. doi:10.1021/acs.energyfuels.6b02739
Liang, H., Guan, D., Yang, L., Zhang, L., Song, Y., and Zhao, J. (2021). Multi-scale characterization of shell thickness and effective volume fraction during gas hydrates formation: A kinetic study. Chem. Eng. J. 424, 130360. doi:10.1016/j.cej.2021.130360
Liang, H., Guan, D., Shi, K., Yang, L., Zhang, L., Zhao, J., et al. (2022). Characterizing mass-transfer mechanism during gas hydrate formation from water droplets. Chem. Eng. J. 428, 132626. doi:10.1016/j.cej.2021.132626
Liao, Q., Shi, B., Li, S., Song, S., Chen, Y., Zhang, J., et al. (2021). Molecular dynamics simulation of the effect of wax molecules on methane hydrate formation. Fuel 297, 120778. doi:10.1016/j.fuel.2021.120778
Liu, Y., Shi, B. H., Ding, L., Yong, Y., Zhang, Y., Ma, Q. L., et al. (2018). Investigation of hydrate agglomeration and plugging mechanism in low-wax-content water-in-oil emulsion systems. Energy fuels. 32 (9), 8986–9000. doi:10.1021/acs.energyfuels.8b01323
Liu, Y., Shi, B. H., Ding, L., Ma, Q. L., Chen, Y. C., Song, S. F., et al. (2019). Study of hydrate formation in water-in-waxy oil emulsions considering heat transfer and mass transfer. Fuel 244, 282–295. doi:10.1016/j.fuel.2019.02.014
Liu, Y., Lv, X., Shi, B., Zhou, S., Lei, Y., Yu, P., et al. (2021). Rheological study of low wax content hydrate slurries considering phase interactions. J. Nat. Gas. Sci. Eng. 94, 104106. doi:10.1016/j.jngse.2021.104106
Liu, J., Wang, J., Dong, T., and Liang, D. Q. (2022). Effects of wax on CH4 hydrate formation and agglomeration in oil–water emulsions. Fuel 322, 124128. doi:10.1016/j.fuel.2022.124128
Liu, Y., Wu, C. X., Lv, X. F., Xu, X., Ma, Q., Meng, J., et al. (2022). Evolution of morphology and cohesive force of hydrate particles in the presence/absence of wax. RSC Adv. 12, 14456–14466. doi:10.1039/d2ra02266d
Ma, Q. L., Wang, W., Liu, Y., Yang, J. H., Shi, B. H., and Gong, J. (2017). Wax adsorption at paraffin oil–water interface stabilized by Span80. Colloids Surfaces A Physicochem. Eng. Aspects 518, 73–79. doi:10.1016/j.colsurfa.2017.01.023
Mohammed, I., Mahmoud, M., Shehri, D. A., El-Husseiny, A., and Alade, O. (2021). Asphaltene precipitation and deposition: A critical review. J. Pet. Sci. Eng. 197, 107956. doi:10.1016/j.petrol.2020.107956
Oliveira, M. C. K. D., Teixeira, A., Vieira, L. C., Carvalho, R. M. D., Carvalho, A. B. M. D., and Couto, B. C. D. (2012). Flow assurance study for waxy crude oils. Energy fuels. 26 (5), 2688–2695. doi:10.1021/ef201407j
Raman, A. K. Y., and Aichele, C. P. (2017). Effect of particle hydrophobicity on hydrate formation in water-in-oil emulsions in the presence of wax. Energy fuels. 31 (5), 4817–4825. doi:10.1021/acs.energyfuels.7b00092
Shi, B. H., Jing, G., Sun, C. Y., Zhao, J. K., Ding, Y., and Chen, G. J. (2011). An inward and outward natural gas hydrates growth shell model considering intrinsic kinetics, mass and heat transfer. Chem. Eng. J. 171 (3), 1308–1316. doi:10.1016/j.cej.2011.05.029
Shi, B. H., Chai, S., Ding, L., Chen, Y. C., Liu, Y., Song, S. F., et al. (2018). An investigation on gas hydrate formation and slurry viscosity in the presence of wax crystals. AIChE J. 64, 3502–3518. doi:10.1002/aic.16192
Shi, B. H., Song, S. F., Chen, Y. C., Duan, X., Liao, Q. Y., Fu, S. K., et al. (2021). Status of natural gas hydrate flow assurance research in China: A review. Energy fuels. 35, 3611–3658. doi:10.1021/acs.energyfuels.0c04209
Sloan, E. D., and Koh, C. A. (2007). Clathrate hydrates of natural gases. 3rd ed. New York: CRC Press.
Sloan, E. D., Koh, C. A., Sum, A. K., Ballard, A. L., Creek, J., Eaton, M., et al. (2010). Natural gas hydrates in flow assurance. Oxford: Gulf Professional Publishing.
Song, G. C., Li, Y. X., Wang, W. C., Jiang, K., Ye, X., and Zhao, P. F. (2017). Investigation of hydrate plugging in natural gas+diesel oil+water systems using a high-pressure flow loop. Chem. Eng. Sci. 158, 480–489. doi:10.1016/j.ces.2016.10.045
Song, G., Ning, Y., Guo, P., Li, Y., and Wang, W. (2021). Investigation on hydrate growth at the oil-water interface: In the presence of wax and surfactant. Langmuir 37 (22), 6838–6845. doi:10.1021/acs.langmuir.1c01060
Sun, Z. W., Shi, K. J., Guan, D. W., Lv, X., Wang, J. G., Liu, W. G., et al. (2021). Current flow loop equipment and research in hydrate-associated flow assurance. J. Nat. Gas. Sci. Eng. 96, 104276. doi:10.1016/j.jngse.2021.104276
Turner, D. J., Miller, K. T., and Sloan, E. D. (2009). Methane hydrate formation and an inward growing shell model in water-in-oil dispersions. Chem. Eng. Sci. 64 (18), 3996–4004. doi:10.1016/j.ces.2009.05.051
Wang, W., Huang, Q. Y., Hu, S. J., Zhang, P., and Koh, C. A. (2020). Influence of wax on cyclopentane clathrate hydrate cohesive forces and interfacial properties. Energy fuels. 34 (2), 1482–1491. doi:10.1021/acs.energyfuels.9b03543
Zhang, D., Huang, Q., Li, R., Wang, W., Zhu, X., Li, H., et al. (2021). Effects of waxes on hydrate behaviors in water-in-oil emulsions containing asphaltenes. Chem. Eng. Sci. 244, 116831. doi:10.1016/j.ces.2021.116831
Zhang, J., Li, C. X., Shi, L., Xia, X., Yang, F., and SunGY, (2022). The formation and aggregation of hydrate in W/O emulsion containing different compositions: A review. Chem. Eng. J. 445, 136800. doi:10.1016/j.cej.2022.136800
Keywords: flow assurance, plugging risk, flow loop, induction time, hydrate growth rate
Citation: Liu Y, Meng J, Lv X, Ma Q, Shi B, Wang C, Huang H, Wu C, Zhou S and Song S (2022) Investigating hydrate formation and flow properties in water-oil flow systems in the presence of wax. Front. Energy Res. 10:986901. doi: 10.3389/fenrg.2022.986901
Received: 05 July 2022; Accepted: 26 August 2022;
Published: 23 September 2022.
Edited by:
Mostafa S. Shadloo, Institut national des sciences appliquées de Rouen, FranceReviewed by:
Bingyuan Hong, Zhejiang Ocean University, ChinaAliakbar Hassanpouryouzband, University of Edinburgh, United Kingdom
Henrique A. Matos, Universidade de Lisboa, Portugal
Copyright © 2022 Liu, Meng, Lv, Ma, Shi, Wang, Huang, Wu, Zhou and Song. This is an open-access article distributed under the terms of the Creative Commons Attribution License (CC BY). The use, distribution or reproduction in other forums is permitted, provided the original author(s) and the copyright owner(s) are credited and that the original publication in this journal is cited, in accordance with accepted academic practice. No use, distribution or reproduction is permitted which does not comply with these terms.
*Correspondence: Yang Liu, bGl1LnlAY2N6dS5lZHUuY24=, Y2hyaXNibGFja0Bmb3htYWlsLmNvbQ==; Xiaofang Lv, bHZ4aWFvZmFuZzVAY2N6dS5lZHUuY24=