 Jing Deng
 Siying Guan
 Huike Zheng
 Xiaoyun Xing
 Cheng Liu3
- 1School of Economics and Management, Beijing Forestry University, Beijing, China
- 2School of International Trade and Economics, University of International Business and Economics, Beijing, China
- 3Research Centre for the Two Mountains Theory and Sustainable Development, Beijing Forestry University, Beijing, China
With the purpose of risk management for fossil energy investors, this paper examines the dynamic spillover effect and asymmetric connectedness between fossil energy, green financial and major traditional financial markets in China. By employing the spillover index model of Diebold and Yilmaz, a weak correlation between green financial and fossil energy markets is verified, and the market connectedness remains relatively calm despite the COVID-19 pandemic outbreak. Specifically, green bonds receives fewer shocks from crude oil than coal, green stocks receive fewer shocks from coal than crude oil. In addition, rather than the safe-haven characteristics presented by gold, this paper further proves that green bonds also have the potential to act as safe-haven assets, due to the fact that the connectedness between green bonds and energy markets is at low levels. Finally, the magnitude of return spillovers between markets would vary significantly during different periods. The results obtained in this paper have practical implications for both investors and policymakers.
1 Introduction
Due to the sensitivity of energy prices to economic and geopolitical event (Floros and Galyfianakis, 2020), energy markets have historically been characterized by a high degree of uncertainty (Ji et al., 2018b). Influenced by the COVID-19 pandemic, the economic and production activities have experienced a significant slowdown, resulting in a considerable reduction in global energy demands (Hoang et al., 2021). Additionally, geopolitical strife has heightened supply-side vulnerabilities. Since the conflict between Russia and Ukraine has rendered a great impact on the international coal trade pattern,the global supply and demand of coal are unbalanced now, especially China who acts as a big coal consumer. Crude oil prices have varied substantially in recent years, increasing the risks faced by fossil energy investors. With these considerations, it is necessary to consider the energy market’s spillover effect, which is crucial for both investors and energy policymakers.
As the main consumer of energy, China’s acquisition of energy goods is highly reliant on international imports (Tang et al., 2015). Also, China’s economic development is highly dependent on coal. Under the reconstruction of coal production capacity, the supply is still very limited in the short term, and there is still a large import demand. Nevertheless, China is currently in an inferior position in the global energy market, with relatively limited pricing power (Ji and Fan, 2016). Hence, energy investors in China are confronted with high risk. Moreover, international participants in the emerging Shanghai crude oil futures market may have an effect on China’s crude oil futures market (Ji and Zhang, 2019). This means that risks associated with worldwide crude oil prices might readily spread to China’s domestic markets, posing an unavoidable problem. As a consequence, holding oil-related assets in China may increase portfolio uncertainty, potentially deteriorating return and risk performance.
Meanwhile, climate change has triggered growing concerns from the international community, along with the agreement reached at The Paris Climate Conference in December 2015. The agreement established a long-term goal for the global response to climate change, proposing to achieve net zero emissions of greenhouse gases in the second half of the 21st century (UNFCCC, 2015). Over the past 2 decades, China’s CO2 emissions have grown six times faster than the rest of the world, accounting for nearly two-thirds of global CO2 emissions growth (IEA, 2020). As the world’s largest carbon emitter, China plays a critical role in the worldwide network of embodied carbon emission transfer (Jiang et al., 2019), and has promised the international community to strive to reach carbon emissions peak by 2030 and to achieve carbon neutral by 2060.
The consensus is that energy transition is the key to climate governance, as global warming caused by excessive consumption of fossil fuels has posed a threat to humanity’s survival in terms of resources, ecology, economy, etc. As for the Chinese policymakers, the efforts should be made from two perspectives. One is to enhance non-fossil energy consumption, while the other is to decrease traditional fossil energy use, particularly coal consumption (He et al., 2022). Admittedly, ambitious emission reduction targets have advanced the revolution of energy transition. They do, however, add to the uncertainty in the financial markets. In particular, the decline in demand for fossil fuels is quite likely to increase investor’s anxiety in the fossil energy markets. The Paris Agreement would pose challenges for energy risk management (Batten et al., 2018), putting fossil fuel firms in a difficult position, and simultaneously exposing the corresponding financial assets to risk exposure (Curtin et al., 2019). Thus, in the context of global climate governance, the implementation of the related policies in China as well as investors’ sentiment would even exacerbate the risks of investing in energy markets.
We consider financial markets as a complex network that investigates the spillover effects between various markets and gives investors with portfolio asset ideas. Minimizing the risk of portfolio selection during the COVID-19 pandemic and selecting the best strategy to shield the investor from the anticipated loss during a crisis are crucial components of any investment. Among the literature,different energy commodities can be considered to reduce their own risks (Ghorbel and Trabelsi, 2014). In addition, most studies show that energy investors can focus on the stocks (Batten et al., 2017, 2018), agricultural commodities (Nazlioglu, 2011) and gold marketsgold (Reboredo, 2013; Shahzad et al., 2019) at the same time to ensure their returns. Along with the flourish development of green financial markets as well as the growing awareness of the climate crisis, both green (renewable energy or new energy) stocks and green bonds become investors’ favored options in capital markets. Due to the considerable substitution relationship between fossil and renewable energy sources, higher fossil fuel prices increase the economic viability of renewable energy projects, whereas low prices decrease the value of renewable energy companies. There is a weak correlation between crude oil and renewable energy stocks, so that combining the two provides a lucrative hedging prospect (Henriques and Sadorsky, 2008; Ahmad, 2017). Likewise, green bonds are also found to be weakly related with energy markets (Reboredo, 2018; Reboredo and Ugolini, 2020). Based on these findings, conclusions can be safely drawn that green financial assets are alternative instruments of risk management in energy markets.
Nevertheless, most of the previous surveys on the risk dispersion effect of green financial assets were based on data from developed economies, and there was little evidence from China. As the world’s second largest economy, major energy consumer and largest CO2 emitter, China can play a key role in the global energy revolution. Its special basic reality leads to a unique energy structure. On the one hand, as a developing country, China continues to face the objective needs to build its economy and improve people’s livelihoods. Driven by China’s large industries, China’s energy demand has increased rapidly in recent years, whereas that in some developed countries, such as Europe and the United States, begins to fall. On the other hand, fossil fuels account for approximately 85% in China’s energy structure, in which coal (constituting 57.7%) is the mainstay rather than crude oil. Figure 1 exhibits the structural difference between China and the United States, Japan, Germany, and other countries. China has recently enacted a number of supply-side regulations aimed at reducing coal use in order to meet emission reduction targets. However, since the second half of 2020, due to the recovery of industrial output and the increase of heating demand in winter, the overall demand for thermal coal has been relatively large, and the demand for environmental protection has also been large. Consequently, both coal prices and risks of coal markets keep rising at nearly the same pace. As the main source of volatility in the global coal markets, China’s coal market merits additional attention (Batten et al., 2019).
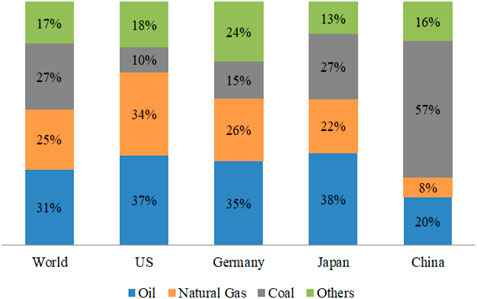
FIGURE 1. Shares of primary energy in different countries. See British Petroleum (2020b), Available at https://www.bp.com/.
As a the core of the economy, green finance plays a significant role in the low-carbon transition of the economy. Therefore, the Chinese government has repeatedly emphasized the importance of establishing a green financial system. With environmental concerns and policy support, China’s green finance has advanced rapidly (Yu et al., 2021). Following the first issuance of green bonds in 2015, China’s green bond market has grown rapidly, China has become the emerging market economy with the largest issuance of green, sustainable and social related bonds. At the same time, China’s cumulative issuance of green bonds ranks second in the world. In 2019, the trading volume of green bonds in China accounts for above 20% of the global green bond market (Chen and Zhao, 2021). In the meantime, China’s new energy stock market has attracted more and more investors, the successful listing of many new energy enterprises has been highly recognized by the society (Liu et al., 2022). According to Renewable Energy Policy Network (REN21), Chinese renewable energy investment accounts for 32% in 2018, taking the lead of global renewable energy investment (Now, 2019).
Unlike the previous pandemics, there is consensus that the COVID-19 would render great impacts on the global economy and financial markets. Moreover, with the outbreak of the COVID-19 pandemic and its adverse impact on the energy market, most energy industries in China have suffered enormously (Tong et al., 2022), the risk aversion of assets might change (Elgammal et al., 2021). With these considerations, three questions are addressed. What is the dynamic connectedness between China’s various energy assets and other financial assets? Do green financial assets act superiorly compared with other assets as risk management instruments in energy markets? How may the COVID-19 pandemic and the volatility of oil and coal prices affect the spillover effect between energy and green financial markets?
The main contributions of this paper are as follows. Firstly, energy assets are divided into crude oil and coal in the analysis. To represent green financial markets, green stocks and bonds are introduced. This paper not only proves the weak relationship between energy markets and green financial markets, but also identifies which one of the green financial assets would be weaker correlated with energy markets. Secondly, both the traditional financial assets that interact with energy-related markets as well as the traditional safe-haven assets are also considered in the present study, with the aim of emphasizing the superiority of green financial assets as risk management instruments. Thirdly, apart from static analysis, dynamic and asymmetric analyses are also conducted in order to accurately capture the risk contagion across time periods and situations. This paper finds that green bonds and stocks may become better safe havens with the proposal of carbon peaking and carbon neutrality goals, but investors still should be cautious of extraordinary uncertainty in the coal market.
The remainder of this paper is organized as follows. Section 2 reviews the related literature. Section 3 introduces the methodology. Section 4 describes the data and provides the preliminary analysis. Section 5 presents the empirical results. Section 6 concludes.
2 Literature review
2.1 Spillover effects between crude oil and other markets
There is plenty of literature suggesting that energy commodities and stocks are weakly correlated, which can be therefore combined to achieve a good portfolio performance. Through the wavelet analysis, Khalfaoui et al. (2015) the spillovers between the global oil market and the G7 stock markets. Following the outbreak of the global financial crisis in 2008, it is verified that the volatility transition between the two markets has risen tremendously.Moreover, Chkili et al. (2014) focus on the dynamic spillovers between crude oil and United States stock markets, thus ending up with the conclusion that the correlations between those market would significantly increase during the periods of ascending economic uncertainty. As can be seen, the majority of investigations focus on global oil prices and stockmarkets in developed economy, and there is scant data for China’s markets. However, there are still several exceptions. For example, both Sadorsky (2014) and Batten et al. (2018) emphasize the necessity of studying emerging markets, and present the correlation index based on the data of oil markets collected from the developed and developing countries.
Meanwhile, as the most recognized safe-haven asset, the spillovers between gold and crude oil have been largely studied as well. It is commonly verified that there exists a relatively weak relationship between gold and energy markets, especially crude oil markets (Narayan et al. (2010); Reboredo (2013); Bildirici and Turkmen (2015)). In addition, Junttila et al. (2018) find that gold is an attractive cross-market hedging instrument especially in turbulent times, with its safe-160 haven properties as an asset being significant in energy stocks. Based on a more recent research, Elgammal et al. (2021) point out that the spillovers between the energy, stock, and gold markets have evolved over time, particularly in the aftermath of the COVID-19 epidemic.
Since biofuels that depend on crops, such as corn and soybeans, are one of the alternatives to chemical energy sources (Chang and Su, 2010), oil markets are often linked to agricultural markets in the spillover analysis, (Harri et al., 2009).Based on the linear causality analysis, Nazlioglu et al. (2013) believe that oil prices and agricultural prices do not affect each other. Using the data from South Africa, Fowowe (2016) ends up with a similar conclusion. Specifically, he discovers that agricultural prices are neutral to global oil prices in both short and long terms. In contrast, Nazlioglu and Soytas (2012) conclude that oil prices have a significant impact on the prices of agricultural commodities, by analyzing the prices of 24 types of agricultural commodities worldwide. Subsequently, Ji et al. (2018a) establish a dependence-switching CoVaR-copula model, indicating that along with the financialization of agricultural commodities, there is a high tail dependence between energy and agricultural markets.
Moreover, Foglia and Angelini (2020) find that dynamic connectedness between oil and clean energy sector reach their highest values in turbulence times. Accordingly, it’s explicit that the spillovers between crude oil and other markets would vary against not just geographical factors but also economic aspects1. From these perspectives, this paper intends to add to the knowledge about the dynamic networking performance between crude oil and other markets, by conducting empirical analysis based on the data from China’s markets covering the periods of both the COVID-19 pandemic and the subsequent economic recovery phases.
2.2 Market connectedness between coal and other assets
China is now the world’s second-largest economy. With the development of China’s economy and the rising energy consumption, China’s energy markets have become more susceptible to global factors. By presenting an overview of the changing status of China using data from 1991 to 2016, Yu et al. (2020) conclude that China has turned into a spreader of spillovers and an indispensable participant in globalization. However, most of the existing literature pay attention to the connectedness between oil and China’s stock markets. Li and Wei (2018) employ Brent oil and the Shanghai Stock Index to demonstrate that the financial crisis would enhance the dependences between the crude oil market and China stock market, especially under long-term investment horizons. Wang and Wang (2019) examine the connectedness between the international oil and 11 sectors in China’s stock markets. Applying the data from Shanghai oil futures, Zhu et al. (2021) demonstrate that oil futures are substantially influenced by stock markets during the COVID-19 pandemic.
Coal is crucial to China’s energy framework, even more important than oil in the country’s energy markets. It is already argued that coal-related shocks might be more essential in terms of the spillovers of Chinese energy stocks (Sun et al., 2021). Therefore, it is vital to segregate various types of energy submarkets in order to provide more rigorous suggestions about risk management. Compared to oil, empirical studies on risk management in coal markets are relatively lacking. Through a diagonal BEKK model, Zolfaghari et al. (2020) argue that coal markets are distinct from oil markets in terms of their negative correlation with stock markets.According to the data collected in Asia, Batten et al. (2017)) note that coal and natural gas would perform differently in hedging oil, owing to the high dependence on the energy structure of this region on coal. Naeem et al. (2021b) reveal the existence of multiple tail dependence regimes between the various components of the five energy markets (crude oil, natural gas, heating oil, gasoline, and coal) and green bonds. From this point, this paper contributes to the literature by providing new insights into the risk management in China’s energy markets, by exploring the spillover effect between China’s coal and oil markets respectively, particularly in light of the current supply constraints and anomalous coal prices.
2.3 The nexus between green financial and fossil energy markets
With the rapid development of green financial markets, there is a growing body of literature investigating the spillovers between fossil energy markets and green financial ones, arising from the significant substitution relationship between fossil and renewable energy. Nevertheless, research on the spillovers of green financial assets is still in its infancy and growing phases with much faultiness.
Firstly, most of the existing literature examine the possibility of a single green investment to mitigate the risk associated with energy investments. Bouri et al. (2022) underline the impact of climate policy on the preference of investors for green energy stocks, which matters for asset pricing, style rotation strategies, and asset allocation. With regard to green stocks, the information transmission between the stock prices of renewable energy and fossil energy assets is first discussed by Henriques and Sadorsky (2008) with a vector autoregressive (VAR) model. They find that renewable energy stock prices are closely related to technology stock prices while weakly affected by oil prices. Sadorsky (2012) extends these findings with a multivariate GARCH model and suggests that their correlation increased following the global financial crisis (GFC). Besides, Ahmad (2017) applies the directional spillover index approach to analyze the process of information transmission among the prices of clean energy firms, technology stocks and oil prices. Finally, argues that there is high interdependence structure between clean energy stocks and technology stocks. By employing a wavelet approach, Reboredo et al. (2017) report the evidence of a moderate correlation between global oil prices and renewable energy stock prices in the short term, while a strong correlation in the long term. In terms of green bonds, Reboredo (2018) constructs systemic risk models of copulas and CoVaR to explore the tail correlation between green bonds and other global financial assets, concluding that the green bond market is not tightly linked to other markets. Pham and Nguyen (2021) end up with the similar conclusions through the Cross-Quantilogram (CQ), identifing the cross-quantile dependence between green bonds and other assets. Moreover, Naeem et al. (2021a)apply the same approach to verify the asymmetric spillover between green bonds and different classes of increasingly financialized commodities across the time-and frequency-domain.
Secondly, in the existing research, green financial assets are often represented by global indices, such as MSCI Green Bond Index and S&P Green Bond Index. Due to the considerable investment demands and policy support in China, the association between China’s green financial and energy markets is worth discussing. To the best of our knowledge, few studies have yet been conducted based on China’s data. Lin and Chen (2019) investigate the dynamic correlations and volatility spillovers between Beijing CET market, coal market and stock market of NEC based on VAR model and GARCH model,and discover that there exists time-varying correlation and significant long-term persistence of shocks in both the coal and new energy stock markets in China. Gao et al. (2021) analyze China’s data from 2015 to 2020 and discover that the green bond market is affected by the unidirectional spillover from green stocks, industrial stocks, and industrial commodities.
Thirdly, positive and negative market impacts in one market may spillover into other markets in different ways, making asymmetric correlations critical for investors. However, only a few papers have included asymmetric correlations in the study of risk management, especially the asymmetry in spillover of China’s green financial markets. Xia et al. (2019) investigates the dependence between various fossil energy products returns with renewable energy development from the extreme risk perspective, various fossil energy products especially oil and coal indeed exert a strong time-varying effect on renewable energy development. In the analysis of Dutta et al. (2020) and Liu et al. (2021), which studies the effect of uncertainty in energy sector firms on clean energy exchange traded funds (ETFs), the evidence of an asymmetric effect is presented. Kocaarslan and Soytas (2019) reveal significant asymmetric effects among the variables of interest, and suggest that the impacts of positive and negative changes in the oil prices, interest rates and technology stock prices on clean energy stock prices substantially vary in the short-run and long-run. Saeed et al. (2021) and Saeed et al. (2020) show that, unlike clean energy stocks, green bonds are negatively related to dirty energy assets, especially energy ETF. Park et al. (2020) report that green bonds exhibit asymmetric spilloverand behave differently from the stock market. This paper applies the data of China’s markets, examines the dynamic spillover effect and asymmetric connectedness between fossil energy, green financial and major traditional financial markets in China. It is worthy noting that our results could complement the limited literature on the dynamic spillover effect between China’s green financial and energy markets.
3 Methodology
To analyze the direction and the of the spillover effect across various markets, this paper adopts the spillover index of Diebold and Yilmaz (2012), which is developed based on both the generalized VAR and the forecast error variance decomposition procedure. Compared with the traditional model, the DY spillover index model can not only eliminate the dependence of the results on the lag order, but also reflect the risk spillover results of the whole market and in different markets. After continuous improvement, the current spillover index and complex network method are able to quantify the overall risk spillover of multiple markets as well as the direction and strength of mutual spillover between two markets, and further estimate the net risk spillover in different markets over time.
Firstly, the p-order VAR model of covariance stability can be mathematically described as
where xt represents the N-dimensional column vector of each market price yield and ɛ ∼ (0, ∑) is a vector of independently and identically distributed disturbances with zero and ∑ covariance matrix. Since φt(N × N) is the autoregressive coefficient matrix with respect to time t = 1, …, T, we thus have the moving average representation, given by
In Eq. 2, the coefficient matrix Ai is N × N, satisfying
where A0 is the N × N identity matrix and Ai = 0, i < 0.
Secondly, we present the forecast error variance decomposition procedure. It should be noted that the variance decomposition, which describes the proportion of the H-step prediction error variance of xi explained by variable xj especially when variable xi is externally affected, is often used to quantify the spillover effect of variable xj on xi, denoted as
where σjj is the standard deviation of the error term for the jth equation, and ei is the selection vector with one as the ith element, and zeros otherwise. Additionally, ∑ represents the covariance matrix of the vector of errors ɛ. Under the framework of the generalized variance decomposition, the impact is usually explained by the error distribution of historical observations, rather than normalizing the residual error. At this point, for variable xi, the sum of contributions of other variables to its prediction error variance is not equal to 1, which suggests
with
Furthermore, to examine the spillover effect transmits (receives) to (from) one particular variable, Diebold and Yilmaz (2012) define the directional spillover index through the matrix as
where the spillover “to others” index and the spillover “from others” index are denoted by
As implied by Eq. (9), when
which explains the proportional contribution of the spillover effect between N markets to the total forecast error variance and averages the off-diagonal elements.
Following Diebold and Yilmaz (2014, 2016), we rewrite the connectedness network as a weighted directed one, the element of which depicts pairwise directional connectedness,
4 Data and preliminary analysis
4.1 Data
Table 1 describes the variables used in the analysis. With the aim of presenting a synthetical analysis on China’s energy market, this paper divides the energy market into crude oil and coal. As for the energy futures market, we choose NanHua Crude Oil Index2 and CSI Coal Futures Index3 as the proxies. In specific, the former is calculated based on the closing price of Shanghai crude oil futures contract in China, which is the third largest trading volume crude oil futures and the Asian price benchmark. While the latter is a composite index on the basis of the coal-related commodity futures in China’s commodity futures markets.
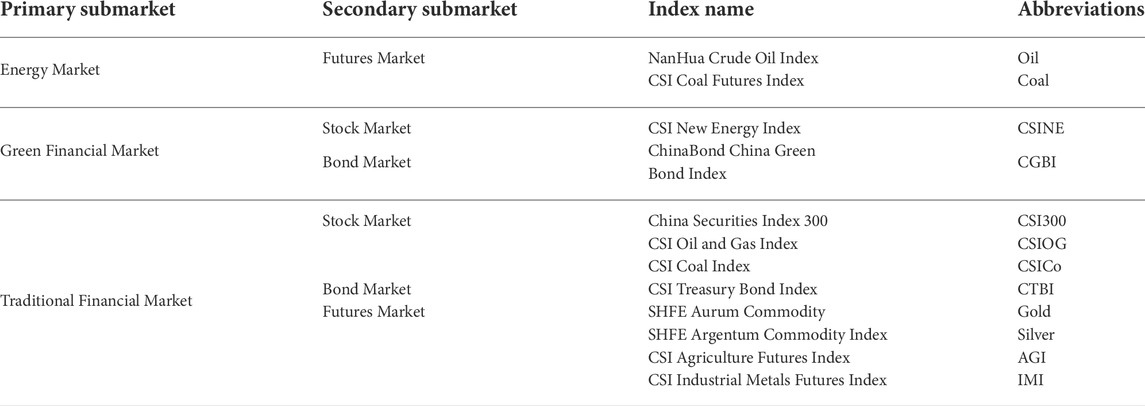
TABLE 1. Description of variables.
Also, we apply CSI New Energy Index and ChinaBond China Green Bond Index4 as the respective proxies of the green financial market. For the sake of comparison, we further introduce the traditional financial markets, such as stock market, commodity futures market and bond market. They namely China Securities Index 300 (CSI300), CSI Oil and Gas Index, CSI Coal Index and CSI Treasury Bond Index. Specifically, China Securities Index 300 (CSI300) is the most representative stock index in China, tracking the top 300 mainland listed firms in the Shanghai Stock Exchange and Shenzhen Stock Exchange, CSI Oil and Gas Index and CSI Coal Index track the performance of the listed companies running business in oil, gas and coal-related mining and processing respectively. CSI Treasury Bond Index is widely employed as the variable of Treasury in China-based studies. Besides, we consider four important commodity futures markets, namely SHFE Aurum Commodity Index5, SHFE Argentum Commodity Index, CSI Agriculture Futures Index and CSI Industrial Metals Futures Index. The sample data is obtained from the wind database and ranges from 26 March 2018 to 5 November 2021.
In addition, all the time series of prices are originally transferred to returns series by the logarithmic percentage difference, defined as
To quantify the asymmetric information spillovers, we divide the data of returns into positive returns and negative ones, expressed as
In Eqs 12, 13, r(+) and r(-) represent positive and negative returns respectively. It is obvious that the sum of the two returns shown in Eqs 12, 13 describes the overall returns.
4.2 Preliminary analysis
Table 2 reports the descriptive statistics for submarket returns. As shown in Table 2, all series of all markets have a positive average value close to 0, except oil futures and oil stock. Also, it can be seen that green stocks have the largest standard deviation value, whereas green bonds exhibit the lowest standard deviation values. From the kurtosis and skewness coefficients, we firstly find that the kurtosis values of all series are high, indicating they show the leptokurtic distributions. Secondly, we can see that the returns of the majority markets are negatively skewed, while green bonds and the treasury bonds are exceptions. Furthermore, the test of Jarque Bera rejects the null hypothesis of normal distributions. In terms of Dickey-Fuller (ADF) test, the results show clearly that all return series have stationarity at the 1% significance level. And the Ljung-Box test provides evidence of autocorrelations of returns series Table 3.
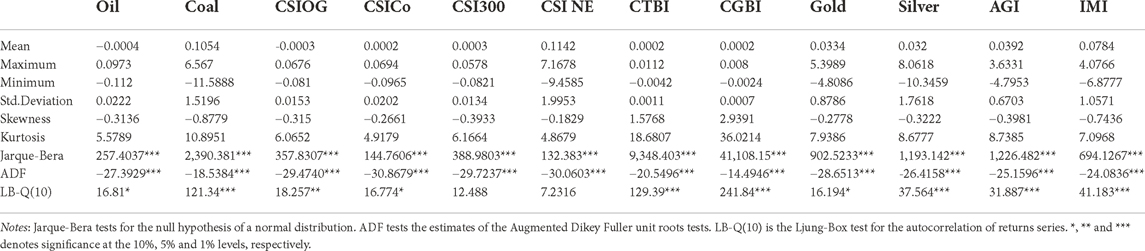
TABLE 2. Summary descriptive statistics for submarkets returns.
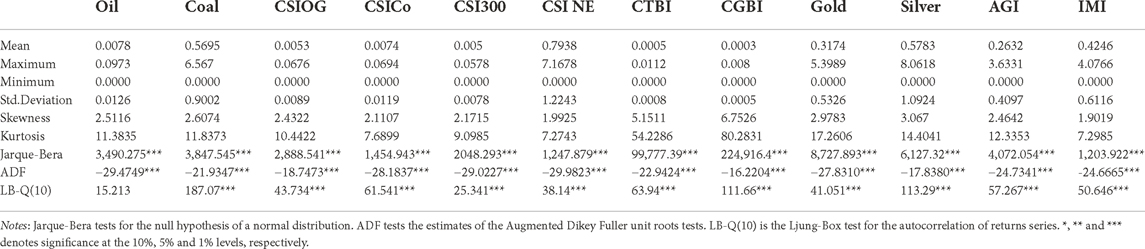
TABLE 3. Summary descriptive statistics for positive returns.
Tables 3, 4 present the descriptive statistical analyses of positive and negative returns. It is obvious that the negative returns series have more leptokurtic distributions compared with positive ones, whereas bond markets are the exception. Also, positive and negative returns series deviate from normal distributions and both are stationary.
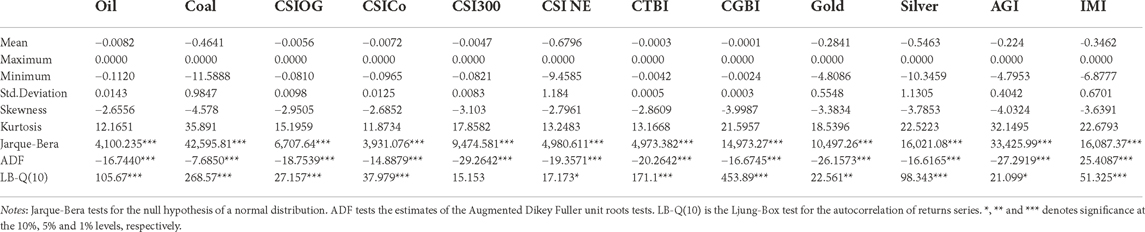
TABLE 4. Summary descriptive statistics for negative returns.
5 Empirical results
5.1 Total spillover index
Table 5 reports the estimates of the total static spillover matrix between the fossil energy markets, green financial markets and major traditional financial markets. Specifically, the diagonal of the matrix demonstrates the proportion of risk carried by each submarket. The off-diagonal row sums (termed “From”) and column sums (termed “To”) show the entire directional connectedness from the corresponding market and to that respectively. Moreover, the bottom right corner presents the total connectedness. The row “Net” exhibits the total sum of the net-bilateral directional spillover effect, where a negative value implies a net receiver while a positive one implies a net transmitter. In general, we may safely end up the conclusion that roughly 48.17% of the forecast error variances can be attributed to the return spillovers, indicating high interdependence between the returns of various markets.
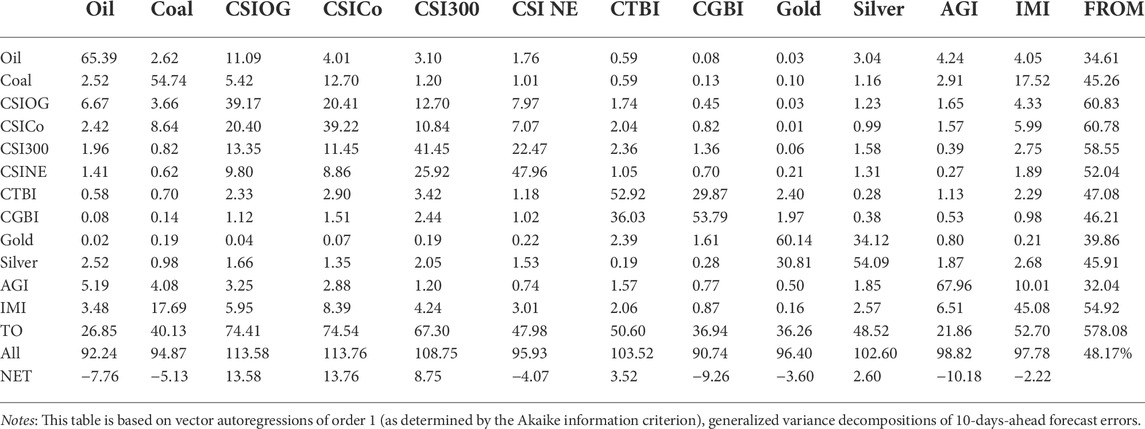
TABLE 5. Total return spillover matrix.
With respect to the directional connectedness, the main focus of this paper is the fossil energy markets as well as their spillover relationships with other markets, especially the green financial markets. Firstly, it can be seen that the fossil energy stock markets have strong spillover effects, among which the oil stock is the most interconnected with other markets, transmitting 74.41% shocks to others while receiving 60.83% shocks from others. Noticeably, in China’s fossil energy markets, there are significant return spillovers from the stock to the futures markets. Specifically, as for coal, the contribution of stocks to futures is 12.70%. Likewise the oil stocks contribute to 11.09% of the variation in the oil futures returns, and there is a negative net connectedness of oil futures relative to the system.
The beforementioned results are different from the findings of previous studies, claiming that oil shocks act as an important factor affecting stock market returns (Maghyereh et al., 2016; Ahmed and Huo, 2021). A possible explanation is that we choose a sample period ranging from 2018 to 2021, at that time, China was experiencing both shocks from the oil market and the COVID-19 pandemic. However, the oil demands depend on the development of the global economy (Unger, 2015), while stock markets are more responsive to the prosperity and recession of the global economy than oil (Kim and Ando, 2012). Moreover, as indicated by Yu et al. (2020), the oil market stimulates rapid and continual fluctuations in market dependences, which become manifest most acutely in the aftermath of the Financial Crisis of 2007–08, demonstrating the increasing interdependence between the oil and stock markets. Furthermore, the growing influence of China on the dynamics of these relationships, in the period following the Great Recession, presents evidence that it begins to assume an increasingly important role in global economic recovery. Through the dynamic analysis of the overview of China’s economic growth spillover effect, Wang and Zhang (2021) also confirmed that China’s huge economic scale after COVID-19 has played an important role in revitalizing the global economy. As a consequence, the spillover effect of China’s stock market could not be ignored.
Secondly, we find that energy futures show a relatively close relationship with agricultural and industrial metals commodities6. Particularly, the returns of coal are highly correlated with that of industrial metals, transmitting 17.69% shocks to industrial metals and receiving 17.52% shocks from them. In comparison, energy futures are weakly linked to green financial assets. Specifically, compared with traditional bonds, the green bond market is in weaker correlation with the fossil energy markets, receiving only 0.08% and 0.14% shocks from oil and coal, that is second only to gold. Green stocks also receive fewer shocks from energy futures than large-cap stocks. Therefore, we can conclude that, compared to other financial assets, green financial assets have weaker spillover effects with energy assets and may serve as an appropriate diversified portfolio instrument for energy futures, with green bonds having the greatest potential for performance.
Thirdly, the contributions of the two fossil energy assets to the two green assets are significantly different. For the green bond market, it receives more information from coal (0.14% from futures and 1.51% from stocks), while it receives a less portion of spillovers from oil (0.08% from futures and 1.12% from stocks). Nevertheless, for the green stock market, it receives more shocks from oil (1.41% from futures and 9.80% from stocks), rather than from coal (0.62% from futures and 8.86% from stocks). China’s special energy structure should play as the main reason for these results. In specific, China’s coal consumption accounts for 57% in 2020, and most of its carbon-based electricity comes from its huge coal reserves (Wang and Li, 2016). In the context of strong industrial demands as well as the low price of coal, coal becomes the backbone of China’s energy, so that its price rise would not affect investors’ sentiment causing them to switch to other assets. In terms of oil, China is the largest importer of oil with a high degree of overseas dependence and is susceptible to international factors. It is not difficult to explain our finding that the green stock market has a close link with oil instead of coal because there is a substitution relation between oil and new energy7.
Finally, we can observe that green bonds are closely related with treasury bonds, while green stocks are correlated with the large-cap stock market, implying that the two green financial markets are relatively independent8. Also, we find that green stocks are more associated with industrial metals than agricultural commodities. It implies that, compared to biofuels, the development of the new energy sector is more susceptible to changes in the cost of industrial metals.
To sum up, there are strong spillover effects in the fossil energy markets, including futures and stocks. It also indicates that diversification benefits are not provided within the same market. Compared with the traditional financial assets, green financial assets are more suitable for the fossil energy markets as risk diversification instruments.In China, green bonds receives fewer shocks from crude oil than coal, however, green stocks are precisely the opposite.
5.2 Asymmetric spillover analysis
In this subsection, we conduct the asymmetric spillover analysis by decomposing the returns into positive and negative ones. As shown in Tables 6, 7, we can generally find that the total connectedness in the positive returns system (39.20%) is less than that in the negative returns system (45.54%), thus providing evidence of asymmetry.
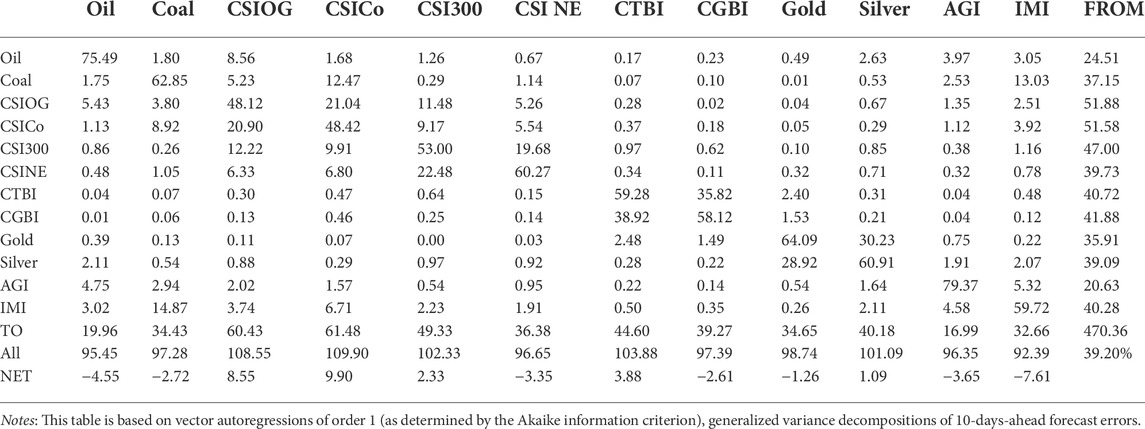
TABLE 6. Total spillover matrix for positive return.
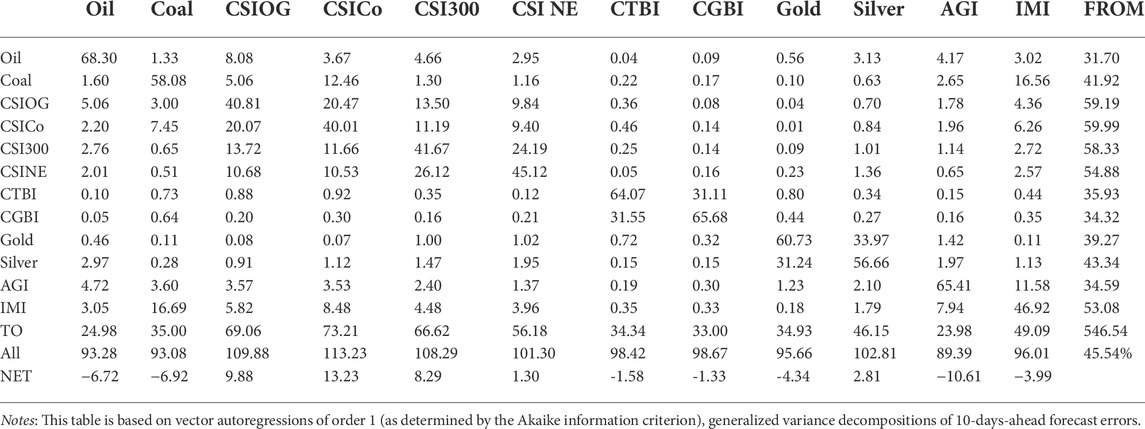
TABLE 7. Total spillover matrix for negative return.
Firstly, we put attention on the role of green financial assets in diversifying the risks of fossil energy stocks. Likewise, the stocks internally remain a strong spillover effect. However, the contribution from oil stocks and coal stocks to green bonds decrease to 0.20% and 0.30% respectively in the negative returns system. Generally, investors are more afraid of the risk of price decline, and the spillover effect of negative emotions between markets is stronger. Hence these results indicate that the green bond market is almost immune to the downside risk from the fossil energy stocks, which suggests that green bonds may present safe-haven characteristics as risk diversification instruments. As for green stocks, the downside risk of oil stocks and coal stocks on green stocks increase significantly (to 10.68% and 10.53% respectively), which reveals that the green stocks are not suitable as a dispersant of fossil energy stocks, but may play the role of a hedge.
Secondly, we compare the connectedness of various assets in different subsamples. To be specific, for the green bond market, the connectedness between gold and green bonds in the positive returns system is stronger and larger than that in the negative returns system, which means positive returns dominate. The reason behind these surprising results is that green bonds might have the same properties of stability as precious metals. Due to the safe-haven characteristic of green bonds, investors are likely to hover between them and stable precious metals in order to maximize returns and mitigate risks (Naeem et al., 2021a). For the green stock market, it can be seen that the spillovers from coal futures markets to the green stock market are relatively higher in the positive-returns-based subsamples (1.05%) than that in the negative-returns-based subsamples (0.51%). These observations further support our argument that green bonds can act as a safe haven against the fossil energy markets shocks and green stocks are suitable to be added into the portfolios of coal investors. However, agricultural and industrial metals commodities are more susceptible to the shocks of the fossil energy markets in the negative return system.
5.3 Dynamic spillover index
Employing a rolling window approach with a window length of 150, which helps revealing the intensified connectedness on account of specific events that occurred during these periods, Figure 2 demonstrates the time-varying symmetric spillover index between the mentioned markets. It is obvious that there are three phases in Figure 2. In specific, Phase I appears in the first 2 years after the listing of Shanghai crude oil futures with an increasing number of news about the trade conflicts between China and the United States In the time of high uncertainty, the connectedness index did not present a downward trend until the end of 2019. In Phase II, following a slight decline, the spillover reaches the maximum level in the beginning of 2020 which coincide with the outbreak of COVID-19 pandemic as well as oil recessionary periods, ranging from about 47% to almost 75%9. Generally, these markets are less interconnected in the absence of a crisis than during a crisis. As a result of China’s effective epidemic prevention and control, China’s economy has recovered steadily, and the investment environment has also become stable to a certain extent. It can be seen that the average connectedness of Phase III, that is, the year of 2021, is relatively lower than before. However, it still oscillates around 50% which may be explained by the volatility of fossil energy prices.
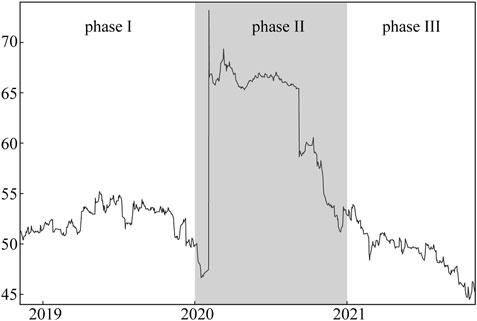
FIGURE 2. Rolling-windows estimation of total connectedness.
The role of each variable might change over time. Figure 3 presents the net spillovers of each market during the whole sample period. As demonstrated by Figure 3, we can firstly conclude that oil futures and green bonds are mostly net receivers, which may be explained by the fact that China’s crude oil markets are still emerging and susceptible to other markets. This seems to hold true for the green bond market as well. However, the COVID-19 recessionary periods bring a temporary spillover effect to other markets from the green bond market. It is not hard to understand that when global shocks occur, a large amount of capital will flow into the bond market due to investors’ risk aversion reasons. Therefore, unexpected changes in returns will lead to a sharp increase in the green bond market spillovers (Gao et al., 2021).
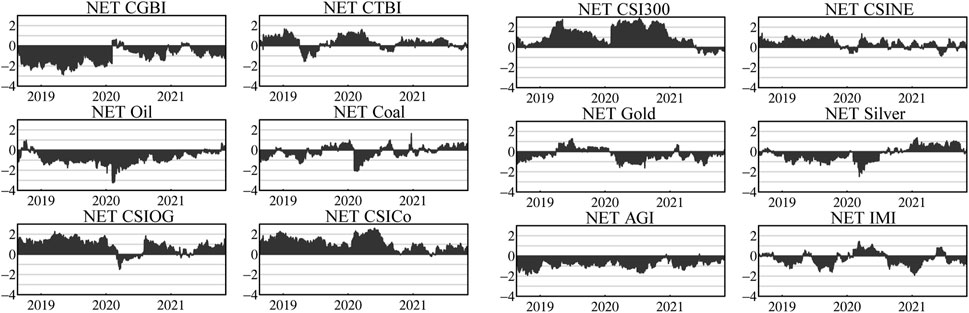
FIGURE 3. Rolling-windows estimation of net spillovers.
Secondly, it can be observed from Figure 3 that the spillovers in the coal futures market could vary over time. Since the second half of 2020, the abnormal coal prices, a large amount of capital have flown in, adding to the uncertainty in coal. Basically, the market serves as a net transmitter. The main reason is that the basic supply-demand relationship does not match, which widens the gap between supply and demand, causing the rise of the coal price, and the spillover effect of the coal futures market.
Thirdly, given the strong spillover characteristics of stock markets, the fossil energy stocks show the role of a net transmitter most of the time. Though the spillover effect of the oil slightly fell during the oil shock in 2020, the counterpart of coal increased to some extent because of the substitution effect. Considering China’s condition, the coal industry has resumed production quickly in early 2020, becoming an important energy guarantee to maintain social operation and economic development in China. Investors’ confidence in the coal sector (and coal prices) was less dominated by the pandemic (Tong et al., 2022). Yet the spillover level of green stocks is significantly lower compared with that of other stock markets. This finding indicates that as an emerging financial market tool, the green stock market is not mature enough. Hence, it is still necessary to be alert to the impact of risk contagion from other markets in times of extreme events.
Finally, we further study the dynamic and the asymmetric spillovers by separating the positive return connectedness and negative return connectedness respectively (see Figure 4). Apparently, the negative spillover is dominant during the COVID-19 pandemic, which is not surprising because investors were more sensitive to negative news during abnormal periods. It is consistent with our results presented in Section 5.2.
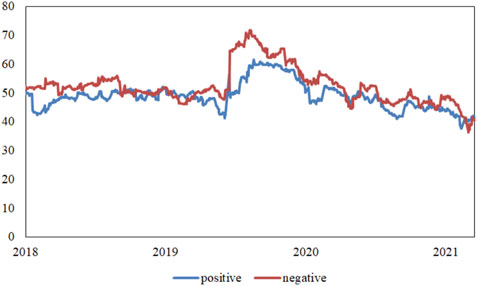
FIGURE 4. Rolling-windows estimation of positive and negative connectedness.
From the rolling-window analysis, we can end up with the conclusion that it is a necessity of prudent portfolio diversification during abnormal periods, such as the COVID-19 pandemic, and periods of rising or falling energy prices. In doing so, green bonds have been noticed by plenty of investors as a safe-haven asset. Also, green stocks seem to perform more calmly compared with the large-cap stock market, thus can be also regarded as risk diversification instruments.
5.4 Network connectedness
In this subsection, we further demonstrate interactive connectedness among markets in Figure 5 respectively, which could reveal more specific information about the roles of different markets in the process of risk transfer as well as the strength of risk transmissibility. In Figure 5, the size of a node indicates the magnitude of a net transmitter/receiver “To” or “From” other variables. And the color of the node in a receiver is yellow, while it is green in a transmitter. The edge colors rank the strength of the pairwise directional connectedness from blue (strongest) to purple, orange, and light yellow (weakest). Also, the arrow thickness reflects the strength of the pairwise directional connectedness.
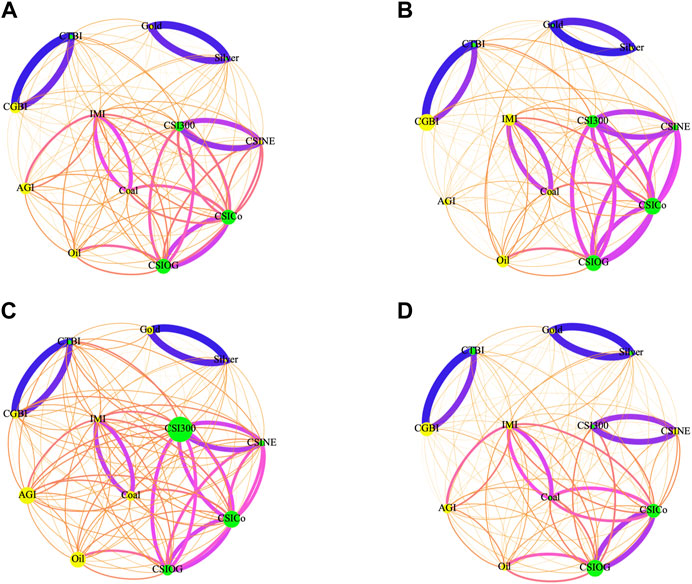
FIGURE 5. Network connectedness: (A) The whole sample period; (B) Pre-pandemic period; (C) The COVID-19 pandemic; (D) Post-pandemic period.
Figure 5A illustrates the pairwise directional connectedness during the whole sample period, echoing the results of Table 5. It is noted that there are fairly strong pairwise spillovers between similar markets. For instance, a strong connectedness can be observed between green bonds and treasury bonds, gold and silver, even inside the stock market (including four submarkets), though the connectedness is weaker for the latter. Interestingly, within the four stock submarkets, coal stocks appear to be more sensitive to oil stocks, while green stocks have a stronger interaction with large-cap stocks. These findings suggest that the time-domain spillover seems to be more relevant to the classification of markets, as an indication that gold and silver are classified as precious metals, coal and oil belong to fossil energy, however, green stocks still do not show a strong personality. Moreover, we also observe that industrial metals and coal have strong spillover effects in the futures markets, which is consistent with the conclusion in Section 5.1. Notably, the correlation between fossil energy futures and the stocks of respective sectors is stronger than they do with other kinds of futures. In other words, the risk transfer in the energy market is inherent. By contrast, there seems to be no strong cross-market spillover between precious mentals and other markets, and a similar pattern exists in green bonds, which is in line with the findings of Linh (2016); Reboredo (2018); Reboredo and Ugolini (2020), indicating that they can offer advantages against market risks.
We further explore the risk spillovers based on the following three subsample periods. In terms of the previous analysis, we divide the entire sample period into three phases. Frequent oil-price shocks and Sino-US trade war occurred in the first phase as shown in the Figure 5B (from 2018 to 2019). In this period, the internal spillovers of stock markets are significantly stronger compared with other markets. Influenced by the trade war, the stock market have become more compact, strengthening information transmissions across different sectors (Chen and Pantelous, 2021). Meanwhile, the uncertainty in the international crude oil markets has also led more investors to hover among different stock sectors for better portfolio hedging. While the rising tariff would exert a huge negative impact on China’s real economy, weakening the linkages of commodity markets. Due to the high exposures to the trade tensions, industrial metals receive more risk spillovers during the period.
Figure 5C displays the network connectedness during the COVID-19 pandemic period. It could be clearly found that the network is more complex implying that the magnitude of risk contagion effects has intensified. Significant negative social events increased risk spillovers across the financial system, especially the interaction between futures and stocks. In addition, risks spread from the single-market spillovers to cross-market spillovers and the net spillovers of the stock market increase. It is worthy noting that the spillovers of treasury bonds and stocks also present a rising tendency, but green bonds remain relatively slightly connected with the overall market.
In Figure 5D, with the domestic economy gradually recovering, the whole market in this period tends to be calm and the stock market spillovers return to a relatively stable state, whereas the energy markets remain a strong connectedness with each other. Different from the first two periods, the coal futures market transform into a net shock transmitter. This could be attributed to the sharp rise of coal prices. Practically, investors should pay special attention to capturing the volatility dynamics and preventing the financial risks associated with coal markets, especially based on the special structure of China’s energy supply. Meanwhile, we find that the green stock market transform into a net receiver, which means that it receives more shocks from other markets compared to what it transmits to other markets. The development of new energy is correlated with traditional fossil energy, therefore uncertainty in the green stock market is increasing during the time of coal prices rising.
5.5 Robustness check
To further verify the robustness of the above results, we refer to Diebold and Yilmaz (2009)’s method to change H-step-ahead forecasting days to 2, 5 and 8 days, meanwhile adjust rolling windows to 100 and 180 days, respectively. Figure 6 show the time-varying spillover graphs of the total spillover index under different forecast horizon and rolling window size combinations. It can be observed that the connectivity index was at a low level before the outbreak of COVID-19, and reached its maximum in early 2020. There are comparable trends, indicating that the main empirical results are stable.
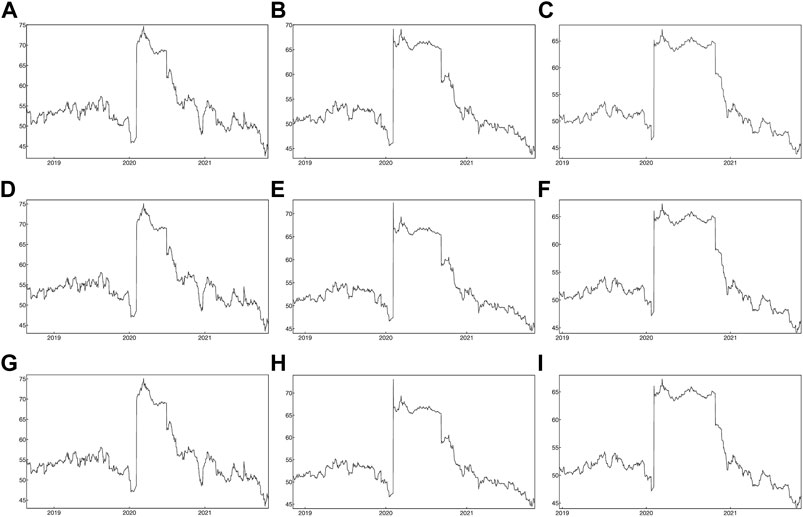
FIGURE 6. Robustness checks: (A) 2-days forecast horizon and 100-days rolling windows; (B) 2-days forecast horizon and 150-days rolling windows; (C) 2-days forecast horizon and 180-days rolling windows; (D) 5-days forecast horizon and 100-days rolling windows; (E) 5-days forecast horizon and 150-days rolling windows; (F) 5-days forecast horizon and 180-days rolling windows; (G) 8-days forecast horizon and 100-days rolling windows; (H) 8-days forecast horizon and 150-days rolling windows; (I) 8-days forecast horizon and 180-days rolling windows.
6 Conclusion
This article employs the spillover index model developed by Diebold and Yilmaz, to analyze the dynamic spillover and asymmetric connectedness between the fossil energy markets and the green financial markets based on the data collected in China. As for the fossil energy markets, this papers takes crude oil and coal as the representatives. With respect to the green financial markets, this paper mainly studies the risk management strategy with the instruments of both green bonds and green stocks. The main findings of this paper can be summarized as follows.
Firstly, by conducting the static spillover analysis, a weak spillover effect between the fossil energy markets and the green financial markets is confirmed. To be specific, green bonds receive few return shocks from crude oil, while green stocks virtually unaffected by coal. However, we could observe strong connectedness within the fossil energy markets.
Secondly, this paper unveils the connectedness of markets over time through the dynamic spillover analysis. Dynamic spillovers have increased significantly since the global COVID-19 pandemic, indicating a contagion effect. Besides, we find that oil as well as green bonds usually act as net receivers, while fossil energy stocks and new energy stocks act as net transmitters during most of the time.
Thirdly, the asymmetric spillover is also considered. Compared with positive spillovers, negative spillovers dominate around 2020. Interestingly, the spillovers from fossil energy stocks to green bonds are significantly weaker in the negative returns system. Similar to the safe-haven characteristics, green bonds are also in a relatively weak correlation with fossil energy markets. Meanwhile, green stocks are more sensitive to positive coal futures shocks than negative ones.
Finally, through the network connectedness analysis, we find that the assets within the same class are more connected to each other. Moreover, by dividing the sample period into three phases, we document that the intensity of network connectedness of coal futures markets keeps rising in the year of 2021 with China’s coal prices going up, during which period the coal futures markets start to be a net transmitter rather than a net receiver. In the meantime, the green stock market becomes a net receiver. These results indicate that the spillover relationship of coal markets are experiencing increasing uncertainty in the wake of the COVID-19 pandemic.
Our empirical findings have practical implications for both investors and the energy-related policymakers. As for investors, during the time of rising risks in the energy markets, combining large proportions of crude oil, coal and the related stocks into one portfolio is certainly undesirable. Otherwise, green assets provide opportunities for portfolio diversification, helping investors reducing the risk in their fossil energy investments. To be specific, green bonds are more suitable for diversifying the risks of crude oil, while green stocks are more appropriate for diversifying the risks of coal. In particular, due to the safe-haven characteristics of green bonds, it’s a wise strategy for investors to hold them in time of crisis. Furthermore, the strong connectedness between green and energy stocks in negative returns reveals a hedging possibility for investors. As for policymakers, they are suggested to be alert to the impact of energy market uncertainty on financial markets, not only focusing on crude oil but also on coal. Also, policymakers should emphasize the role of green financial markets in stabilizing energy markets, and carry out environmental policies to support the development of green financial markets. This will encourage more capital to flow into the energy sector to facilitate energy transition in China.
To sum up, this paper provides more comprehensive advice on the risk management of China’s energy markets. Moreover, our results unveil the dynamic and the asymmetric connectedness between China’s various markets during the periods of the COVID-19 pandemic and that of the volatile fossil energy prices.Since the current study mainly focuses on the spillovers between China’s energy and green financial markets, therefore quantifying the market correlations between fossil energy and the several green financial assets, we have to admit that there are limitations. Future reseach venues may investigate the network connectedness of green-fossil energy portfolio to construct optimal portfolios and downside risk reduction. On the basis of this paper, it would be also of interest to analyze the risk transmission mechanism between these markets, as well as the potential driving facrots of spillovers between them.
Data availability statement
The original contributions presented in the study are included in the article/Supplementary Material, further inquiries can be directed to the corresponding author.
Author contributions
JD: Conceptualization, Supervision. SG: Methodology, Software, Writing-Original draft preparation. HZ: Visualization, Writing-Reviewing and Editing. XX: Validation, Writing-Reviewing and Editing, Project Administration. CL: Funding acquisition, Project Administration.
Funding
Fundamental Research Funds for the Central Universities (No. 2019RW23 & BLX202121); The Double first-class construction project of Beijing Forestry University (No. 2022XKJS0305); Fundamental Research Funds for the Central Universities—Beijing Forestry University Science and Technology Innovation project (No. 2021STWM23); The Ministry of education of humanities and social science project (No. 20YJA790059); National Social Science Fund of China (No. 20FGLB022 & 19BGL052).
Conflict of interest
The authors declare that the research was conducted in the absence of any commercial or financial relationships that could be construed as a potential conflict of interest.
Publisher’s note
All claims expressed in this article are solely those of the authors and do not necessarily represent those of their affiliated organizations, or those of the publisher, the editors and the reviewers. Any product that may be evaluated in this article, or claim that may be made by its manufacturer, is not guaranteed or endorsed by the publisher.
Footnotes
1Specifically, it is verified that the magnitude and direction of spillovers among different oil prices could change over time (Dutta et al., 2019).
2Established in 1996, Nanhua Futures Co., Ltd. is a leading integrated financial service provider in China, providing high-quality integrated financial services for domestic and overseas customers.
3China Securities Index Co., Ltd. (“China Securities Index Company”) is one of the most influential index suppliers in China, founded in August 2005, who is currently a financial market index provider jointly funded by Shanghai and Shenzhen stock exchanges.
4Although there are several other green bond indexes, i.e., ChinaBond China Green Bond Select Index, ChinaBond China Climate-Aligned Bond Index. They all belong to ChinaBond index, the volatility difference of which is less than 0.0015.
5SHFE refers to Shanghai Futures Exchange, which is one of the major futures exchanges in China.
6These results agree with the statements that the market co-movements between energy and agricultural commodities have been increasing in recent years whose returns are highly associated Nicola et al. (2016).
7According to the conclusion of Oberndorfer (2009), rising oil prices are always regarded as one of the factors stimulating new energy investment.
8The results suggest that using Chinese data also bears out Pham and Nguyen (2021)’s arguments.
9This finding is in consistent with Gao et al. (2021); Kang et al. (2019), who found a high degree of financial contagion between markets during the global health crisis and oil price plunged.
References
Ahmad, W. (2017). On the dynamic dependence and investment performance of crude oil and clean energy stocks. Res. Int. Bus. Finance 42, 376–389. doi:10.1016/j.ribaf.2017.07.140
Ahmed, A. D., and Huo, R. (2021). Volatility transmissions across international oil market, commodity futures and stock markets: Empirical evidence from China. Energy Econ. 93, 104741. doi:10.1016/j.eneco.2020.104741
Batten, J. A., Kinateder, H., Szilagyi, P. G., and Wagner, N. F. (2017). Can stock market investors hedge energy risk? evidence from Asia. Energy Econ. 66, 559–570. doi:10.1016/j.eneco.2016.11.026
Batten, J. A., Kinateder, H., Szilagyi, P. G., and Wagner, N. F. (2018). Addressing cop21 using a stock and oil market integration index. Energy Policy 116, 127–136. doi:10.1016/j.enpol.2018.01.048
Batten, J. A., Brzeszczynski, J., Ciner, C., Lau, M. C., Lucey, B., and Yarovaya, L. (2019). Price and volatility spillovers across the international steam coal market. Energy Econ. 77, 119–138. Energy Finance 2017. doi:10.1016/j.eneco.2018.12.002
Bildirici, M. E., and Turkmen, C. (2015). Nonlinear causality between oil and precious metals. Resour. Policy 46, 202–211. doi:10.1016/j.resourpol.2015.09.002
Bouri, E., Iqbal, N., and Klein, T. (2022). Climate policy uncertainty and the price dynamics of green and Brown energy stocks. Finance Res. Lett. 47, 102740. doi:10.1016/j.frl.2022.102740
Chang, T.-H., and Su, H.-M. (2010). The substitutive effect of biofuels on fossil fuels in the lower and higher crude oil price periods. Energy 35, 2807–2813. doi:10.1016/j.energy.2010.03.006
Chen, Y., and Pantelous, A. A. (2021). The u.s.-China trade conflict impacts on the Chinese and u.s. stock markets: A network-based approach. Finance Res. Lett. 46, 102486. doi:10.1016/j.frl.2021.102486
Chen, Y., and Zhao, Z. J. (2021). The rise of green bonds for sustainable finance: global standards and issues with the expanding Chinese market. Curr. Opin. Environ. Sustain. 52, 54–57. doi:10.1016/j.cosust.2021.06.013
Chkili, W., Aloui, C., and Nguyen, D. K. (2014). Instabilities in the relationships and hedging strategies between crude oil and us stock markets: Do long memory and asymmetry matter? J. Int. Financ. Mark. Inst. Money 33, 354–366. doi:10.1016/j.intfin.2014.09.003
Curtin, J., McInerney, C., Ó Gallachóir, B., Hickey, C., Deane, P., and Deeney, P. (2019). Quantifying stranding risk for fossil fuel assets and implications for renewable energy investment: A review of the literature. Renew. Sustain. Energy Rev. 116, 109402. doi:10.1016/j.rser.2019.109402
Diebold, F. X., and Yilmaz, K. (2009). Measuring financial asset return and volatility spillovers, with application to global equity markets. Econ. J. 119, 158–171. doi:10.1111/j.1468-0297.2008.02208.x
Diebold, F. X., and Yilmaz, K. (2012). Better to give than to receive: Predictive directional measurement of volatility spillovers. Int. J. Forecast. 28, 57–66. doi:10.1016/j.ijforecast.2011.02.006
Diebold, F. X., and Yilmaz, K. (2014). On the network topology of variance decompositions: Measuring the connectedness of financial firms. SSRN J. 182, 119–134. doi:10.2139/ssrn.2316285
Diebold, F. X., and Yilmaz, K. (2016). Trans-atlantic equity volatility connectedness: Us and European financial institutions, 2004–2014. J. Financ. Econ. 14, nbv021–127. doi:10.1093/jjfinec/nbv021
Dutta, A., Bouri, E., Vo, X. V., and Saeed, T. (2020). Impact of energy sector volatility on clean energy assets. Energy 212, 118657. doi:10.1016/j.energy.2020.118657
Dutta, A., Bouri, E., Roubaud, D., and Das, D. (2019). Assessment and optimization of clean energy equity risks and commodity price volatility indexes: Implications for sustainability. J. Clean. Prod. 243. doi:10.1016/j.jclepro.2019.118669
Elgammal, M. M., Ahmed, W. M., and Alshami, A. (2021). Price and volatility spillovers between global equity, gold, and energy markets prior to and during the Covid-19 pandemic. Resour. Policy 74, 102334. doi:10.1016/j.resourpol.2021.102334
Floros, C., and Galyfianakis, G. (2020). Bubbles in crude oil and commodity energy index: New evidence. Energies (Basel). 13, 6648. doi:10.3390/en13246648
Foglia, M., and Angelini, E. (2020). Volatility connectedness between clean energy firms and crude oil in the Covid-19 era. Sustainability 12, 9863. doi:10.3390/su12239863
Fowowe, B. (2016). Do oil prices drive agricultural commodity prices? evidence from South Africa. Energy 104, 149–157. doi:10.1016/j.energy.2016.03.101
Gao, Y., Li, Y., and Wang, Y. (2021). Risk spillover and network connectedness analysis of China’s green bond and financial markets: Evidence from financial events of 2015–2020. North Am. J. Econ. Finance 57, 101386. doi:10.1016/j.najef.2021.101386
Ghorbel, A., and Trabelsi, A. (2014). Energy portfolio risk management using time-varying extreme value copula methods. Econ. Model. 38, 470–485. doi:10.1016/j.econmod.2013.12.023
Harri, A., Nalley, L., and Hudson, D. (2009). The relationship between oil, exchange rates, and commodity prices. J. Agric. Appl. Econ. 41, 501–510. doi:10.1017/s1074070800002959
He, J., Li, Z., Zhang, X., Wang, H., Dong, W., Du, E., et al. (2022). Towards carbon neutrality: A study on China’s long-term low-carbon transition pathways and strategies. Environ. Sci. Ecotechnol. 9, 100134. doi:10.1016/j.ese.2021.100134
Henriques, I., and Sadorsky, P. (2008). Oil prices and the stock prices of alternative energy companies. Energy Econ. 30, 998–1010. doi:10.1016/j.eneco.2007.11.001
Hoang, A. T., Nižetić, Sandro, Olcer, A. I., Ong, H. C., Chen, W.-H., Chong, C. T., et al. (2021). Impacts of Covid-19 pandemic on the global energy system and the shift progress to renewable energy: Opportunities, challenges, and policy implications. Energy Policy 154, 112322. doi:10.1016/j.enpol.2021.112322
IEA (2020). China’s net-zero ambitions: the next five-year plan will be critical for an accelerated energy transition. [Dataset]. Available at: https://www.iea.org/commentaries/china-s-net-zero-ambitions-the-next-five-year-plan-will-be-critical-for-an-accelerated-energy-transition. (Accessed October 29, 2020).
Ji, Q., and Fan, Y. (2016). Evolution of the world crude oil market integration: A graph theory analysis. Energy Econ. 53, 90–100. Energy Markets. doi:10.1016/j.eneco.2014.12.003
Ji, Q., and Zhang, D. (2019). China’s crude oil futures: Introduction and some stylized facts. Finance Res. Lett. 28, 376–380. doi:10.1016/j.frl.2018.06.005
Ji, Q., Bouri, E., Roubaud, D., and Shahzad, S. J. H. (2018a). Risk spillover between energy and agricultural commodity markets: A dependence-switching covar-copula model. Energy Econ. 75, 14–27. doi:10.1016/j.eneco.2018.08.015
Ji, Q., Liu, B.-Y., Nehler, H., and Uddin, G. S. (2018b). Uncertainties and extreme risk spillover in the energy markets: A time-varying copula-based covar approach. Energy Econ. 76, 115–126. doi:10.1016/j.eneco.2018.10.010
Jiang, M., Gao, X., Guan, Q., Hao, X., and An, F. (2019). The structural roles of sectors and their contributions to global carbon emissions: A complex network perspective. J. Clean. Prod. 208, 426–435. doi:10.1016/j.jclepro.2018.10.127
Junttila, J., Pesonen, J., and Raatikainen, J. (2018). Commodity market based hedging against stock market risk in times of financial crisis: The case of crude oil and gold. SSRN J. 56, 255–280. doi:10.2139/ssrn.3024668
Kang, S. H., Maitra, D., Dash, S. R., and Brooks, R. (2019). Dynamic spillovers and connectedness between stock, commodities, bonds, and vix markets. Pacific-Basin Finance J. 58, 101221. doi:10.1016/j.pacfin.2019.101221
Khalfaoui, R., Boutahar, M., and Boubaker, H. (2015). Analyzing volatility spillovers and hedging between oil and stock markets: Evidence from wavelet analysis. Energy Econ. 49, 540–549. doi:10.1016/j.eneco.2015.03.023
Kim, P., and Ando, T. (2012). Oil and metal price movements and bric macro-economy: an empirical analysis. Int. J. Bus. Glob. 8, 187–206. doi:10.1504/IJBG.2012.045395
Kocaarslan, B., and Soytas, U. (2019). Asymmetric pass-through between oil prices and the stock prices of clean energy firms: New evidence from a nonlinear analysis. Energy Rep. 5, 117–125. doi:10.1016/j.egyr.2019.01.002
Koop, G., Pesaran, M., and Potter, S. M. (1996). Impulse response analysis in nonlinear multivariate models. J. Econ. 74, 119–147. doi:10.1016/0304-4076(95)01753-4
Li, X., and Wei, Y. (2018). The dependence and risk spillover between crude oil market and China stock market: New evidence from a variational mode decomposition-based copula method. Energy Econ. 74, 565–581. doi:10.1016/j.eneco.2018.07.011
Lin, B., and Chen, Y. (2019). Dynamic linkages and spillover effects between cet market, coal market and stock market of new energy companies: A case of beijing cet market in China. Energy 172, 1198–1210. doi:10.1016/j.energy.2019.02.029
Linh, P. (2016). Is it risky to go green? a volatility analysis of the green bond market. J. Sustain. Finance Invest. 6, 263–291. doi:10.1080/20430795.2016.1237244
Liu, X., Bouri, E., and Jalkh, N. (2021). Dynamics and determinants of market integration of green, clean, dirty energy investments and conventional stock indices. Front. Environ. Sci. 9, 575. doi:10.3389/fenvs.2021.786528
Liu, W., Ma, Q., and Liu, X. (2022). Research on the dynamic evolution and its influencing factors of stock correlation network in the Chinese new energy market. Finance Res. Lett. 45, 102138. doi:10.1016/j.frl.2021.102138
Maghyereh, A. I., Awartani, B., and Bouri, E. (2016). The directional volatility connectedness between crude oil and equity markets: New evidence from implied volatility indexes. Energy Econ. 57, 78–93. doi:10.1016/j.eneco.2016.04.010
Naeem, M. A., Adekoya, O. B., and Oliyide, J. A. (2021a). Asymmetric spillovers between green bonds and commodities. J. Clean. Prod. 314, 128100. doi:10.1016/j.jclepro.2021.128100
Naeem, M. A., Bouri, E., Costa, M. D., Naifar, N., and Shahzad, S. J. H. (2021b). Energy markets and green bonds: A tail dependence analysis with time-varying optimal copulas and portfolio implications. Resour. Policy 74, 102418. doi:10.1016/j.resourpol.2021.102418
Narayan, P. K., Narayan, S., and Zheng, X. (2010). Gold and oil futures markets: Are markets efficient? Appl. Energy 87, 3299–3303. doi:10.1016/j.apenergy.2010.03.020
Nazlioglu, S., and Soytas, U. (2012). Oil price, agricultural commodity prices, and the dollar: A panel cointegration and causality analysis. Energy Econ. 34, 1098–1104. doi:10.1016/j.eneco.2011.09.008
Nazlioglu, S., Erdem, C., and Soytas, U. (2013). Volatility spillover between oil and agricultural commodity markets. Energy Econ. 36, 658–665. doi:10.1016/j.eneco.2012.11.009
Nazlioglu, S. (2011). World oil and agricultural commodity prices: Evidence from nonlinear causality. Energy Policy 39, 2935–2943. doi:10.1016/j.enpol.2011.03.001
Nicola, F. de, Pace, P. D., and Hernandez, M. A. (2016). Co-movement of major energy, agricultural, and food commodity price returns: A time-series assessment. Energy Econ. 57, 28–41. doi:10.1016/j.eneco.2016.04.012
Oberndorfer, U. (2009). Energy prices, volatility, and the stock market: Evidence from the eurozone. Energy Policy 37, 5787–5795. doi:10.1016/j.enpol.2009.08.043
Park, D., Park, J., and Ryu, D. (2020). Volatility spillovers between equity and green bond markets. Sustainability 12, 3722. doi:10.3390/su12093722
Pesaran, H., and Shin, Y. (1998). Generalized impulse response analysis in linear multivariate models. Econ. Lett. 58, 17–29. doi:10.1016/s0165-1765(97)00214-0
Pham, L., and Nguyen, C. P. (2021). Asymmetric tail dependence between green bonds and other asset classes. Glob. Finance J. 50, 100669. doi:10.1016/j.gfj.2021.100669
Reboredo, J. C., and Ugolini, A. (2020). Price connectedness between green bond and financial markets. Econ. Model. 88, 25–38. doi:10.1016/j.econmod.2019.09.004
Reboredo, J. C., Rivera-Castro, M. A., and Ugolini, A. (2017). Wavelet-based test of co-movement and causality between oil and renewable energy stock prices. Energy Econ. 61, 241–252. doi:10.1016/j.eneco.2016.10.015
Reboredo, J. C. (2013). Is gold a hedge or safe haven against oil price movements? Resour. Policy 38, 130–137. doi:10.1016/j.resourpol.2013.02.003
Reboredo, J. C. (2018). Green bond and financial markets: Co-movement, diversification and price spillover effects. Energy Econ. 74, 38–50. doi:10.1016/j.eneco.2018.05.030
Sadorsky, P. (2012). Correlations and volatility spillovers between oil prices and the stock prices of clean energy and technology companies. Energy Econ. 34, 248–255. doi:10.1016/j.eneco.2011.03.006
Sadorsky, P. (2014). Modeling volatility and correlations between emerging market stock prices and the prices of copper, oil and wheat. Energy Econ. 43, 72–81. doi:10.1016/j.eneco.2014.02.014
Saeed, T., Bouri, E., and Tran, D. K. (2020). Hedging strategies of green assets against dirty energy assets. Energies 12, 3141. doi:10.3390/en13123141
Saeed, T., Alsulami, H., and Bouri, E. (2021). Extreme return connectedness and its determinants between clean/green and dirty energy investments. Energy Econ. 96, 105017. doi:10.1016/j.eneco.2020.105017
Shahzad, S. J. H., Rehman, M. U., and Jammazi, R. (2019). Spillovers from oil to precious metals: Quantile approaches. Resour. Policy 61, 508–521. doi:10.1016/j.resourpol.2018.05.002
Sun, Q., Gao, X., An, H., Guo, S., Liu, X., and Wang, Z. (2021). Which time-frequency domain dominates spillover in the Chinese energy stock market? Int. Rev. Financ. Anal. 73, 101641. doi:10.1016/j.irfa.2020.101641
Tang, X., McLellan, B. C., Snowden, S., Zhang, B., and Höök, M. (2015). Dilemmas for China: Energy, economy and environment. Sustainability 7, 5508–5520. doi:10.3390/su7055508
Tong, Y., Wan, N., Dai, X., Bi, X., and Wang, Q. (2022). China’s energy stock market jumps: To what extent does the Covid-19 pandemic play a part? Energy Econ. 109, 105937. doi:10.1016/j.eneco.2022.105937
UNFCCC (2015). Adoption of the paris agreement. [Dataset]. Paris, France: Paris Agreement. decision 1/cp.21.
Unger, S. (2015). The impact of e-car deployment on global crude oil demand. OPEC Energy Rev. 39, 402–417. doi:10.1111/opec.12067
Wang, Q., and Li, R. (2016). Journey to burning half of global coal: Trajectory and drivers of China’s coal use. Renew. Sustain. Energy Rev. 58, 341–346. doi:10.1016/j.rser.2015.12.104
Wang, X., and Wang, Y. (2019). Volatility spillovers between crude oil and Chinese sectoral equity markets: Evidence from a frequency dynamics perspective. Energy Econ. 80, 995–1009. doi:10.1016/j.eneco.2019.02.019
Wang, Q., and Zhang, F. (2021). What does the China’s economic recovery after Covid-19 pandemic mean for the economic growth and energy consumption of other countries? J. Clean. Prod. 295, 126265. doi:10.1016/j.jclepro.2021.126265
Xia, T., Ji, Q., Zhang, D., and Han, J. (2019). Asymmetric and extreme influence of energy price changes on renewable energy stock performance. J. Clean. Prod. 241, 118338. doi:10.1016/j.jclepro.2019.118338
Yu, L., Zha, R., Stafylas, D., He, K., and Liu, J. (2020). Dependences and volatility spillovers between the oil and stock markets: New evidence from the copula and var-bekk-garch models. Int. Rev. Financ. Anal. 68, 101280. doi:10.1016/j.irfa.2018.11.007
Yu, C.-H., Wu, X., Zhang, D., Chen, S., and Zhao, J. (2021). Demand for green finance: Resolving financing constraints on green innovation in China. Energy Policy 153, 112255. doi:10.1016/j.enpol.2021.112255
Zhu, P., Tang, Y., Wei, Y., and Lu, T. (2021). Multidimensional risk spillovers among crude oil, the us and Chinese stock markets: Evidence during the Covid-19 epidemic. Energy 231, 120949. doi:10.1016/j.energy.2021.120949
Keywords: risk spillovers, fossil energy, green financial markets, asymmetric connectedness, variance decomposition
Citation: Deng J, Guan S, Zheng H, Xing X and Liu C (2022) Dynamic spillovers and asymmetric connectedness between fossil energy and green financial markets: Evidence from China. Front. Energy Res. 10:986341. doi: 10.3389/fenrg.2022.986341
Received: 05 July 2022; Accepted: 12 September 2022;
Published: 10 November 2022.
Edited by:
Bamidele Victor Ayodele, University of Technology Petronas, MalaysiaReviewed by:
Elie Bouri, Lebanese American University, LebanonSamuel Sunday Idowu, Caleb University, Nigeria
Copyright © 2022 Deng, Guan, Zheng, Xing and Liu. This is an open-access article distributed under the terms of the Creative Commons Attribution License (CC BY). The use, distribution or reproduction in other forums is permitted, provided the original author(s) and the copyright owner(s) are credited and that the original publication in this journal is cited, in accordance with accepted academic practice. No use, distribution or reproduction is permitted which does not comply with these terms.
*Correspondence: Xiaoyun Xing, eHl4aW5nQGJqZnUuZWR1LmNu