 Zhiyong Yuan1
 Zuogang Guo
95% of researchers rate our articles as excellent or good
Learn more about the work of our research integrity team to safeguard the quality of each article we publish.
Find out more
ORIGINAL RESEARCH article
Front. Energy Res. , 11 January 2023
Sec. Smart Grids
Volume 10 - 2022 | https://doi.org/10.3389/fenrg.2022.985623
This article is part of the Research Topic Operation and Control in Smart Electric Power Systems: Methods and Applications View all 5 articles
With the increasing penetration of renewable energy in the distribution network, however, due to the randomness and volatility of renewable energy output, the large-scale grid connection of renewable energy will bring challenges to the safe and stable operation of the distribution network. The calculation of renewable energy hosting capacity of distribution network is not only beneficial to the construction of renewable clean and low-carbon power system, but also of great significance for the planners of power grid to carry out renewable energy planning. Renewable energy hosting capacity calculation involves many constraints, including a large number of nonlinear constraints, and the hosting capacity calculation model is very complex, lacking efficient solution algorithm. Aiming at the existing problems, the calculation model of renewable energy hosting capacity of distribution network is established based on full consideration of power quality, relay protection and thermal stability test. A multi strategy improved adaptive manta ray foraging optimization algorithm (MSAMRFO) is proposed to solve the hosting capacity model. MSAMRFO algorithm adopts half uniform initialization strategy, adaptive variable step size strategy and local convergence mutation strategy to improve manta ray foraging optimization algorithm (MRFO) algorithm. Finally, the effectiveness of the proposed model and method is verified by an example. The example shows that the MRFO algorithm after multi strategy improvement has outstanding effect both in convergence speed and algorithm stability.
With the continuous development of human society, carbon emission has become a global issue restricting social development. Power energy industry is an important part of carbon emissions, and large-scale planning of renewable energy access to power grid has become an inevitable trend. Wind power and photovoltaic power, as two main forms of distributed power supply, have huge potential for development and increased installed capacity year by year. However, distributed wind power and distributed photovoltaic output power are greatly affected by external environment, which not only changes the distribution of power flow (Li et al., 2013), but also seriously threatens the power quality of distribution network, causes voltage deviation and voltage fluctuation, and affects the safe and stable operation of power system. Therefore, it is necessary to calculate the renewable energy hosting capacity of distribution network before planning and constructing renewable energy in distribution network.
The renewable energy hosting capacity, that is, the access capacity limit, has been repeatedly mentioned in important reports of various international organizations recently. Most literatures define it as the maximum capacity limit that renewable energy can access the power grid without violating the technical indicators of normal system operation (Dong et al., 2019). There are many factors affecting the renewable energy hosting capacity of distribution network, such as voltage deviation, voltage fluctuation, thermal stability check, short circuit current, etc. In the electric power industry, the research on assessment of renewable energy hosting capacity has been carried out very early. Many green energy sources, including solar, wind, hydraulic and methane, are connected to the distribution network through distributed generation technology in the power grid. In recent years, researchers have proposed many methods to evaluate the renewable energy hosting capacity of power grid. Literature (Hu et al., 2006) takes static voltage index as technical limit to evaluate, takes maximizing hosting capacity and satisfying voltage deviation constraint as optimization objectives of upper and lower layers respectively, and establishes two-layer optimization model to calculate. Literature (Wang et al., 2010) considers relay protection as a technical constraint for hosting capacity evaluation, and the evaluation method proposed includes the effects of protective action and fault current of distribution network. Literature (Lei et al., 2008) considers the inter phase short-circuit current as a constraint to evaluate the renewable energy hosting capacity, and establishes a corresponding two-level optimization model to solve it. Literature (Zhong et al., 2014) takes harmonic restraint into consideration to evaluate the hosting capacity of renewable energy. By analyzing the injection mechanism of harmonic current of renewable energy into power grid, the corresponding restraint conditions of each harmonic after renewable energy is determined and the hosting capacity of renewable energy is evaluated. Literature (Zheng et al., 2014) takes fault location as constraints to evaluate the renewable energy hosting capacity and proposes a renewable energy maximum access capacity calculation method to ensure the applicability of the traditional fault interval location scheme. It distinguishes the minimum short-circuit current provided by the original network power source from the maximum short-circuit current provided by the renewable energy so as to ensure that the traditional fault location scheme can still be used after the renewable energy is connected. Literature (Zou et al., 2016) introduced voltage fluctuation into restraint condition to evaluate hosting capacity. By giving approximate calculation formula of voltage fluctuation, voltage fluctuation caused by renewable energy at each node can be obtained without simulation. Literature (Vovos et al., 2005; Vovos and Bialek, 2134; Dent et al., 2010) proposed an analysis method for access capacity of renewable energy in power grid based on Optimal Power Flow (OPF) model, and verified the rationality and effectiveness of the method by an actual network example. However, these models consider renewable energy power output and grid load as a single value, ignoring changes in renewable energy output and user load levels. In reference (Harrison and Wallace, 2005), the hosting capacity of renewable energy is evaluated under different load levels and power factor scenarios, and the results are compared and analyzed.
Often, the above literature only considers the variation of single index constraints and does not comprehensively consider the hosting capacity evaluation indexes such as power quality, thermal stability and short-circuit current.
Because the renewable energy hosting capacity evaluation problem is nonlinear and the model is relatively complex, the solution needs more time and computing power. In reference (Dong et al., 2022) for the nonlinearity of the problem, a linearization method is proposed to linearize the problem as much as possible, which reduces the difficulty and complexity of the global optimization, but the solution accuracy also decreases.
To sum up, this paper proposes a multi strategy improved adaptive manta ray foraging optimization algorithm (MSAMRFO) to calculate the renewable energy hosting capacity of distribution network. Firstly, the calculation index system and calculation model of renewable energy hosting capacity of distribution network are constructed. Secondly, three different strategies are used to improve the traditional manta ray foraging algorithm (MRFO), and MSAMRFO algorithm is proposed to calculate the renewable energy hosting capacity model of distribution network. Finally, a 45 node distribution network example is used to verify the effectiveness of the model and solution method in this paper.
To help readers understand this paper, the variables and corresponding definitions are shown in the following Table 1. The full names of different algorithm abbreviations are shown in Table 2
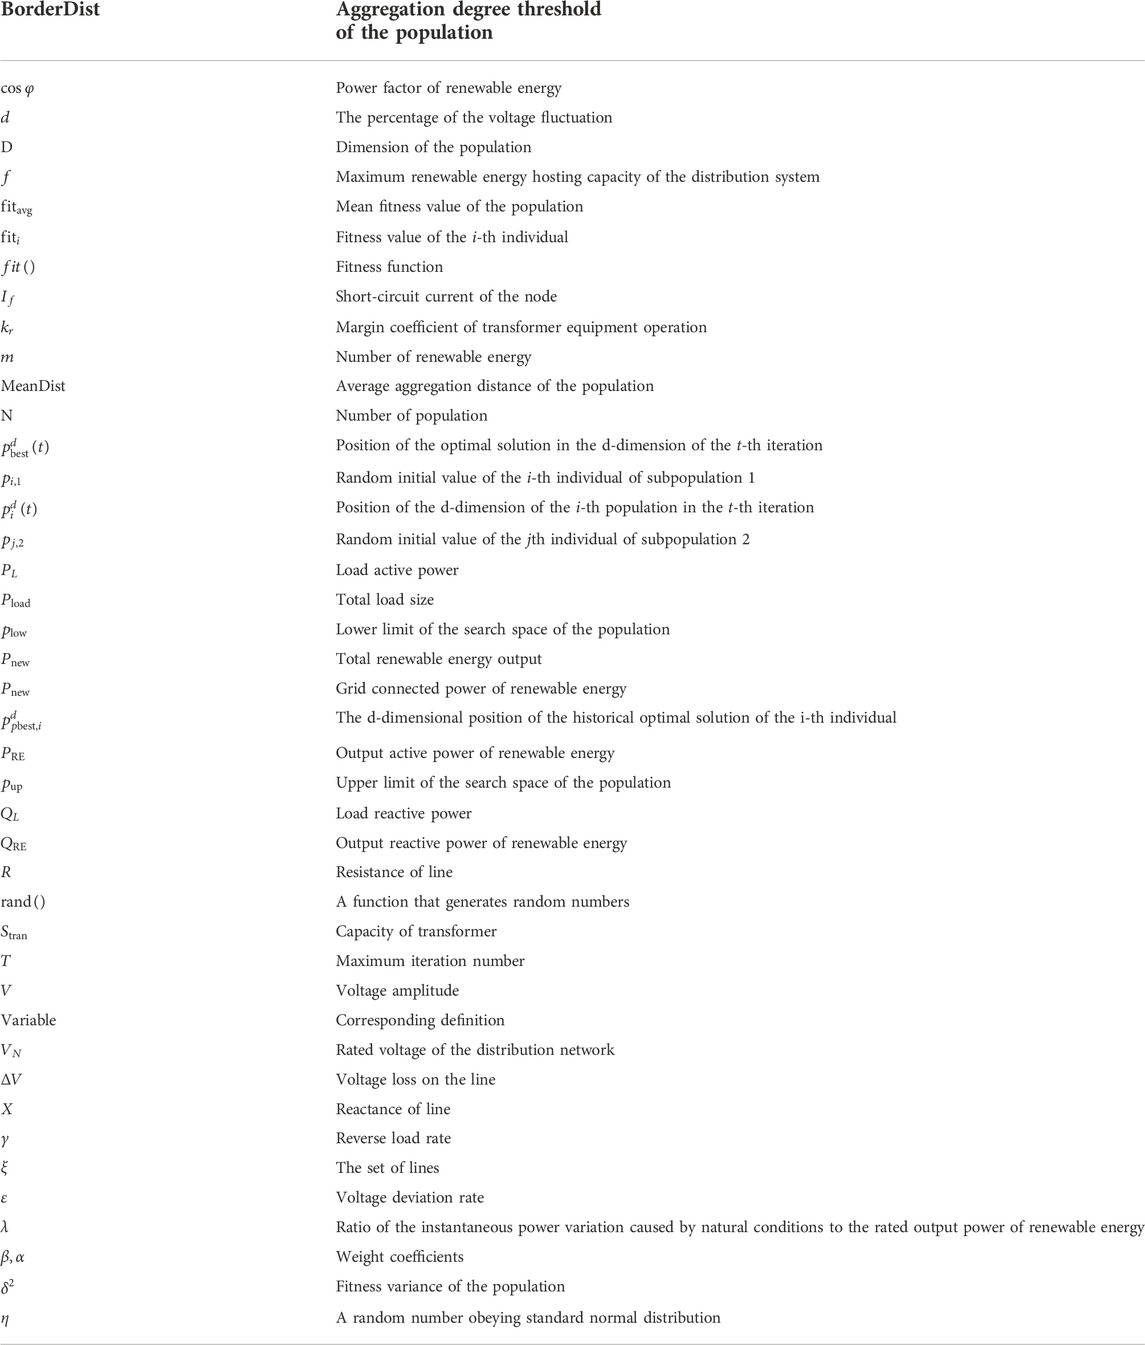
TABLE 1. The variables and corresponding definitions.
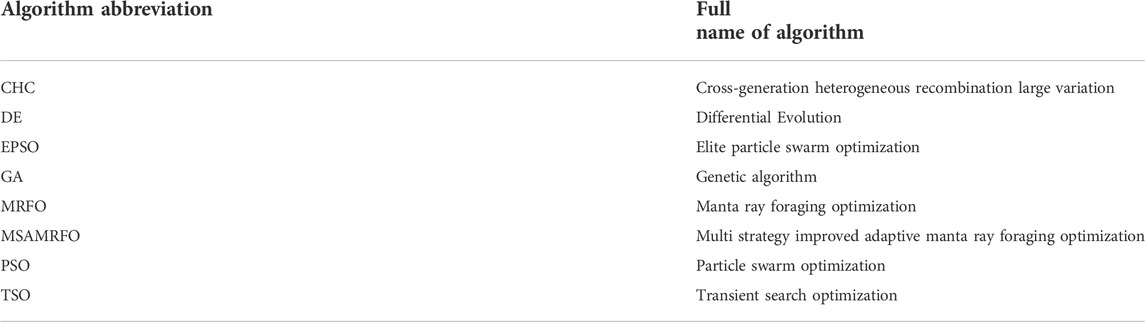
TABLE 2. ANOVA and wilcoxon signed rank test.
Renewable energy access to the distribution network will have a great impact on the power flow, power quality and relay protection of the system. This section will establish a renewable energy hosting capacity evaluation system from three aspects: thermal stability, power quality and short-circuit current, in which power quality includes voltage deviation and voltage fluctuation. Most of the distribution networks in China are open-loop design and closed-loop operation, so the normal operation of the distribution network can be equivalent to a single power radiation network, as shown in Figure 1.
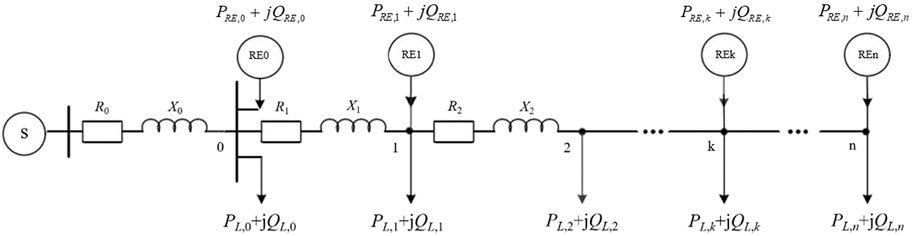
FIGURE 1. Topology of distribution network with renewable energy.
A large number of renewable energy sources are connected to the grid, which greatly changes the original one-way flow trend, resulting in two-way flow of the current and even power supply to the upper power grid. Power transmission and transformation equipment in distribution network is the object of thermal stability evaluation (Koutroumpezis and Safigianni, 1427). The thermal stability of power transmission and transformation equipment must not exceed the specified limits. Thermal stability evaluation calculates the directional load rate according to various operation modes of power grid operation. The formula for calculating the reverse load rate is as follows:
Where
The constraints for the reverse load rate are as follows:
The maximum value
Where
The voltage drop of the line is as follows:
Where
The difference between the end voltage and the line loss voltage is shown below.
The voltage deviation constraints of the calculation model of the maximum admittance capacity of renewable energy are determined by the relevant stipulations of the national standard as follows.
Where
Large-scale renewable energy is connected to the distribution network, and the randomness of renewable energy output (Siano et al., 2010) will cause certain fluctuation of voltage in the distribution network in a short time. In order to ensure power quality, the fluctuation of voltage should not exceed the maximum allowable fluctuation. Voltage fluctuation constraints are shown below.
Where
Voltage fluctuations due to photovoltaic and wind power connections can be calculated by the following formula.
Where
The instantaneous power variation amplitude of distributed wind power caused by external wind speed and direction is set as the proportion of rated power
Where
The introduction of renewable energy sources increases the short-circuit current at distribution network fault points, which poses challenges to the breaker’s current interrupting ability and distribution automation fault handling. Short-circuit current check shall be based on the principle that the short-circuit current of each bus node of the system does not exceed the limit of the corresponding breaker open-circuit current (Ochoa et al., 2010) after connecting to renewable energy sources. The checking formula of short-circuit current is as follows.
Where
In conclusion, the index system for calculating the renewable energy hosting capacity of distribution network is shown in Figure 2.
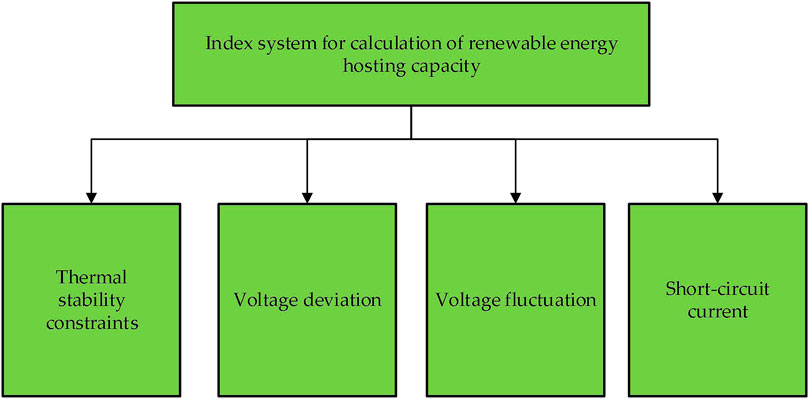
FIGURE 2. Index system for calculation of renewable energy hosting capacity.
The renewable energy hosting capacity of the distribution network refers to the maximum renewable energy capacity that the distribution network can access on the premise of ensuring the safe and stable operation of the system, that is, without violating the security and stability constraints of the system. The security and stability constraints of distribution network include thermal stability constraints, voltage deviation constraints, voltage fluctuation constraints, short-circuit current constraints, power flow constraints, etc. Therefore, the calculation model of renewable energy hosting capacity is as follows.
In the distribution network, distributed renewable energy often has multiple access nodes instead of single point access. This paper assumes that all distributed renewable energy sources have the same power factor (Wang et al., 2016), and that the maximum capacity allowed to access the distribution network is as follows:
Where
Distribution networks are usually radial and under normal operation the power flow equation can be expressed as:
Where
Constrained by natural conditions, the power of each renewable energy access node to the renewable energy will be limited to a certain extent, as follows:
The renewable energy hosting capacity of the distribution network will be subject to thermal stability constraints, as shown in Eqs. 2, 3, voltage deviation constraints, as shown in Eq. 6, voltage fluctuation constraints, as shown in Eqs. 8, 9, and short-circuit current constraints, as shown in Eq. 10.
MRFO is a kind of mathematical modelling to simulate the manta ray foraging process in the ocean, aiming at different predation strategies, and mathematical description of manta ray individual position update. MRFO has three feeding strategies, namely, chain foraging, spiral foraging and tumbling foraging (Hemeida et al., 2020).
The model established in this paper includes thermal stability constraints, power quality constraints, short-circuit current constraints, power flow constraints and so on. It is a highly nonlinear complex model. The traditional particle swarm optimization algorithm (PSO) and genetic algorithm (GA) have a single search mechanism, and the population location update parameters need to be set manually. In the face of large-scale complex models, the efficiency of particle swarm optimization algorithm is slow. In contrast, MRFO algorithm has rich search mechanism and individual update mechanism, which can better adapt to multi constraint models, and has high solution efficiency.
In this paper, based on the traditional MRFO algorithm, several improvements are made, and the ability of both convergence speed and global optimization is proposed. Firstly, in terms of population initialization, a half uniform initialization strategy was proposed to improve population diversity. Secondly, MSAMRFO introduced Sigmoid function in chain search and spiral foraging with a renewable exponential weight factor, and changed the original random step size to variable step size, so that the population could better balance the global search and local search, and accelerate the convergence rate of global search. Finally, in order to ensure the global convergence of the population and determine whether the population falls into the local optimum, the fitness variance of the population and the aggregation distance of particles are calculated respectively to distinguish whether the population falls into the local optimum, and the population falling into the local optimum is mutated according to a certain mutation probability.
In order to improve the diversity of the population, the population was divided into two subpopulations, namely subpopulation 1 and subpopulation 2. Subpopulation 1 will adopt the same random initialization method as the traditional MRFO algorithm, and subpopulation 2 will adopt the half uniform initialization strategy to ensure the diversity of the whole population. The mathematical model of half initialization strategy is as follows:
Where
Before each iteration, a random number
Where
If the random number
If
Where
After the chain foraging or spiral foraging is performed to update individual positions, individuals of the population take the current optimal solution as the rolling fulcrum and roll to the other side of the mirror relationship with their current positions. The mathematical model is shown as follows:
Where
After each iteration, the renewable positions of some individuals in the population are sometimes inferior to the original positions. In order to accelerate the global convergence of the population, it is necessary to determine whether the individuals in the population use the positions after iteration to replace the positions before iteration, as follows:
Where
In order to prevent the population from falling into the local optimal solution, this paper uses population fitness variance, population average aggregation distance and clustering degree threshold to judge whether the population falls into the local optimal solution. If it falls into the local optimal solution, it can jump out of the local optimal solution by mutation with a certain probability.
The variance of population fitness is shown in the formula below.
Where
The average aggregation distance of the population is as follows:
The aggregation degree threshold of the population is as follows:
Where
When the variance of fitness of the population approaches 0 and the average aggregation distance of the population is greater than the threshold of aggregation degree, the population is considered to have reached global convergence. Otherwise, when the fitness variance of the population approaches 0 and the average aggregation distance of the population is less than the threshold of aggregation degree, the population is considered to be in local convergence, and
When the fitness variance of the population approaches to 0 and the average aggregation distance of the population is less than the threshold of the aggregation degree, the population is considered to be in the local optimum. At this time, the search space of the population may be limited to the vicinity of the local optimum solution. Therefore, we need to mutate the population to increase the search space of the population and make the population jump out of the local optimum. When the population falls into the local optimum, the variation rule of the population is that given a probability of variation, a random number is generated in the iteration. If the random number is less than the probability of variation, the population is mutated, that is, a random disturbance is added to
Where
Based on the above description, the process of MSAMRFO algorithm to solve the renewable energy hosting capacity of distribution network is shown in Figure 3.
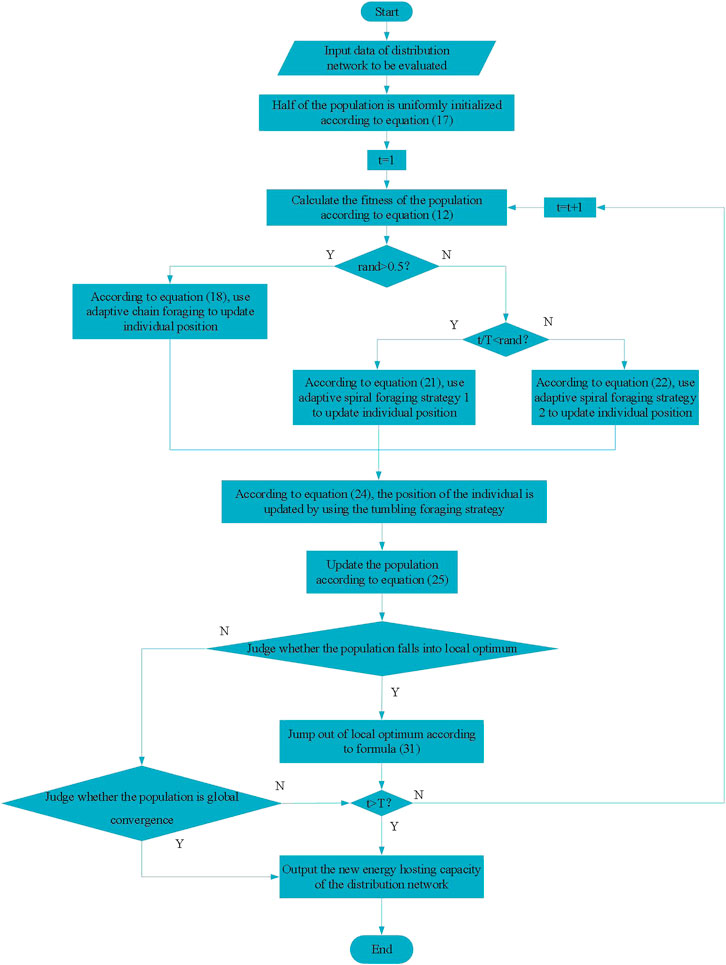
FIGURE 3. MSAMRFO solution process.
In order to verify the effectiveness of the model and method proposed in this paper, the renewable energy hosting capacity of the distribution network with 45 nodes is calculated first, then the advantages and disadvantages of different algorithms are compared, and finally the various indicators that affect the renewable energy hosting capacity are analysed.’
In this paper, a power distribution system with a voltage level of 20kV and 45 nodes is taken as an example, and the network reference is (Bignucolo et al., 2008). In the distribution network, there are 4 wind power grid-connected nodes, namely node 2, node 7, node 11, node 15 and 5 photovoltaic grid-connected nodes, namely node 19, node 22, node 30 and node 40. The total active power of the system is 34.18MW, and the total reactive power is 11.24MVar. The structure of the system is shown in Figure 4.
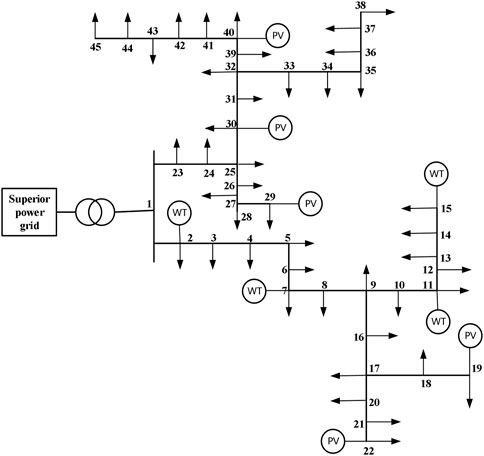
FIGURE 4. 45 Node distribution network structure diagram.
Node 1 in Figure 4 is connected to the low-voltage side of the transformer with a rated capacity of 40MVA. It can be set as a balance node, and all other nodes are set as PQ nodes. According to the resource endowment conditions of the distribution network area, the maximum grid-connected power of renewable energy in this paper is set as 5MW, and the power factor of renewable energy is set as 0.95. The MSAMRFO algorithm in Section 3 is used to calculate the renewable energy hosting capacity of the distribution network. The number of populations is set as 40, and the maximum number of iterations is 50. In accordance with international standards, the operating margin coefficient of transformer equipment
The calculation of this example is completed on a computer with Intel Core I7-11700F processor 2.5GHz and 16 GB memory, and the simulation calculation is based on Python language.
In order to illustrate the superiority of MSAMRFO algorithm in calculating the renewable energy hosting capacity of distribution network, this paper compares eight different algorithms, including the traditional MRFO algorithm, GA algorithm, PSO algorithm, elite particle swarm optimization (EPSO) algorithm, transient search optimization (TSO) algorithm, etc. The comparison of different algorithms is shown in Figure 5. In order to ensure the comparability between algorithms, this paper sets the same starting point for each algorithm, and conducts 30 calculations. The box diagram of 30 calculations for each algorithm is shown in Figure 6. The calculation results of all algorithms are tested by one-way analysis of variance (ANOVA) and Wilcoxon Signed-Rank Test. The results of ANOVA and Wilcoxon Signed-Rank Test are shown in Table 3.
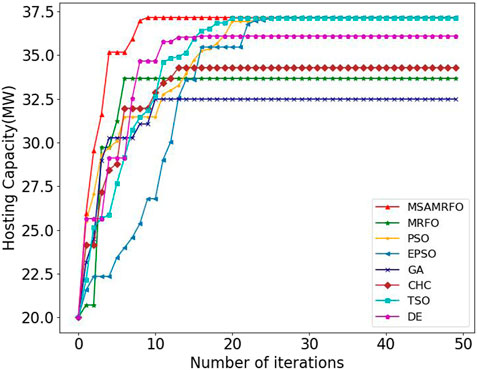
FIGURE 5. Convergence curve of different algorithms.
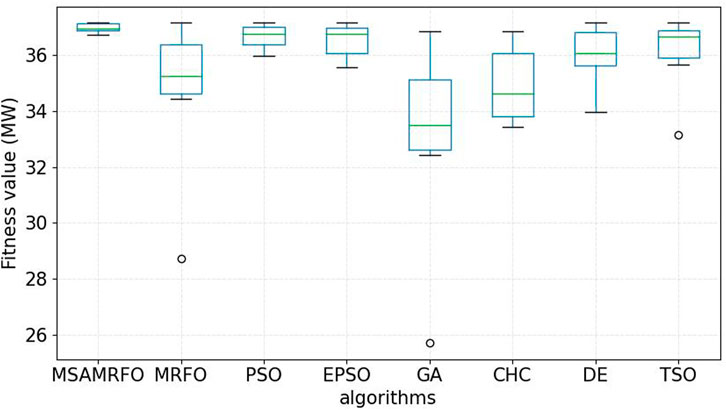
FIGURE 6. Box-and-Whisker plot of different algorithm.
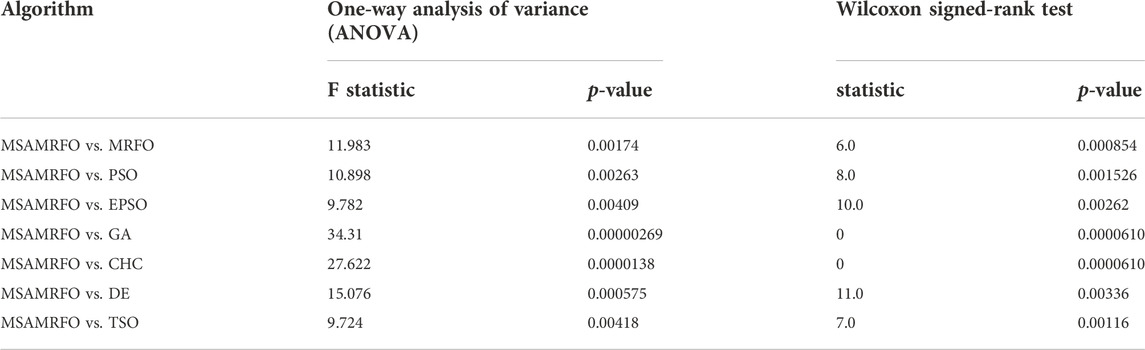
TABLE 3. Algorithm abbreviation.
Although PSO algorithm, EPSO algorithm and TSO algorithm perform well in stability and convergence, their computational efficiency is low and their convergence speed is slow. The main reason is that the population location update method is simple, and it is unable to effectively extract the characteristics of the model to quickly find high-quality optimal solutions. In addition, PSO algorithm and EPSO algorithm require many parameters to be adjusted manually, which is difficult to apply in practice. It takes a lot of time to adjust parameters, and the adaptability to different models is poor. Compared with PSO algorithm and EPSO algorithm, evolutionary algorithms (GA, CHC, DE) have higher convergence speed, but their stability is poor and they are easy to fall into local optimum. It can be seen from Table 3 that the p-value of ANOVA and Wilcoxon Signed-Rank Test, which compare MSAMRFO algorithm with other algorithms, is less than 0.005. The results show that the performance of MSAMRFO algorithm is significantly different from other algorithms. Through the above comparison, it can be seen that the MSAMRFO algorithm proposed in this paper has obvious advantages compared with other algorithms.
The renewable energy hosting capacity of the distribution network and the maximum grid-connected capacity of each grid-connected node are shown in Table 4.
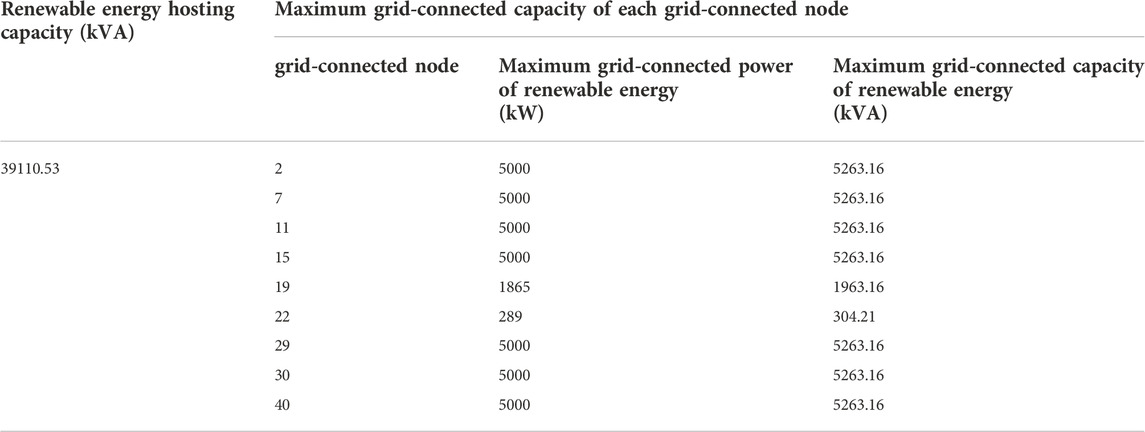
TABLE 4. The renewable energy hosting capacity and the maximum grid-connected capacity of each grid-connected node.
According to the calculation results in Table 4, the above table, the renewable energy hosting capacity of the distribution network is 39110.53kVA. Except for the end node 19 and end node 22, the maximum renewable energy accessible power of other renewable energy grid connected nodes is the grid connected power limit of the node
The voltage deviation of the distribution network under renewable energy access is calculated according to the grid-connected power in Table 4, and is compared with that without renewable energy access. He calculation results are shown in Figure 7.
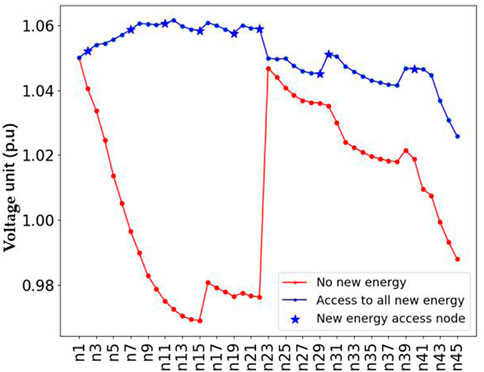
FIGURE 7. Voltage deviation contrast.
It can be seen from the above analysis that the access of renewable energy will increase the voltage of distribution network nodes, and the closer the renewable energy is to the end of the line, the more obvious the increase of voltage will be, that is, the closer the node is to the end of the line, the smaller the maximum access power of renewable energy will be.
After the renewable energy is connected according to the grid-connected power in Table 4, the voltage fluctuation of the node is shown in Figure 8.
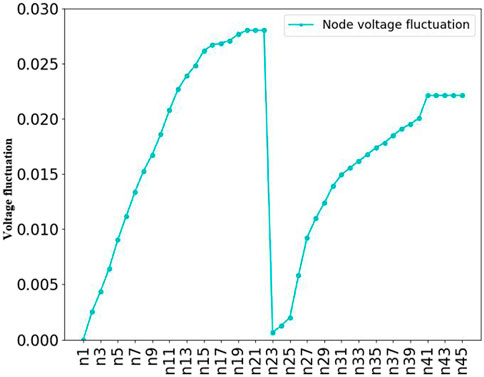
FIGURE 8. Voltage fluctuation.
Through the analysis of the above figure, it can be seen that the more renewable energy is connected to the feeders of the distribution network, the greater the voltage fluctuation will be, and the closer to the end of the feeder, the more the voltage fluctuation will be affected by the renewable energy.
When a short-circuit fault occurs in the system, the renewable energy will provide short-circuit current to the short-circuit point, which will increase the short-circuit current at the fault point and affect the relay protection. After the renewable energy is connected to the grid according to the power in Table 4, the short-circuit current of the nodes after the three-phase short-circuit occurs is calculated and compared with the short-circuit current of the nodes before the renewable energy is connected, as shown in Figure 9.
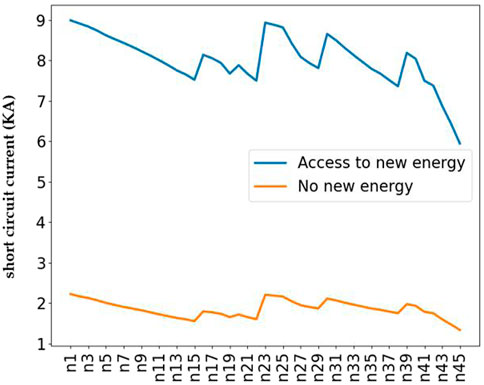
FIGURE 9. Contrast diagram of the nodes’ short-circuit current.
Under the access of renewable energy, after the three-phase short circuit and single-phase short circuit occur in the system, the short-circuit current provided by renewable energy is shown in Table 5, and some typical nodes are selected for analysis in Table 5.
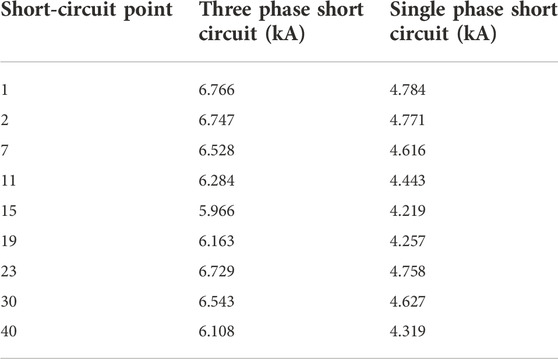
TABLE 5. Short-circuit current of three-phase short circuit and single-phase short circuit of typical nodes.
From the above calculation results, it can be seen that the renewable energy access will lead to a significant increase in the short-circuit current of the node. Since node 1 is connected to the transformer and has strong voltage stability, the short-circuit current of this node is the largest. When the renewable energy access capacity of the system is too large, it is likely to cause the short-circuit current of node 1 to exceed the limit. Renewable energy can increase the short-circuit current, and the short-circuit current will increase significantly in case of short circuit at the node of renewable energy.
The access of renewable energy will not only increase the voltage of the node, cause power quality problems such as the fluctuation of the node voltage, but also lead to relay protection problems and thermal stability problems such as the increase of the short-circuit current of the line. By constructing the index system of renewable energy hosting capacity of distribution network, this paper puts forward the calculation model and solution method of renewable energy hosting capacity. The 45 node simulation results verify the efficiency of the proposed model and method. The main conclusions are as follows:
The renewable energy hosting capacity of distribution network is affected by multiple indicators, such as the load level of distribution network, the access location of renewable energy, the type of renewable energy, the natural conditions of node areas, etc.
The access of renewable energy will lead to the increase of node voltage. The closer the access of renewable energy is to the end node of the line, the more obvious the voltage rise of the node is. Therefore, the capacity of renewable energy connected to the end of the line should not be too large, otherwise it is easy to cause the node voltage to exceed the limit.
The greater the number of renewable energy access in the feeder of distribution network and the closer the access location is to the end of the line, the more obvious the voltage fluctuation of nodes will be.
The renewable energy in the distribution network will greatly increase the short-circuit current of the distribution network, and the short-circuit current of the nodes closer to the transformer will be more affected by the renewable energy. At the same time, renewable energy has an obvious increasing effect on its nodes.
The MSAMRFO algorithm proposed in this paper shows good performance in solving the renewable energy hosting capacity model of distribution network, and shows good advantages in convergence speed and global optimization.
This paper only considers wind power and photovoltaic, but does not consider the impact of energy storage and flexible load on the renewable energy hosting capacity of distribution network. The follow-up research will focus on the impact of energy storage and flexible resources on the renewable energy hosting capacity of distribution network.
The future research work should carefully consider the uncertainty of renewable energy, the changes of renewable energy and load, and the interaction of their inconsistent changes in the model.
The original contributions presented in the study are included in the article/Supplementary Material; further inquiries can be directed to the corresponding author.
ZY has made a deep research on MSAMRFO algorithm. MX compares different algorithms. YT investigated the research background of hosting capacity. ML has studied the current research situation. ZG has studied the model of the paper. JZ typeset and revised the paper.
Authors YT, ML, and JZ were employed by Power Grid Planning Research Center of Guangxi Power Grid Co., Ltd.
The remaining authors declare that the research was conducted in the absence of any commercial or financial relationships that could be construed as a potential conflict of interest.
The authors declare that this study received funding from the Science & Technology Project of China Southern Power Grid. The funder had the following involvement in the study: design, data collection and preparation of the manuscript.
All claims expressed in this article are solely those of the authors and do not necessarily represent those of their affiliated organizations, or those of the publisher, the editors and the reviewers. Any product that may be evaluated in this article, or claim that may be made by its manufacturer, is not guaranteed or endorsed by the publisher.
AlKaabi, S. S., Khadkikar, V., and Zeineldin, H. H. (2015). Incorporating PV inverter control schemes for planning active distribution networks. IEEE Trans. Sustain. Energy 6 (4), 1224–1233. doi:10.1109/tste.2015.2422305
Bignucolo, F., Caldon, R., and Prandoni, V. (2008). Radial MV networks voltage regulation with distribution management system coordinated controller. Electr. Power Syst. Res. 78 (4), 634–645. doi:10.1016/j.epsr.2007.05.007
Dent, C. J., Ochoa, L. F., and Harrison, G. P. (2010). Network distributed generation capacity analysis using OPF with voltage step constraints. IEEE Trans. Power Syst. 25 (1), 296–304. doi:10.1109/tpwrs.2009.2030424
Dong, Y., Wang, S., and Yan, B. (2019). Review on evaluation methods and improvement techniques of DG hosting capacity in distribution network[J]. Power System Technology. doi:10.13335/j.1000-3673.pst.2019.0428
Dong, Y., Dong, C., Yu, R., and Ding, J. (2022). Rerenewableable energy capacity assessment in power system based on linearized OPF[J]. Electr. Power 55, 1. doi:10.11930/j.issn.1004-9649.202107061
Harrison, G., and Wallace, A. (2005). Optimal power flow evaluation of distribution network capacity for the connection of distributed generation. IEE Proc. Gener. Transm. Distrib. 152 (1), 115–122. doi:10.1049/ip-gtd:20041193
Hemeida, M. G., Ibrahim, A. A., Mohamed, A., Alkhalaf, S., and El-Dine, A. M. B. (2020). Optimal allocation of distributed generators DG based Manta Ray Foraging Optimization algorithm (MRFO)[J]. Ain Shams Eng. J. 12, 609. doi:10.1016/j.asej.2020.07.009
Hu, H., Wu, S., and Xia, X. (2006). Computing the maximum penetration level of multiple distributed generators in distribution network taking into account voltage regulation constraints[J]. Proc. Csee 26, 13. doi:10.3321/j.issn:0258-8013.2006.19.003
Koutroumpezis, G. N., and Safigianni, A. S. (2010). Optimum allocation of the maximum possible distributed generation penetration in a distribution network. Electr. Power Syst. Res. 80 (12), 1421–1427. doi:10.1016/j.epsr.2010.06.005
Lei, J., Huang, W., and Xia, X. (2008). Penetration level calculation with considerations of phase-to-phase short circuit fault[J]. Automation Electr. Power Syst.. doi:10.3321/j.issn:1000-1026.2008.03.019
Li, N., Li, Y. G., and Zhou, Q. J. (2013). Power flow calculation based on power losses sensitivity for distribution system with distributed generation[J]. Appl. Mech. Mater. 391, 295–300. doi:10.4028/www.scientific.net/amm.391.295
Ochoa, L. F., Dent, C. J., and Harrison, G. P. (2010). Distribution network capacity assessment: Variable DG and active networks. IEEE Trans. Power Syst. 25 (1), 87–95. doi:10.1109/tpwrs.2009.2031223
Siano, P., Chen, P., Chen, Z., and Piccolo, A. (2010). Evaluating maximum wind energy exploitation in active distribution networks. IET Gener. Transm. Distrib. 4 (5), 598–608. doi:10.1049/iet-gtd.2009.0548
Vovos, P., and Bialek, J. (21342005). Direct incorporation of fault level constraints in optimal power flow as a tool for network capacity analysis. IEEE Trans. Power Syst. 20 (4), 2125–2134. doi:10.1109/tpwrs.2005.856975
Vovos, P. N., Harrison, G. P., Wallace, A. R., and Bialek, J. (2005). Optimal power flow as a tool for fault level-constrained network capacity analysis. IEEE Trans. Power Syst. 20 (2), 734–741. doi:10.1109/tpwrs.2005.846070
Wang, J. H., Tai, N. L., and Song, K. (2010). Penetration level permission of for DG in distributed network considering relay protection[J]. Proc. Csee 30, 37. doi:10.13334/j.0258-8013.pcsee.2010.22.004
Wang, S., Chen, S., Ge, L., and Wu, L. (2016). Distributed generation hosting capacity evaluation for distribution systems considering the robust optimal operation of OLTC and SVC. IEEE Trans. Sustain. Energy 7 (3), 1111–1123. doi:10.1109/tste.2016.2529627
Zhang, X., et al. (2005). A modified particle swarm optimizer for tracking dynamic systems.” in Proceedings of the International Conference on Natural Computation Springer Berlin Heidelberg, Changsha, China, August 2005.
Zheng, T., Jia, S., and Pan, Y. (2014). Research on allowed penetration level of DGs based on the traditional fault location methods[J]. Power Syst. Technol. 38, 2257. doi:10.13335/j.1000-3673.pst.2014.08.037
Zhong, Q., Gao, X., and Yu, N. (2014). Accommodating capacity and mode of distributed generation under harmonic constraint in active distribution networks[J]. Automation Electr. Power Syst. 38. doi:10.7500/AEPS20131214002
Keywords: distribution network, renewable energy, hosting capacity, hosting capacity index system, MSAMRFO algorithm
Citation: Yuan Z, Xu M, Tao Y, Li M, Guo Z and Zhang J (2023) Calculation of renewable energy hosting capacity of distribution network based on multi strategy improved adaptive manta ray foraging optimization. Front. Energy Res. 10:985623. doi: 10.3389/fenrg.2022.985623
Received: 04 July 2022; Accepted: 27 September 2022;
Published: 11 January 2023.
Edited by:
Joao Soares, Instituto Superior de Engenharia do Porto (ISEP), PortugalReviewed by:
Kartik Shashikant Pandya, Charotar University of Science and Technology, IndiaCopyright © 2023 Yuan, Xu, Tao, Li, Guo and Zhang. This is an open-access article distributed under the terms of the Creative Commons Attribution License (CC BY). The use, distribution or reproduction in other forums is permitted, provided the original author(s) and the copyright owner(s) are credited and that the original publication in this journal is cited, in accordance with accepted academic practice. No use, distribution or reproduction is permitted which does not comply with these terms.
*Correspondence: Zuogang Guo, Z3VvemdAY3NnLmNu
Disclaimer: All claims expressed in this article are solely those of the authors and do not necessarily represent those of their affiliated organizations, or those of the publisher, the editors and the reviewers. Any product that may be evaluated in this article or claim that may be made by its manufacturer is not guaranteed or endorsed by the publisher.
Research integrity at Frontiers
Learn more about the work of our research integrity team to safeguard the quality of each article we publish.