 Wei-Ping Wu
 Wen-Hua Xie
 Jun Jing1
95% of researchers rate our articles as excellent or good
Learn more about the work of our research integrity team to safeguard the quality of each article we publish.
Find out more
ORIGINAL RESEARCH article
Front. Energy Res. , 30 August 2022
Sec. Sustainable Energy Systems
Volume 10 - 2022 | https://doi.org/10.3389/fenrg.2022.985359
This article is part of the Research Topic Interactions Between China’s National Emissions Trading Scheme and Electricity Market: Practices and Policies View all 27 articles
Seeking a scientific and reasonable population structure is the key to realizing low-carbon and green development of urban agglomerations. Based on the coupled coordination degree model and exploratory spatial data analysis (ESDA), this paper studied the spatiotemporal differences of population spatial equilibrium in Changsha-Zhuzhou-Xiangtan urban agglomeration, and constructed a nonlinear dynamic panel econometric model and quantile regression model to empirically test the carbon emission reduction effect and its heterogeneity of the population spatial equilibrium. The research conclusions are as follows: First, the population spatial equilibrium index of Changsha-Zhuzhou-Xiangtan urban agglomeration shows an upward trend in time, but the overall level is not high and the internal gap is obvious. In space, it presents a situation of concentration in the central urban area of Changsha. Second, the carbon emissions of Changsha-Zhuzhou-Xiangtan urban agglomeration have obvious dynamic inertia and path-dependent characteristics. That is, the carbon emissions of the previous period will significantly promote the carbon emissions of the current period. Third, the carbon emission reduction effect of population spatial equilibrium has the characteristics of an inverted “U” shape, and the population spatial equilibrium index in most areas is too low to achieve carbon emission reduction. Fourth, the legal environment helps to promote the spatial balance of population, thereby reducing the regional total carbon emissions, per capita carbon emissions and carbon emissions per unit area. Last, Changsha-Zhuzhou-Xiangtan urban agglomeration needs to improve the level of economic development and government expenditure to realize the carbon emission reduction effect. In general, Changsha-Zhuzhou-Xiangtan urban agglomeration should take into account the development of economy and environment in the process of improving the level of population space balance, so as to achieve a win-win situation for economy and environment.
Population is a key determinant of the sustainable development of urban agglomerations. The spatial distribution of population elements is the core issue of the spatial structure of urban agglomerations. It is a comprehensive reflection of development factors such as population, economy, resources, and environment, and can characterize the geographic and spatial distribution of population in urban agglomerations (Zhang et al., 2015). As an important part of the structural evolution of urban agglomerations, the spatial distribution of population is affected by physical and geographical environmental factors and socio-economic factors in a specific area on the one hand, and it is also counteracted by the economic and social development and evolution of urban agglomerations (Wang, 2022). In developing countries, with the rapid development of urbanization, the spatial distribution of population is unbalanced, the peri-urbanization of large cities and the risk of ebb tide intensify, indicating that the nature of the population problem has changed from the “oppressive type of quantitative growth” in the past to the “imbalance of structure and distribution constraints” type”, and has long plagued the sustainable economic and social development of urban agglomerations and government policy formulation (Fang et al., 2019; Goel and Vishnoi, 2022). Seeking a spatially balanced pattern of population distribution and the coordinated development of economy, society, resources and environment has become a concrete manifestation of the sustainable development of urban agglomerations in the spatial distribution of population (Lee et al., 2021; Wang et al., 2022; Wu et al., 2022; Yang et al., 2022). It is of great practical significance to promote the healthy development of urban agglomerations, build a spatial pattern of urbanization with coordinated development of large, medium and small cities, and realize the effective use of urban agglomeration space and the overall improvement of economic efficiency under the existing resource and environmental carrying capacity.
Existing research lacks direct discussion on urban population spatial balance and carbon emissions (Li et al., 2022), and mostly focuses on the impact of urban population structure and spatial structure on carbon emissions (Liu et al., 2020; Xia et al., 2020; Yu et al., 2022). Among them, in terms of population structure research, the existing literature mainly decomposes the population structure into population age structure, population employment structure, and population consumption structure, and specifically examines the impact of different types of population structures on carbon emissions. For example, Wang and Wang (2020) examined the nonlinear effects of population age structure and urbanization level on carbon emissions based on panel data of 137 countries and a threshold effect model. Fan et al. (2021) established a new analytical framework and explored the impact of population aging on the carbon emissions of Chinese urban and rural households using panel data from 30 provinces in China from 1997 to 2017. In addition, regarding the impact of population consumption structure on carbon emissions, researchers mainly used the input-output model to conduct empirical tests (Kim, 2002), and found that the increase in the proportion of fossil fuel consumption in household consumption expenditure will have a significant positive effect on carbon emissions effect (Park and Hao, 2007; Soytas et al., 2007; Soytas and Sari, 2009). Regarding the impact of urban spatial structure on carbon emissions, existing studies have mainly discussed the impact of urban population agglomeration and changes in urban spatial structure on carbon emissions. For example, Glaeser and Kahn (2010), based on data from 66 large cities in the United States, found that the more densely populated urban areas, the lower the per capita carbon emissions. And suburban cities with lower population density have higher carbon emissions per capita. Wang et al. (2021) constructed an urban agglomeration spatial structure index and used the GTWR model to empirically test the impact of the spatial structure of six major urban agglomerations in China on carbon emissions. The effect of emission reduction, on the contrary, promotes carbon emissions.
The spatial balance of population in urban agglomerations is a complex system involving population, economic and social issues, and itself is a long-term, dynamic adjustment and optimization process (Wei and Liu, 2022). The realization of the balanced distribution of population-industry-housing in urban agglomerations is consistent with the requirements of “accelerating the formation of industrial structures, production methods, lifestyles and spatial patterns that save resources and protect the environment” under the “dual carbon” goal. Therefore, the existing research only starts from a certain dimension of this complex system to explore the static impact of population structure or population spatial distribution structure changes on carbon emissions, and its logical setting has certain defects. Therefore, this paper takes Changsha-Zhuzhou-Xiangtan urban agglomeration in China as an example, aims to expand the research framework of population spatial equilibrium, and further explore the spatial and temporal differentiation characteristics of population distribution equilibrium and its carbon emission reduction effect in Changsha-Zhuzhou-Xiangtan urban agglomeration. Specifically, based on the coupling coordination model, a population spatial equilibrium index is constructed that comprehensively covers population, industry, residence, etc., and a nonlinear dynamic econometric model is constructed to empirically test the effect of urban agglomeration spatial equilibrium on carbon emissions and its mechanism. This paper not only expands the theoretical framework of existing research, but also reveals the objective law that the spatial balance of population in urban agglomerations affects carbon emissions, providing an important basis for exploring the optimization policy of population spatial distribution for carbon emission reduction in urban agglomerations. The logical framework of this study is shown in Figure 1
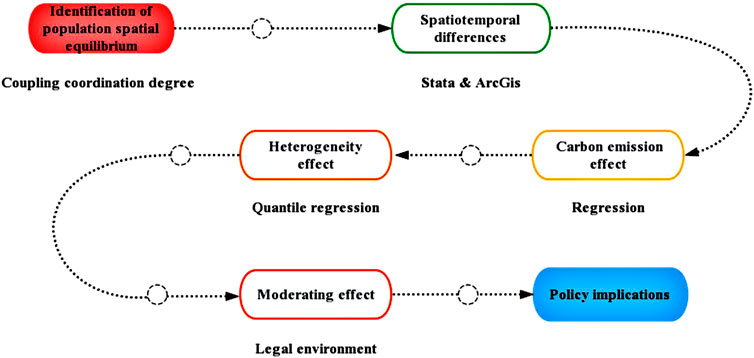
FIGURE 1. The logical framework for this study.
The Changsha-Zhuzhou-Xiangtan urban agglomeration is located in the central and eastern part of Hunan Province, China. It is an important part of the urban agglomeration in the middle reaches of the Yangtze River, including the three cities of Changsha, Zhuzhou and Xiangtan. It is the core growth pole of the economic development of Hunan Province. Changsha-Zhuzhou-Xiangtan urban agglomeration was approved in 2007 as a national comprehensive reform pilot zone for building a resource-saving and environment-friendly society. Since then, Changsha-Zhuzhou -Xiangtan urban agglomeration has officially launched the same transportation network, energy integration, information sharing, ecological construction, and environmental governance. It has become the first case in China to consciously conduct regional economic integration experiments. As a national pilot area for comprehensive reform of the “two-oriented society”, Changsha-Zhuzhou-Xiangtan urban agglomeration is a pioneer in the construction of urban agglomerations in the six provinces of central region. It is the first experimental case in the country to consciously conduct regional economic integration (Xiong et al., 2021). Integrated construction provides an exemplary role. Figure 2 shows the scope of the study area.
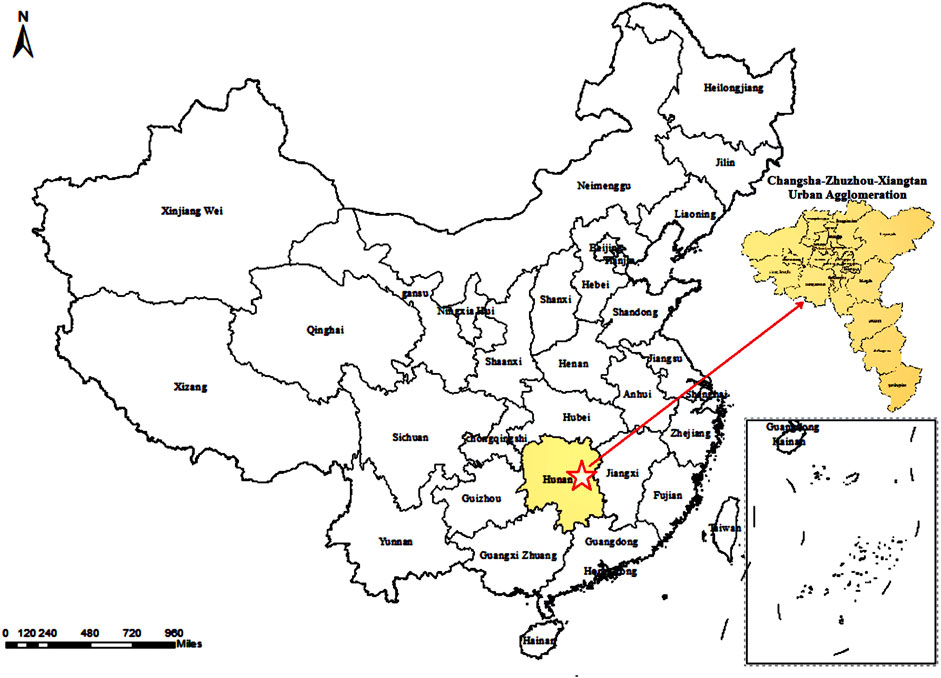
FIGURE 2. The location and scope of Changsha-Zhuzhou-Xiangtan urban agglomeration.
In recent years, the rapid economic and social development of Changsha-Zhuzhou-Xiangtan urban agglomeration has also spawned an imbalance in the spatial distribution of the population: first, population agglomeration lags behind economic agglomeration, resulting in an imbalance between population and economic space, and the emergence of spatial job-housing separation (Hu and Hu, 2019). The distance between the workplace and the housing determines the time and cost of commuting. Long-term commuting reduces the productivity of employees. Long-distance commuting requires transportation, which brings a lot of carbon emissions. Second, the development of the core urban areas of Changsha-Zhuzhou-Xiangtan urban agglomeration faces a strong “ceiling” of limited land space and the demand pressure of continuous population inflow (Wu et al., 2020; Ouyang et al., 2022). The third is that the central urban area faces the “ceiling” of the largest carrying capacity of the population, and most of the population is concentrated in the central urban area, which makes the “urban disease” aggravated due to the excessively high population density in the central urban area, and the public service software and hardware facilities are facing huge pressure and challenges (Li et al., 2021). Therefore, Changsha-Zhuzhou-Xiangtan urban agglomeration urgently needs to achieve the goal of restricted land use, rational and efficient allocation of resources and carbon emission reduction through the optimization and adjustment of the population spatial structure within the city within the carrying range of resources and environment.
Population spatial equilibrium refers to the balanced development of population and economic, social, environmental and other systems. Coupling coordination degree can measure the situation of connection and action between systems (Liang et al., 2022). In order to grasp the temporal and spatial evolution law of population spatial distribution equilibrium, this paper constructs a coupling coordination degree model to measure the coupling coordination degree index of Population-Industry-Household to measure the level of population spatial distribution equilibrium. The identification method of Population Spatial Equilibrium Index is:
Where, C represents the coupling degree of the population-industry-housing system, and F represents the comprehensive development level of the population-industry-housing system. The calculation method is shown in Eqs 2, 3:
Where,
In order to measure the comprehensive development level of the subsystem, this paper constructs the comprehensive evaluation index system of Population-Industry-Household nexus according to the scientific connotation of Population-Industry-Household nexus and referring to relevant literature. The comprehensive evaluation index system includes 3 subsystems and 9 specific indicators (Table 1).
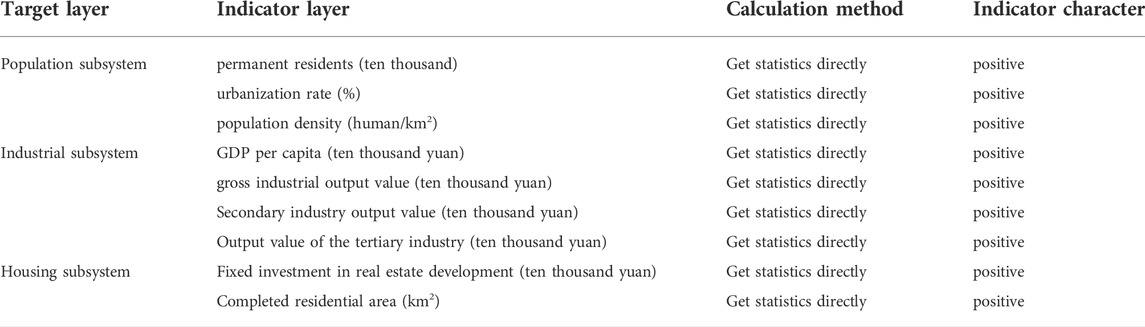
TABLE 1. Population-industry-housing coupling coordination degree evaluation index system.
In terms of population development, this paper selects three indicators: the number of permanent residents at the end of the year, the urbanization rate and the population density to measure the development of the population subsystem. As the main body of economic activities, people are closely related to industry and housing subsystems. The number of permanent residents and population density at the end of the year reflect the population size and spatial distribution characteristics of districts and counties, and the urbanization rate reflects the level of urbanization. In terms of industrial development, this paper selects four indicators of regional per capita GDP, total industrial output value, secondary industry output value and tertiary industry output value to measure the development of industrial subsystems. GDP per capita is the most direct indicator to reflect the development level of urban industries. Gross industrial output value can reflect the scale of urban industrial entities, and the output value of secondary and tertiary industries reflects the economic quality of urban industries. In the aspect of housing development, this paper selects the real estate development fixed investment and the completed residential area as the evaluation indicators of the housing subsystem, which reflect the urban real estate development scale and urban real estate development quality respectively.
The nine indicators included in the above three subsystems together constitute the Population-Industry-Household nexus evaluation index system. The calculation method of the development level of each subsystem is as follows:
In the formula, the weight Wit is obtained by the entropy weight method. First, the sample data needs to be standardized, and then the index entropy
Existing studies have shown that there is a certain theoretical relationship between urban agglomeration spatial balance and carbon emissions, and the relationship between the two is not linear (Wang and Wang, 2020). Furthermore, the spatial equilibrium of population in urban agglomerations is also a long-term and dynamic adjustment process, and traditional static panel data models cannot capture this dynamic inertial feature (Chen et al., 2022). Therefore, in order to systematically explore the nonlinear and dynamic effects of urban agglomeration spatial equilibrium on carbon emissions, this paper constructs a benchmark regression model that includes the quadratic term of the population spatial equilibrium index and the lag term of carbon emissions (Eq. 7). In addition, according to the theory of sustainable development, whether the optimization of the spatial distribution of population in urban agglomerations can achieve high-quality economic development while promoting carbon emission reduction is the key to seeking dual “Pareto improvement” of the environment and economy under the strategic goal of high-quality economic development point. To this end, in addition to empirically examining the carbon emission effect of urban agglomeration population spatial equilibrium, this paper also constructs a nonlinear dynamic panel econometric model to further test the productivity effect of urban agglomeration population spatial equilibrium (Eq. 8).
Where,
Statistics show that the districts and counties of the Changsha-Zhuzhou-Xiangtan urban agglomeration show heterogeneity in terms of population size, population density and economic development level. This means that there may be differences in the impact of population spatial balance on carbon emissions in the central and non-central areas of the Changsha-Zhuzhou-Xiangtan urban agglomeration. To verify this inference, this paper constructs a quantile regression model to test the differential responses of carbon emission levels at different quantiles of the Changsha-Zhuzhou-Xiangtan urban agglomeration to the population spatial equilibrium index. At the same time, the research samples were also grouped according to the urban population size and population density, thereby revealing the heterogeneity of population spatial equilibrium on carbon emissions. The quantile regression model is set as follows:
The dependent variables of this study are the carbon emissions and labor productivity of the Changsha-Zhuzhou-Xiangtan urban agglomeration. Among them, the measurement of labor productivity refers to the practice of Liu and Deng (2018), which is measured by the ratio of the GDP of each district and county in Changsha-Zhuzhou-Xiangtan urban agglomeration to the number of employees at the end of the year. The independent variable of this study is the population spatial equilibrium index of Changsha-Zhuzhou-Xiangtan urban agglomeration. For the specific calculation method, please refer to Section 2.2. The control variables in this paper are economic development level, the quadratic term of the level of economic development, industrial structure, and government expenditure. Among them, GDP is used to measure the level of economic development; the ratio of output value of secondary and tertiary industries is used to measure the industrial structure; government expenditure is used to measure government expenditure.
Based on the panel data of 23 districts and counties in Changsha-Zhuzhou-Xiangtan urban agglomeration from 2005 to 2019, this paper conducts an empirical analysis. The dependent variable carbon emissions data in this paper come from CEADs (China Emission Accounts and Datasets). The CEADs study uses a particle swarm optimization-backpropagation (PSO-BP) algorithm to unify the scale of DMSP/OLS and NPP/VIIRS satellite imagery to estimate CO2 emissions from 2,735 counties in China from 1997 to 2017. Based on the above method, this research team extended the carbon emission data of 23 districts and counties in the Changsha-Zhuzhou-Xiangtan urban agglomeration to 2019. In addition, the dependent variable labor productivity, independent variable population spatial equilibrium index, and the original data of each control variable are from the EPS (Economy Prediction System) global statistical data analysis platform, and Hunan Statistical Yearbook. The missing data is supplemented by the Statistical Bulletin of National Economic and Social Development published by the local government or by using the linear fitting method (interpolation method).
As shown in the Figure 3, it is a trend chart of the population spatial equilibrium over time from 2005 to 2019 in Changsha, Zhuzhou and Xiangtan. The development of the population spatial equilibrium index in Changsha is on the rise and higher than that in Zhuzhou and Xiangtan, with a slight decline in 2014 and 2015. The difference is that the population spatial equilibrium grows slowly. The population spatial equilibrium index in 2005 was 0.329, and grew to 0.608 in 2019 with the growth rate was 84.8%. The population spatial equilibrium in Xiangtan has grown rapidly. In 2019, the population spatial equilibrium was 0.398, a year-on-year increase of 117.96% compared with 2005, and surpassed that of Zhuzhou in 2009. From 2013 to 2016, the population spatial equilibrium index in Xiangtan continued to decline. The population spatial equilibrium index in Zhuzhou in 2019 was 0.369, a year-on-year increase of 76.21% compared with 2005, and the growth rate was small.
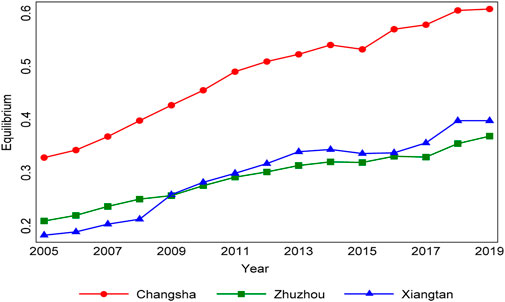
FIGURE 3. Time evolution trend of population spatial equilibrium.
Figure 4 shows the spatial evolution characteristics of the population spatial equilibrium index in Changsha-Zhuzhou-Xiangtan urban agglomeration in 2005, 2010, 2015, and 2019. From 2005 to 2019, the population-industry-housing development situation in most districts and counties are improved, especially Yuelu District, Kaifu District, Yuhua District and Changsha County, and Lukou District, Chaling, Yanling and Youxian County has the least improvement. As for 2019, among the 23 districts and counties in the Changsha-Zhuzhou -Xiangtan urban agglomeration, seven districts and counties is mild to moderate unbalance, 11 districts and counties is barely equilibrium, and five districts and counties is mild to moderate equilibrium.
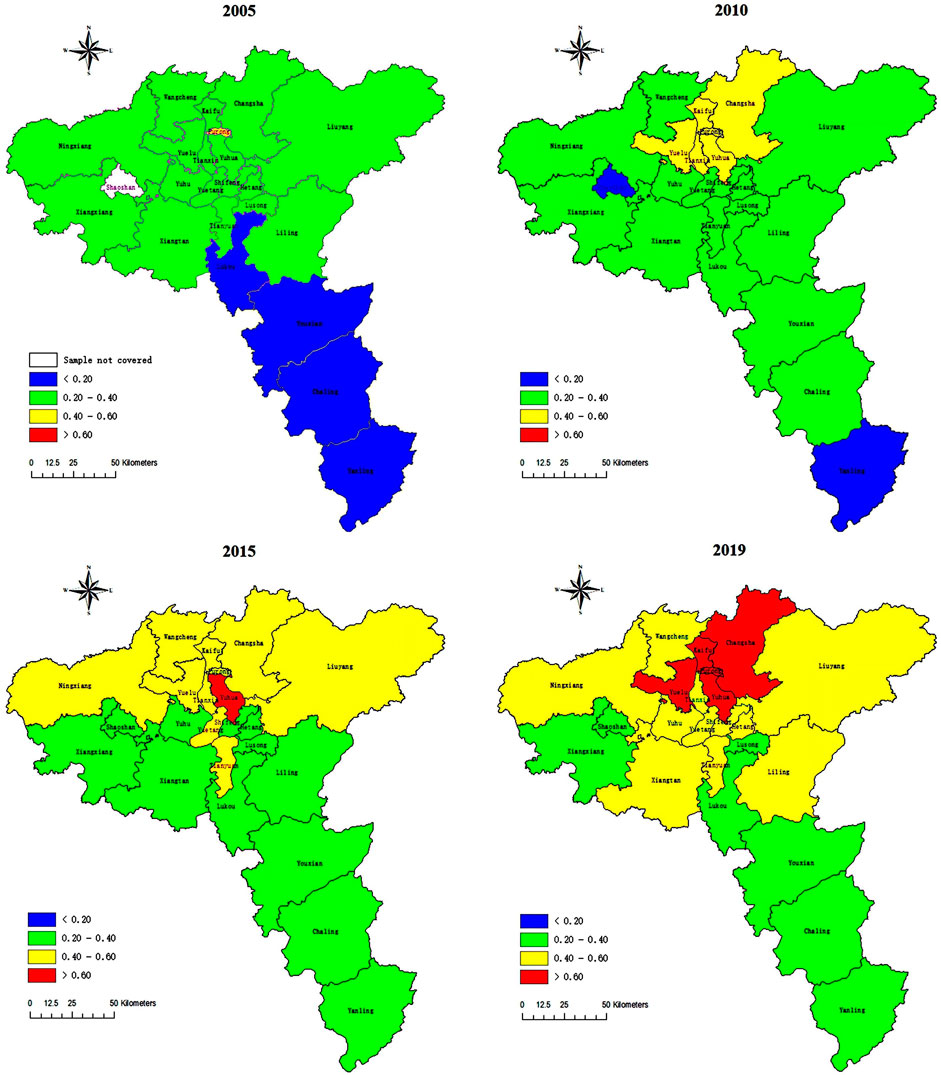
FIGURE 4. Spatial evolution trend of population spatial equilibrium.
In 2005, the data of Shaoshan was missing, only Furong District was barely in equilibrium with population-industry-housing coupling, Lukou District, Chaling City, Liling City and You County showed serious unbalance, and the population spatial equilibrium index in other areas was mild to moderate equilibrium. In 2010, Yuelu District, Tianxin District, Furong District, Yuhua District, Kaifu District and Changsha County barely equilibrium the population-industry-housing development situation, while the population-industry-housing development situation in Shaoshan and Yanling showed serious unbalance. The remaining areas are mild to moderate unbalance. In 2015, the population-industry-housing development situation of the Changsha-Zhuzhou-Xiangtan urban agglomeration has been greatly improved. Yuhua District has become the first primary and intermediate equilibrium area. The number of barely equilibrium areas is 10, the number of mild to moderate imbalanced areas is 12, and there are no severely deranged areas. In 2019, the population-industry-housing development situation of the Changsha-Zhuzhou-Xiangtan urban agglomeration was further improved. Yuelu District, Furong District, Kaifu District, Yuhua District and Changsha County performed at the primary and intermediate levels of equilibrium. The number of unbalanced areas is 7.
Based on the econometric model (7), we estimated the effect of the population spatial equilibrium index of Changsha-Zhuzhou-Xiangtan urban agglomeration on carbon emissions, carbon emissions per unit of GDP, carbon emissions per capita, and carbon emissions per unit area (Table 2). In regression Eq. 1, the estimated coefficient of the lag 2 carbon emission variable is 0.84, which is significant at the 1% level. It shows that there is an obvious dynamic inertia effect in the carbon emissions of the Changsha-Zhuzhou-Xiangtan urban agglomeration. That is, the previous carbon emissions will have a positive effect on the current one. Judging from the estimated coefficients of the population spatial equilibrium index variable, the estimated coefficients of its primary and secondary terms are 6.52 and -5.28, which are significant at the 5% and 10% levels. It means that the carbon emission effect of the population spatial equilibrium of the Changsha-Zhuzhou-Xiangtan urban agglomeration shows an obvious inverted “U" shape. Among them, the inflection point value of the inverted “U" shape is 0.62, and the only regional samples located on the right side of it are Yuhua District, Yuelu District, Furong District, Kaifu District, and Changsha County in Changsha. It shows that the balanced development of population space in the regions mentioned above has entered the stage of carbon emission reduction effect, while other regions, except the core area of Changsha, have not yet entered the stage of carbon emission reduction, due to the low level of population space equilibrium.
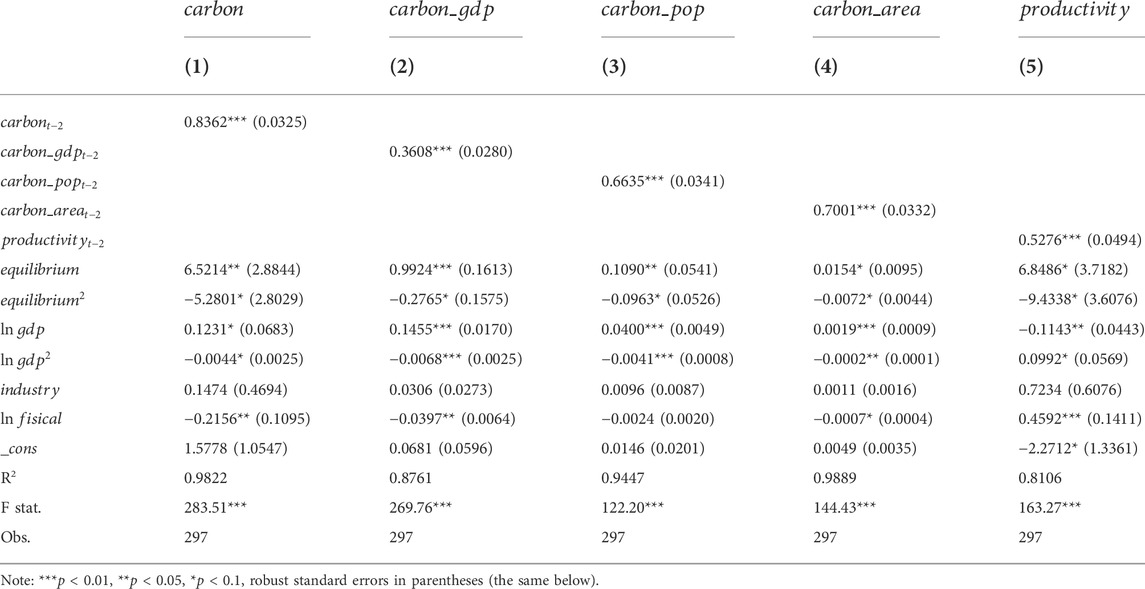
TABLE 2. Baseline regression estimation results.
Judging from the estimated coefficients of the variables of the economic development level, the estimated coefficients of the primary and quadratic terms are 0.12 and -0.004, respectively, and both are significant at the 10% level. It shows that there is an inverted “U"-shaped relationship between the carbon emissions of the Changsha-Zhuzhou-Xiangtan urban agglomeration and the economic development level. However, since the inflection point value is much larger than the maximum value of the economic development level, it can be shown that the inflection point of the Environmental Kuznets Curve of the Changsha-Zhuzhou-Xiangtan urban agglomeration has not yet come. Therefore, it is possible to promote the Changsha-Zhuzhou-Xiangtan urban agglomeration to cross the inflection point (carbon peak) of the environmental Kuznets curve by continuously advancing the economic development level of each region. The estimated coefficient of the industrial structure variable is 0.15 but not significant, which means that the change in the proportion of the secondary and tertiary industries has no significant net impact on the carbon emissions of the Changsha-Zhuzhou-Xiangtan urban agglomeration. The estimated coefficient of the government spending variable is -0.22 and is significant at the 5% level, indicating that strengthening government spending can help reduce carbon emissions in the Changsha-Zhuzhou-Xiangtan urban agglomeration. From the results of the significance test of the model, the R2 value of the estimated equation is 0.98, indicating that the econometric model can effectively explain about 98% of the information between the dependent variable and the independent variable. The F-statistic value is 283.51 and is significant at the 1% level, which proves that the econometric model is well set.
In regression Eqs 2–4, this paper replaces the total carbon emissions in regression Eq. 1 with carbon emissions per unit of GDP, carbon emissions per capital, and carbon emissions per unit of area. Further, the effect of the population spatial equilibrium index of the Changsha-Zhuzhou-Xiangtan urban agglomeration on the carbon emissions per unit of GDP, per capita carbon emissions, and carbon emissions per unit area is estimated. The results show that in the above three regression equations, the estimated coefficients of carbon emissions per unit of GDP, per capita carbon emissions, and carbon emissions per unit area of the two lag periods are 0.36, 0.66, and 0.70, respectively, and they are all significant at the 1% level. .It proves that the carbon emissions per unit GDP, per capital carbon emissions, and carbon emissions per unit area of Changsha-Zhuzhou-Xiangtan urban agglomeration also have dynamic inertia effects. In addition, judging from the estimated coefficients of the variables of the population spatial equilibrium index, the estimated coefficients of the primary term of the population spatial equilibrium index of the three regression equations are all significantly positive, and the estimated coefficients of the quadratic term are all significantly negative. It is proved that the effect of the population spatial equilibrium index of Changsha-Zhuzhou-Xiangtan urban agglomeration on the carbon emissions per unit of GDP, per capital carbon emissions, and carbon emissions per unit area is characterized by an inverted “U" trend. Among them, the inflection point values of the population spatial equilibrium index variables of regression Eqs 2, 4 are 1.79 and 1.06, respectively, which are both greater than the maximum value of the population spatial equilibrium index. It shows that the net effect of the Changsha-Zhuzhou-Xiangtan urban agglomeration spatial equilibrium index on carbon emissions per unit of GDP and carbon emissions per unit area is still on the left side of the inverted “U" shape. That is, the carbon emission reduction effect per unit of GDP and the carbon emission reduction effect per unit area have not yet arrived, and there is a long way to go to balance the population space. In the regression Eq. 3, the inflection point value of the population spatial equilibrium index variable is 0.566. It shows that the samples from other regions except Yuhua District, Yuelu District, Furong District, Kaifu District, Tianxin District, and Changsha County are all located on the left side of the inflection point value. That is to say, for most areas except the core area of Changsha City, the carbon reduction effect stage of per capita GDP has not yet arrived. To sum up, the population spatial equilibrium level of the Chang-Zhu-Tan urban agglomeration is still low, and most areas have not yet reached the stage of carbon emission reduction per unit GDP, per capita GDP carbon emission reduction effect, and carbon emission reduction effect per unit area. Because the other control variables have the same estimation results as regression Eq. 1, they will not be repeated here.
Now that when the population spatial equilibrium index of the Changsha-Zhuzhou-Xiangtan urban agglomeration reaches a certain level, there is a significant carbon emission reduction effect. So, can the spatial equilibrium of population seek the dual goals of environmental effect and economic effect? In response to this question, this paper also estimates the effect of the population spatial equilibrium index on labor productivity based on the econometric model (8) regression. From the estimation results of regression Eq. 5, the estimated coefficient of the labor productivity variable with lag 2 is 0.53 and is significant at the 1% level. It shows that the labor productivity of the Changsha-Zhuzhou-Xiangtan urban agglomeration also exhibits a dynamic inertia effect, that is, the higher the labor productivity level in the previous period, the higher the labor productivity level in the current period. From the estimation results of the population spatial equilibrium index variable, the estimated coefficients of the primary and secondary terms are 6.85 and −9.43, respectively, and both are significant at 10%.It means that there is also an inverted “U”-shaped relationship between the population spatial equilibrium index and labor productivity of the Changsha-Zhuzhou-Xiangtanurban urban agglomeration. Moreover, for the vast majority of regional samples, improving the population spatial equilibrium index will help to promote the level of labor productivity.
Statistics show that the existence of regional heterogeneity makes the carbon emissions respond differently to the population spatial equilibrium index in different regions of the Changsha-Zhuzhou -Xiangtan urban agglomeration. In order to verify this inference, we use Quantile Regression Model (QRM) to further investigate the differentiated effect of population spatial equilibrium on carbon emission at different quantiles. Table 3 reports the response of carbon emissions per capital (
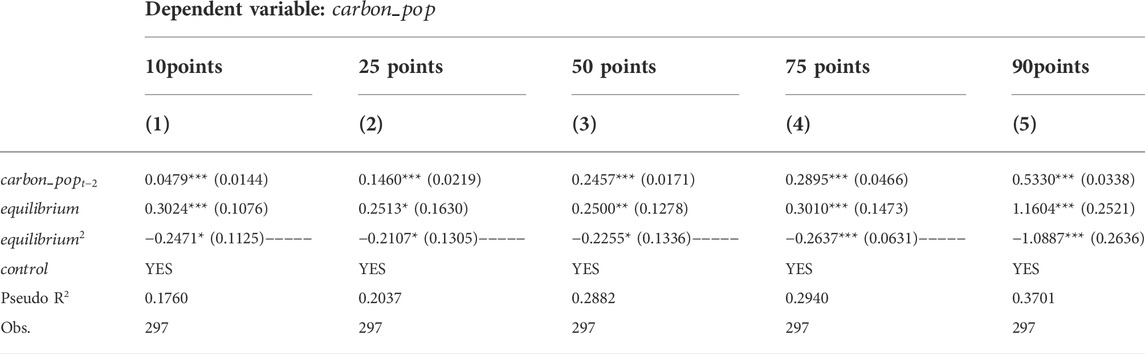
TABLE 3. Quantile regression estimation results.
The estimation results in Table 3 show that the estimated coefficients of per capita carbon emissions variables are significantly positive in the five groups of estimation equations, and the impact coefficients show a trend of increasing with the increase of quantiles. This shows that regions with higher per capita carbon emissions have greater dynamic inertia effects. That is to say, for regions with high per capita carbon emissions, the current per capita carbon emissions are more affected by the per capitl carbon emissions in the previous period. Judging from the estimated coefficients of the population spatial equilibrium index variable, the estimated coefficients of the primary terms in the five groups of estimation equations are all significantly positive, and the estimated coefficients of the quadratic terms are all significantly negative. It means that the inverted “U”-shaped relationship between the population spatial equilibrium index and per capital carbon emissions still exists significantly. Moreover, the inflection point values of the population spatial equilibrium index variables are 0.61, 0.60, 0.55, 0.57, and 0.53, respectively, showing a trend of gradually decreasing as the quantile increases. This shows that at high quantiles, there are more samples in areas with emission reduction effects.
The research of Adger et al. (2021) shows that the spatial distribution of population is significantly related to its perception of local environmental risks and insecurity. This means that the local legal environment will have a certain impact on the spatial distribution and its evolution of population, and then act on carbon emission reduction. To verify this inference, we refer to Wu et al. (2020) and introduce the interaction term between legal environment variable and population spatial equilibrium index into the benchmark estimation equation, and then explore whether the carbon emission reduction effect of population spatial equilibrium will be regulated by legal environment. In order to identify the above effects, we constructed a moderating effect recognition mechanism model in formula 10.
Where, the variable
According to the estimation results of the moderating effect model reported in Table 4, after introducing the interaction term between the population spatial equilibrium index and the legal environment variables, the estimation results of the lag term of the dependent variables and the explanatory variables in each estimation equation are basically consistent with the benchmark regression estimation results. However, from the estimation results of interactive terms, the legal environment has a significant moderating effect on only one term of the population spatial equilibrium index, and is limited to the estimation equation of carbon emissions, per capita carbon emissions, and carbon emissions per unit area. The legal environment has no significant regulatory effect on the quadratic term of population spatial equilibrium index. It shows that the legal environment can indeed have a moderating effect between population spatial equilibrium and carbon emissions, that is, by acting on population spatial equilibrium to reduce carbon emissions, per capita carbon emissions, carbon emissions per unit area.
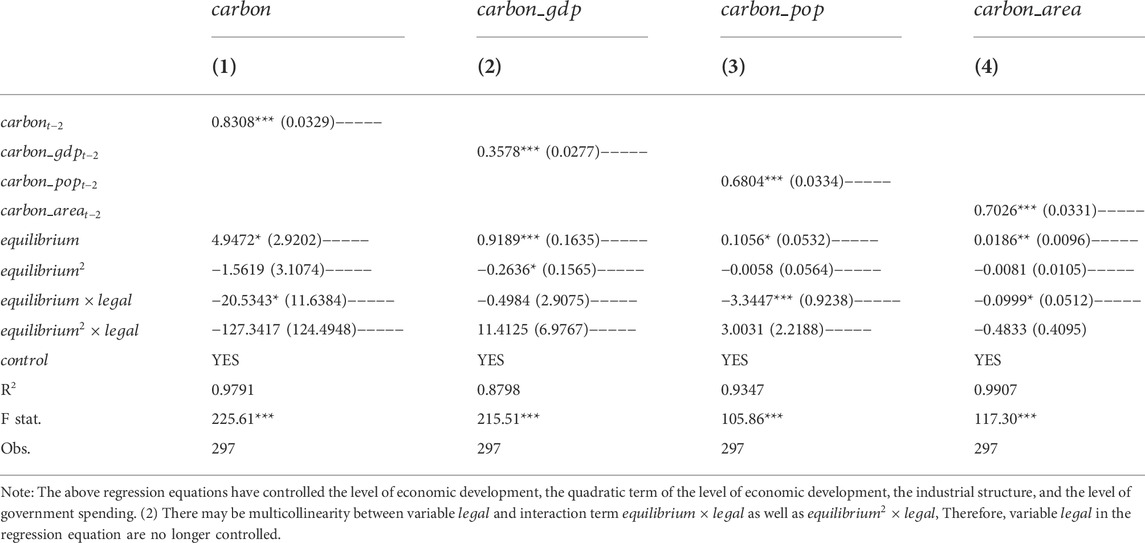
TABLE 4. Moderating effect estimation results.
Low-carbon green development is the only way for high-quality economic and social development of future urban agglomerations. And the key to realizing the low-carbon and green development of urban agglomerations is to seek a scientific and reasonable spatially balanced population structure. Based on the coupled coordination degree model, this paper constructs a population spatial equilibrium index including population, industry and housing, and uses exploratory spatial data analysis (ESDA) to analyze the temporal trend characteristics and spatial differentiation characteristics of population spatial equilibrium in the Changsha-Zhuzhou -Xiangtan urban agglomeration. Finally, a nonlinear dynamic panel econometric model and a quantile regression model were constructed to empirically investigate the net effect of the Changsha-Zhuzhou-Xiangtan urban agglomeration population spatial equilibrium index on carbon emissions, carbon emissions per unit of GDP, carbon emissions per capita, and carbon emissions per unit area and its heterogeneity. The following were research findings: (1)Although the population spatial equilibrium index of the Changsha-Zhuzhou-Xiangtan urban agglomeration is on the rise, the overall level is not high and the internal gap is obvious. Zhuzhou and Xiangtan are significantly behind Changsha. From the perspective of the spatial evolution pattern, the population spatial equilibrium index shows a trend of concentration in the central urban area of Changsha. (2)The total carbon emissions, carbon emissions per unit GDP, per capita carbon emissions, and carbon emissions per unit area of the Changsha-Zhuzhou-Xiangtan urban agglomeration all have obvious dynamic inertia effects and pathway dependence characteristics. That is, the carbon emissions of the previous period will significantly promote the carbon emissions of the current period. (3)The net effects of population spatial equilibrium on total emissions, carbon emissions per unit of GDP, carbon emissions per capita, and carbon emissions per unit area all show an inverted “U"-shaped characteristic of rising first and then falling, and the samples located on the right side of the inflection point are fewer. This shows that for most areas of the Changsha-Zhuzhou-Xiangtan urban agglomeration, the spatial equilibrium level of population is too low to achieve carbon emission reduction. Therefore, it is more urgent to improve the spatial equilibrium level of the population and make it pass the critical point. (4) The net effect of regional economic development level on carbon emissions is still on the left side of the environmental Kuznets curve. It shows that the Changsha-Zhuzhou-Xiangtan urban agglomeration urgently needs to improve the level of economic development and realize the carbon emission reduction effect. In addition, increasing government spending will help improve the carbon reduction efficiency of various regions. (5) For most regions, improving the spatial balance of population will not only help to promote carbon emission reduction effects, but also improve local labor productivity and facilitate high-quality economic development. (6) The legal environment helps to promote the spatial balance of population, thereby reducing the regional total carbon emissions, per capita carbon emissions and carbon emissions per unit area.
The low-carbon development of China’s population urbanization is inseparable from a better balanced population space structure. In order to optimize the population space structure of urban agglomerations, help reduce carbon emissions, and achieve high-quality economic and social development, our findings have some policy implications: Firstly, improve the spatial balance of population, industry and housing. According to the changes in the spatial structure of the population, we will further improve the urban transportation infrastructure, build a reasonable transportation structure, and improve the “separation of work and housing” within the city, so as to reduce the carbon emissions of residents’ commuting and travel, and improve labor productivity. However, it is necessary to avoid excessive coordination in pursuit of population space balance, so as not to lead to waste of public resources. Secondly, continue to promote the level of economic development in various regions. Optimize the industrial structure, formulate corresponding economic development policies according to the industrial structure characteristics of Changsha, Zhuzhou and Xiangtan, and improve the level of division of labor within the urban agglomeration; cultivate emerging pillar industries such as new generation information technology, green and low-carbon manufacturing, achieve high-quality development, and promote The Changsha-Zhuzhou-Xiangtan urban agglomeration has crossed the inflection point of the environmental Kuznets curve, that is, the carbon peak point, thus entering the stage of urban carbon emission reduction and achieving a win-win situation for the economy and the environment. Finally, strengthen government financial support. On the one hand, improve the effectiveness and accuracy of government spending. Use government spending to support the transformation of industrial enterprises, develop innovative green technologies, establish a sound carbon emissions trading market and other fields, and vigorously develop advanced manufacturing, modern agriculture and high-end service industries. On the other hand, the balance of population spatial structure is a long-term and dynamic process of adjustment and optimization. The government should make long-term budget planning, give financial subsidies to areas with low population spatial balance index, and strengthen overall coordination.
The original contributions presented in the study are included in the article/supplementary material, further inquiries can be directed to the corresponding author.
W-PW: Conceptualization, Writing–original draft, Software. W-HX: Supervision, Methodology, Writing–review and editing JJ: Data curation, Visualization J-JZ: Data curation, Writing–review and editing Q-XX: Methodology, Software.
This research is supported by the National Natural Science Foundation of China (Project No. 71903056), Philosophy and Social Science Foundation of Hunan Province in China (Project No. 18YBQ075), Natural Science Foundation of Hunan Province in China (Project No. 2020JJ5104), Scientific Research Project of Hunan Education Department in China (Project No. 21B0573), Education and Science Planning Project of Zhejiang Province (Project No. 2020SCG127), Research and Innovation Project for Graduate Students in Hunan Province, and Alibaba Running Water Project from Alibaba (China) Co., Ltd. The funder was not involved in the study design, collection, analysis, interpretation of data, the writing of this article or the decision to submit it for publication.
The authors declare that the research was conducted in the absence of any commercial or financial relationships that could be construed as a potential conflict of interest.
All claims expressed in this article are solely those of the authors and do not necessarily represent those of their affiliated organizations, or those of the publisher, the editors and the reviewers. Any product that may be evaluated in this article, or claim that may be made by its manufacturer, is not guaranteed or endorsed by the publisher.
1The reason for controlling the quadratic term of the variable of economic development level is to verify the existence of the Environmental Kuznets Inverted “U” Curve of the Changsha-Zhuzhou-Xiangtan urban agglomeration.
2Referring to the general practice of the existing literature, the article takes the lag value of 2 periods for the dependent variable. Generally speaking, it is difficult to capture the dynamic effect when the value lags behind for 1 period, and too much lag will reduce the number of samples and degrees of freedom.
3Here we only discuss the quantile regression results of the population spatial equilibrium index of the Changsha-Zhuzhou-Xiangtan urban agglomeration on per capita carbon emissions. There are two main reasons for this.First, it has been confirmed in the previous article that the effects of population spatial equilibrium on carbon emissions, carbon emissions per unit of GDP, per capita carbon emissions, and carbon emissions per unit area are similar. Second, this paper focuses more on the carbon emission reduction effect of the population dimension, so it is more practical to examine the heterogeneity of the population spatial equilibrium index on per capita carbon emissions.
Adger, W. N., Campos, R., Codjoe, S., Siddiqui, T., Hazra, S., Das, S., et al. (2021). Perceived environmental risks and insecurity reduce future migration intentions in hazardous migration source areas. One Earth 4 (1), 146–157. doi:10.1016/j.oneear.2020.12.009
Chen, L. L., Chen, Z. L., Guo, D. J., Zhao, Z. W., Lin, T., and Zhang, C. H. (2022). Underground space use of urban built-up areas in the central city of Nanjing: Insight based on a dynamic population distribution. Undergr. Space 24. doi:10.1016/j.undsp.2021.12.006
Fan, J., Zhou, L., Zhang, Y., Shao, S., and Ma, M. (2021). How does population aging affect household carbon emissions? Evidence from Chinese urban and rural areas. Energy Econ. 100 (2), 105356. doi:10.1016/j.eneco.2021.105356
Fang, C., Cui, X., Li, G., Bao, C., Wang, Z., Ma, H., et al. (2019). Modeling regional sustainable development scenarios using the Urbanization and Eco-environment Coupler: Case study of Beijing-Tianjin-Hebei urban agglomeration, China. Sci. Total Environ. 689, 820–830. doi:10.1016/j.scitotenv.2019.06.430
Glaeser, E. L., and Kahn, M. E. (2010). The greenness of cities: Carbon dioxide emissions and urban development. J. Urban Econ. 67, 404–418. doi:10.1016/j.jue.2009.11.006
Goel, R. K., and Vishnoi, S. (2022). Urbanization and sustainable development for inclusiveness using ICTs. Telecommun. Policy 46 (6), 102311. doi:10.1016/j.telpol.2022.102311
Hu, Y., and Hu, Z. W. (2019). Analysis on the coupling coordination degree of the new urbanization subsystem in the Yangtze River delta—based on the perspectives of economy, population, space, environment and society. Commer. Sci. Res. 26 (4), 39–48. (In Chinese). doi:10.3969/j.issn.1008-2107.2019.04.005
Kim, J. H. (2002). Changes in consumption patterns and environmental degradation in korea. Struct. Chang. Econ. Dyn. 13 (1), 1–48. doi:10.1016/s0954-349x(01)00030-3
Lee, S. H., Taniguchi, M., Masuhara, N., Mohtar, R. H., and Haraguchi, M. (2021). Analysis of industrial water–energy–labor nexus zones for economic and resource-based impact assessment. Resour. Conservation Recycl. 169 (4), 105483. doi:10.1016/j.resconrec.2021.105483
Li, J. Z., Ouyang, X., and Zhu, X. (2021). Land space simulation of urban agglomerations from the perspective of the symbiosis of urban development and ecological protection: a case study of changsha-zhuzhou-xiangtan urban agglomeration. Ecol. Indic. 126, 107669. doi:10.1016/j.ecolind.2021.107669
Li, J. J., Shi, J. G., Duan, K. F., Li, H., Zhang, Y. W., and Xu, Q. W. (2022). Efficiency of China's urban development under carbon emission constraints: A city-level analysis. Phys. Chem. Earth Parts A/B/C 127, 103182. doi:10.1016/j.pce.2022.103182
Liang, L., Zhang, F., Wu, F., Chen, Y. X., and Qin, K. Y. (2022). Coupling coordination degree spatial analysis and driving factor between socio-economic and eco-environment in northern China. Ecol. Indic. 135, 108555.
Liu, T. X., and Deng, H. L. (2018). Financial development and labor productivity growth in China—an empirical analysis based on panel instrumental variable model. Commer. Sci. Res. 25 (1), 10–23. (In Chinese). doi:10.3969/j.issn.1008-2107.2018.01.002
Liu, K., Xue, M. Y., Peng, M. J., and Wang, C. X. (2020). Impact of spatial structure of urban agglomeration on carbon emissions: An analysis of the Shandong Peninsula, China. Technol. Forecast. Soc. Change 161, 120313. doi:10.1016/j.techfore.2020.120313
Ouyang, X., Xu, J., Li, J., Wei, X., and Li, Y. (2022). Land space optimization of urban-agriculture-ecological functions in the Changsha-Zhuzhou-Xiangtan Urban Agglomeration, China. Land Use Policy 117, 106112. doi:10.1016/j.landusepol.2022.106112
Park, H. C., and Heo, E. (2007). The direct and indirect household energy requirements in the Republic of Korea from 1980 to 2000—an input-output analysis. Energy Policy 35 (5), 2839–2851. doi:10.1016/j.enpol.2006.10.002
Soytas, U., and Sari, R. (2009). Energy consumption, economic growth, and carbon emissions: Challenges faced by an EU candidate member. Ecol. Econ. 68 (6), 1667–1675. doi:10.1016/j.ecolecon.2007.06.014
Soytas, U., Sari, R., and Ewing, B. T. (2007). Energy consumption, income, and carbon emissions in the United States. Ecol. Econ. 62 (3-4), 482–489. doi:10.1016/j.ecolecon.2006.07.009
Wang, Q., and Wang, L. (2020). The nonlinear effects of population aging, industrial structure, and urbanization on carbon emissions: A panel threshold regression analysis of 137 countries. J. Clean. Prod. 287 (1), 125381. doi:10.1016/j.jclepro.2020.125381
Wang, Y., Niu, Y., Li, M., Yu, Q., and Chen, W. (2021). Spatial structure and carbon emission of urban agglomerations: Spatiotemporal characteristics and driving forces. Sustain. Cities Soc. 78, 103600. doi:10.1016/j.scs.2021.103600
Wang, Y. N., Yin, S. W., Fang, X. L., and Chen, W. (2022). Interaction of economic agglomeration, energy conservation and emission reduction: Evidence from three major urban agglomerations in China. Energy 241, 122519. doi:10.1016/j.energy.2021.122519
Wang, Y. F. (2022). Analysis on the evolution of spatial relationship between population and economy in the Beijing-Tianjin-Hebei and Shandong region of China. Sustain. Cities Soc. 83, 103948. doi:10.1016/j.scs.2022.103948
Wei, L. Y., and Liu, Z. (2022). Spatial heterogeneity of demographic structure effects on urban carbon emissions. Environ. Impact Assess. Rev. 95, 106790. doi:10.1016/j.eiar.2022.106790
Wu, W. P., Chen, Z. G., and Yang, D. X. (2020). Do internal migrants crowd out employment opportunities for urban locals in China?—reexamining under the skill stratification. Phys. A Stat. Mech. its Appl. 537, 122580. doi:10.1016/j.physa.2019.122580
Wu, W. P., Yan, J. J., Chen, Y. H., Wang, Z. J., and Lin, Y. R. (2022). Has environmental policy improved the job quality of migrant workers? A quasi-natural experiment on China’s clean air action. J. Clean. Prod. 347, 131231. doi:10.1016/j.jclepro.2022.131231
Xia, C. Y., Xiang, M. T., Fang, K., Li, Y., Ye, Y. M., Shi, Z., et al. (2020). Spatial-temporal distribution of carbon emissions by daily travel and its response to urban form: A case study of hangzhou, China. J. Clean. Prod. 257, 120797. doi:10.1016/j.jclepro.2020.120797
Xiong, Y., Yang, T. H., Wang, C., and Zhang, K. (2021). Evaluation and analysis of the integrated development of Changsha-Zhuzhou-Xiangtan urban agglomeration. Commer. Sci. Res. 28 (1), 33–41. (In Chinese). doi:10.3969/j.issn.1008-2107.2021.01.004
Yang, Y., Li, Y., and Guo, Y. D. (2022). Impact of the differences in carbon footprint driving factors on carbon emission reduction of urban agglomerations given SDGs: A case study of the guanzhong in China. Sustain. Cities Soc. 85, 104024. doi:10.1016/j.scs.2022.104024
Yu, Q. Y., Li, M., Li, Q., Wang, Y. N., and Chen, W. (2022). Economic agglomeration and emissions reduction: Does high agglomeration in China's urban clusters lead to higher carbon intensity? Urban Clim. 43, 101174. doi:10.1016/j.uclim.2022.101174
Keywords: population spatial equilibrium, carbon emission reduction effect, heterogeneity effect, spatiotemporal differences, Changsha-Zhuzhou-Xiangtan urban agglomeration
Citation: Wu W-P, Xie W-H, Jing J, Zhao J-J and Xu Q-X (2022) Spatiotemporal differences of population spatial equilibrium in urban agglomeration and its carbon emission reduction effect: A case study in China. Front. Energy Res. 10:985359. doi: 10.3389/fenrg.2022.985359
Received: 03 July 2022; Accepted: 04 August 2022;
Published: 30 August 2022.
Edited by:
Tsun Se Cheong, Hang Seng University of Hong Kong, ChinaReviewed by:
Shihu Zhong, Shanghai National Accounting Institute, ChinaCopyright © 2022 Wu, Xie, Jing, Zhao and Xu. This is an open-access article distributed under the terms of the Creative Commons Attribution License (CC BY). The use, distribution or reproduction in other forums is permitted, provided the original author(s) and the copyright owner(s) are credited and that the original publication in this journal is cited, in accordance with accepted academic practice. No use, distribution or reproduction is permitted which does not comply with these terms.
*Correspondence: Jing-Jing Zhao, MjAxNDMxMDEzMUBsaXZlLnN1ZmUuZWR1LmNu
Disclaimer: All claims expressed in this article are solely those of the authors and do not necessarily represent those of their affiliated organizations, or those of the publisher, the editors and the reviewers. Any product that may be evaluated in this article or claim that may be made by its manufacturer is not guaranteed or endorsed by the publisher.
Research integrity at Frontiers
Learn more about the work of our research integrity team to safeguard the quality of each article we publish.