 Xiaoyan Su
 Xuefan Guan
 Zhihui Xu2
95% of researchers rate our articles as excellent or good
Learn more about the work of our research integrity team to safeguard the quality of each article we publish.
Find out more
ORIGINAL RESEARCH article
Front. Energy Res. , 27 September 2022
Sec. Electrochemical Energy Storage
Volume 10 - 2022 | https://doi.org/10.3389/fenrg.2022.978767
This article is part of the Research Topic Artificial Intelligence Applications in Low Carbon Renewable Energy and Energy Storage Systems, Volume II View all 4 articles
Decision-making methods are widely used in renewable energy source (RES) investment. In practical applications, various conditions need to be considered during the decision-making process, such as uncertainty and reliability of information, dependence among criteria, and different risk preferences of the decision makers. However, there is currently a lack of effective consideration of all these conditions. In this article, a new decision-making method based on Z-DEMATEL and the maximal entropy OWA operator is proposed, where Z-number is used to characterize the uncertainty and reliability of the information, decision-making trial and evaluation laboratory (DEMATEL) technique, and the maximal entropy ordered weighted average (OWA) operator are used to deal with dependence and risk preference, respectively. The application example in RES investment and discussions show the effectiveness and the advantages of the proposed method.
Nowadays, worldwide nations are actively developing and employing renewable energy sources (RESs) based on their respective economic development objectives and resource conditions (Barbier, 1987). The development of RES can achieve sustainable development of energy use, promote economic growth, and alleviate environmental pressure (Ahmed et al., 2021; Kihombo et al., 2021). The investment of RES can protect the environment while maintaining economic efficiency (Mohsin et al., 2021; Dincer, 2000). Therefore, the investment of RES has received increasing attention in recent years (Peng et al., 2019).
RES generally refers to the five mainstream energy sources, namely, solar energy (Vagiona, 2021), wind energy (Meng et al., 2022a), biomass energy (Abdul et al., 2022), geothermal energy (Huang, 2022), and hydropower energy (Bohra and Anvari-Moghaddam, 2021). Constrained by the actual local situation, the characteristics of RES, and the limited amount of investment, etc., it is impossible to develop all five RESs at the same place and at the same time. Thus, it is necessary to construct an effective RES evaluation model to support decision making in RES investment.
RES investment is a complex multi-criteria (attributes) decision-making (MCDM) problem that combines multiple criteria and requires the participation of multiple experts (Lak Kamari et al., 2020). The criteria used in RES investment can be grouped into two categories: economic criteria and non-economic criteria. The economic criteria can be subdivided into earnings (He et al., 2019), asset (Chang et al., 2019), and equity (Zhou et al., 2019). Non-economic criteria include environmental impacts (Wang C.-H. et al., 2021), organizational capacity (Samour et al., 2022), and technological infrastructure (Strantzali and Aravossis, 2016).
In the practical decision making in RES investment, various situations need to be considered, such as uncertainty and reliability of information, dependencies among criteria, and different risk preferences of decision makers. The aforementioned situations are often unavoidable and can affect the decision result. If not considered and handled properly, they may lead to unreasonable decision results and significant losses.
The uncertainty of information in the RES investment decision process attributes to the subjectivity of domain experts and the complexity of the evaluation objects. The existing methods for dealing with uncertain information are fuzzy set theory (Bilgili et al., 2022; Van Thanh, 2022; Saraswat and Digalwar, 2021), grey theory (Wang C.-N. et al., 2021; Almutairi et al., 2022), Dempster–Shafer (D–S) evidence theory (Deng and Jiang, 2020; Xiong et al., 2021; Xiao, 2021), D-number theory (Deng and Jiang, 2019b,a), and Z-number theory (Rathore et al., 2021; Tian and Kang, 2020; Li et al., 2020; Jiang et al., 2020). Among them, Z-number can represent the uncertainty and the reliability of evaluating information simultaneously (Hu and Lin, 2022; Cheng et al., 2022; Tian et al., 2021; Meng et al., 2022b), which is superior in the modeling of uncertainties in RES investment. Thus, Z-number is utilized to model the uncertainty of the opinions of experts’ evaluations in this article.
The interdependence among criteria in the RES investment decision-making process is usually the case. For instance, there is a positive relationship between economic criteria earnings and equity. When the proportion of equity is high, profits increase proportionally. When the earnings increase, investors are encouraged to make more investments, which increases in equity. Such interdependence can lead to redundant consideration and calculation of certain criteria during the evaluation process, resulting in an unreasonable decision outcome (Gao et al., 2022; Wang, 2022).
To determine the relationships among criteria in the decision-making of RES investment, analytic hierarchy process (AHP) (Ulewicz et al., 2021; Karatop et al., 2021; Sedghiyan et al., 2021), stepwise weight assessment ratio analysis (SWARA) (Dinçer et al., 2022; Keleş et al., 2022; Rani et al. (2021), and decision-making trial and evaluation laboratory (DEMATEL) technique Li et al. al., 2022; Xie et al., 2021; Zhang and Deng, 2019) are frequently applied. Among these methods, AHP only takes into account the hierarchy structure of the criteria; SWARA only considers the hierarchical priorities of the experts. DEMATEL can construct coupling and dependence relationships among criteria based on graph theory (Liu et al., 2018; Wang, 2022). Hence, this article addresses the issue of interdependence among criteria using DEMATEL and further develops DEMATEL with Z-number to represent the uncertain information the experts entered.
In addition, the risk preferences of decision makers also play an important role in the RES investment decision process. Risk preferences of decision makers can be classified into three main categories: adventurism, moderatism, and conservatism. Of course, there are other risk preferences in between them. In order to quantify the risk preference of the decision maker, the OWA operator is proposed YAGER, (1993) in 1988, O’Hagan, (1988), Fuller and Majlender, (2000) proposed the maximal entropy OWA operator, which maps risk preferences (in the form of a real number between [0, 1] where 0 refers to conservatism and 1 refers to adventurism) to the weights of alternatives. The maximal entropy OWA operator provides a practical tool for using OWA in dealing with the risk preference of the decision maker (Li and Deng, 2018) and has not yet been introduced to RES investment. Therefore, this article investigates the impact of decision makers’ risk preferences on decision results of RES investment based on the maximal entropy OWA operator.
To address the aforementioned issues in RES investment, we propose a new decision-making method based on Z-DEMATEL and OWA: Z-number is used to characterize the uncertainty and reliability of the information (evaluations from experts); the DEMATEL technique is used to model the interdependence among criteria; the maximal entropy OWA operator is applied to represent the impact of the risk preferences of the decision makers. The proposed method in this article allows the decision system to take into account the uncertainty and reliability of the information, the interdependence among criteria and the risk preferences of the decision makers, which achieves more reasonable decision results and makes the decision system applicable to a wider range of practical situations.
The rest of the article is organized as follows. Section 2 introduces fuzzy sets, Z-number theory, DEMATEL, and the maximal entropy OWA operator. In Section 3, the framework and specific procedures of the proposed method, along with examples, are described. In Section 4, the proposed method is applied to a RES investment problem, and comparison results and further discussions are given to show the effectiveness and advantages of the proposed method. Section 5 concludes this article.
Fuzzy set theory, proposed by Zadeh (1965), converts the linguistic variables into numerical values, where the definition of imprecision is a degree of membership. The concept of fuzzy sets is briefly introduced as follows.
Definition 1: fuzzy sets.
Let μA(x) be a membership function, and a fuzzy number is defined as a fuzzy set such that
Definition 2: triangular fuzzy number.
A triplet (a1, a2, a3), where a1 < a2 < a3 ∈ R, can assemble to be a triangular fuzzy number (TFN) A, where the membership can be determined as follows:
The membership of TFN is shown in Figure 1.
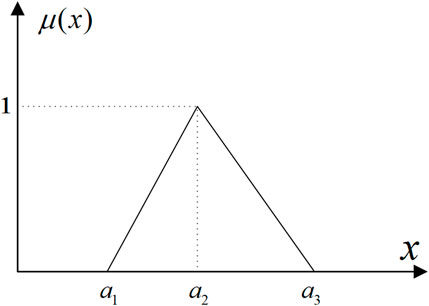
FIGURE 1. Triangular fuzzy number A = (a1, a2, a3).
Due to the excellent ability to describe uncertain events, TFNs are widely used in decision making. Considering the amount of computation and computational complexity in practical applications, converting a TFN to a crisp number is necessary. Yao and Wu (2000) propose a defuzzification method based on the signed distance method to process TFN. The signed distance of triangular fuzzy numbers is defined as follows, while the signed distance of trapezoidal fuzzy numbers and other fuzzy numbers is found in Yao and Wu (2000).
Definition 3: the signed distance of triangular fuzzy number.
Let A be a family of fuzzy numbers on R. α-cut (0 ≤ α ≤ 1) of a fuzzy set A = (a1, a2, a3) is an α-level set
Then
To be more precise:
Resulting in
The sign distance is defined as d(a, b) = a − b if a, b ∈ R. Let F be a family of fuzzy numbers of R. For
For
Definition 4: Z-number.
The Z-number Z = (A, B) is proposed by Zadeh (2011) to model uncertain information X that is uncertain, imprecise, and/or incomplete. The ordered triple (X, A, B) is called the Z-valuation, where X is (A, B).
The Z-number Z = (A, B) is associated with the real-valued uncertain variable X, where the component A plays a restriction R(X) on X. When the restriction R(X) refers to a possible restriction, the component A represents the probability distribution of X and is expressed as:
where μA is the membership function of A and u is a generic value of X. In addition, the Z-valuation (X, A, B) may be viewed as a restriction on X defined by:
Definition 5: decision-making trial and evaluation laboratory.
Decision-making trial and evaluation laboratory (DEMATEL) (Gabus and Fontela, 1972), is an efficient technique for extracting the strength of relationships and inter-dependencies between elements through graph theory and matrix (Si et al., 2018). The following are five brief procedures of DEMATEL.
Step 1: establish the element direct-influence matrix Y. The crisp direct-influencing matrix Y = [Yij] (i = 1, 2, … , n; j = 1, 2, … , n), where the element Yij presents the influence relationship of the element Ci into the element Cj.
Step 2: normalize the element direct-influence matrix X. The normalized direct-influencing matrix X = [Xij](i = 1, 2, … , n; j = 1, 2, … , n) is obtained as
where
Step 3: acquire the element total influence matrix T. The total influence matrix
Step 4: construct the influential relation. The sum of rows F = [Fi] (i = 1, 2, … , n) of the element total influence matrix T presents the influencing degree, which denotes the comprehensive impact of the element ci on other elements and the sum of columns E = [Ej] (j = 1, 2, … , n) of the element total influence matrix T presents the synthesized impact of the influence of other factors on the factor Ci. The process of derivation of the influential relation is obtained as follows:
Step 5: calculate the centrality and causality. The centrality M = [Mi] (i = 1, 2, … , n) reflects the importance of the element Ci in the whole system, and causality N = [Ni] (i = 1, 2, … , n) reflects the influence of the element Ci on other factors. If Ni > 0, it presents that the element Ci owns a greater influence on other elements. If Ni < 0, it indicates that the element Ci is greatly influenced by other elements. The solution of the centrality and causality is acquired as follows.
Definition 6: ordered weighted average.
Ordered weighted average (OWA), introduced by YAGER (1993), is an aggregation function that combines assessment with ordered positions instead of directly associating weights. An OWA operator for a set of n-dimensional values can be expressed as follows:
where bi is the ith largest aggregated value in a1, a2, … , an and the relationship of b as b1 ≥ b2 ≥⋯ ≥ bn. OWA(a1, a2, … , an) determines the aggregated value of arguments a1, a2, … , an. The weight wi (i = 1, 2, … , n) is not related to any ai but to the ordinal position of bi.
YAGER (1993) introduces two important feature measures on the weight vector w = [wi] of the OWA operator. One of the two measures is the aggregated orness defined as follows.
where orness(w) = α is a situation parameter and satisfies orness(w) ∈ [0, 1].
The second important measurement introduced by YAGER (1993) is a measuring aggregated dispersion as follows.
Definition 7: maximal entropy OWA operator weights.
O’Hagan (1988) combines the principle of maximal entropy OWA operator weights to propose a specific OWA weight calculation method, which has maximal entropy under the condition of given orness. The method which satisfies the requirement as
Fuller and Majlender (2000) convert Yager’s OWA operator into a polynomial equation by utilizing the method of Lagrange multipliers, which meets the maximal entropy of Eq. 22 and the requirement of Eq. 23. The relevant weight vector can be obtained by the following equation.
For 1 ≤ j ≤ n, wj is obtained as follows:
where
and
where n is the number of criteria, w is the weight vector and α is the situation parameter. The optimal value of w1 satisfies Eq. 26. Once w1 is achieved, wn can be obtained by Eq. 25, and the other weights are generated by Eq. 24.
The framework of the proposed method is shown in Figure 2. The steps are described as follows.
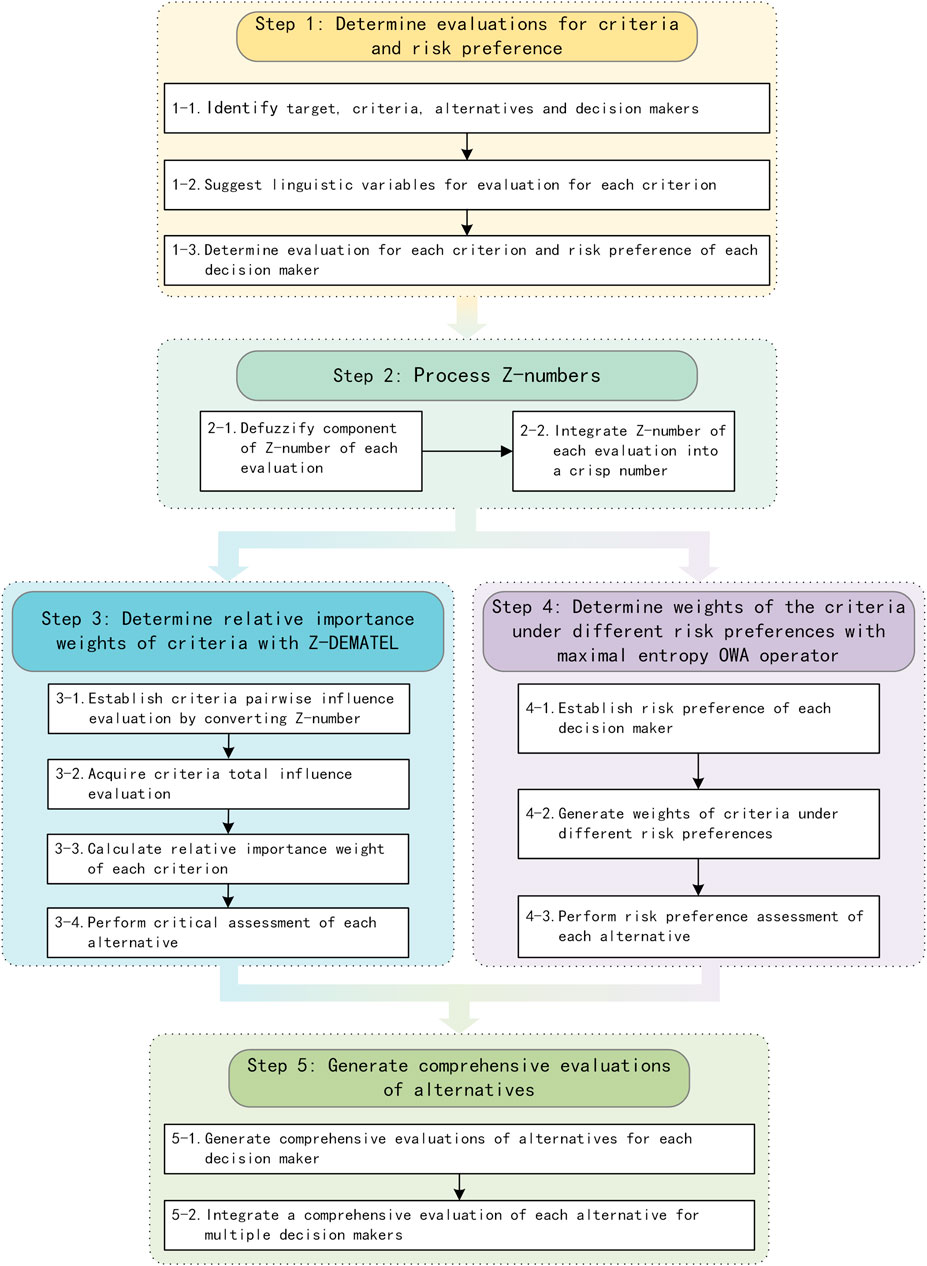
FIGURE 2. Framework of the proposed approach.
The essential components of decision making are target, influencing factors, and decision makers. Moreover, when multiple decision makers are involved in the decision-making process, the risk preference of each decision maker can have a substantial effect on the evaluation. Thus, this section is primarily responsible for identifying the target, influencing factors, decision makers, linguistic variable terms suggested for evaluation, and risk preferences of the decision makers.
Let a set of n decision criteria be C = [Ci] (i = 1, 2, … , n), where Ci presents the ith criterion. The set of m possible alternatives is denoted as S = [St](t = 1, 2, … , m), where St presents the tth alternative. DM = [DMk](k = 1, 2, … , l) is the set of l decision makers with professional knowledge, where DMk presents the kth decision maker. Moreover, the hierarchy of alternatives and criteria is constructed by the decision makers after identifying the criteria and alternatives.
Suggesting the appropriate linguistic variables for the evaluation of alternatives under certain criteria is of utmost importance. Table 1 shows one possible suggestion of the linguistic variables for the evaluation from “Worst” to “Best.” Table 2 shows the linguistic variables for the reliability of evaluation from “Very low” to “Very high.” The linguistic variables can be expressed in terms of TFNs as shown in the last column in Tables 1, 2, whose membership function can be determined by using historical data or experts’ opinions.
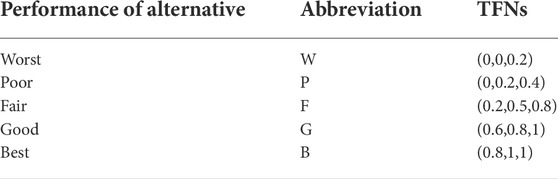
TABLE 1. Linguistic variable for the evaluation of alternatives (component A of Z-number).
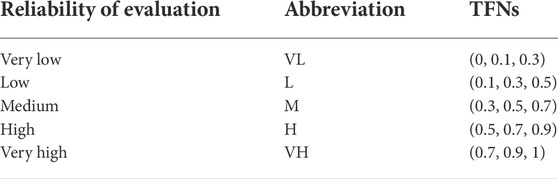
TABLE 2. Linguistic variable for the reliability of evaluation (component B of Z-number).
The linguistic variables for the evaluations of the alternatives under a criterion constitute the component A of Z-numbers. For example, linguistic variable “B” in Table 1 means the evaluation of an alternative under a certain criterion is “best” and its corresponding TFN is (0.8, 1, 1). Figure 3 shows the membership functions of TFNs in Table 1 for visualization.
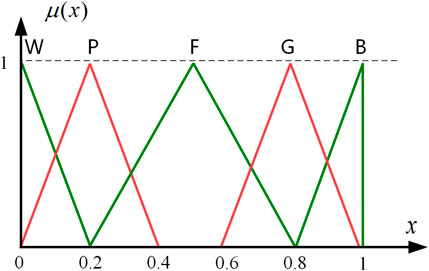
FIGURE 3. Membership functions of TFNs of linguistic variables in Table 1.
The linguistic variables for the reliability of evaluations constitute the component B of Z-numbers. For instance, the linguistic variable “VH” means the reliability of the evaluation is “very high.” Figure 4 shows the membership functions of TFNs in Table 2 for visualization.
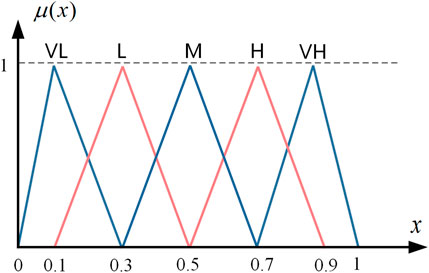
FIGURE 4. Membership functions of TFNs of linguistic variables in Table 2.
The decision makers judge different alternatives under specific criteria, according to the suggested linguistic variables. Suppose that the evaluation ZE = [ZEk](k = 1, 2, … , l) of the alternatives is given by l decision makers, where ZEk presents the evaluation of alternatives obtained from the kth decision maker and is expanded explicitly as follows:
where
Ultimately, multiple decision makers offer their risk preferences, according to the object of the evaluation. The set of risk preferences of l decision makers is denoted as α = [αk] (k = 1, 2, … , l), where αk presents the kth decision maker’s risk preference. The range of αk is 0 ≤ αk ≤ 1. If the decision maker’s risk preference is extraordinary optimism, he/she only considers the evaluation with the highest score, then α = 1; If the decision maker’s risk preference is ultra-conservatism, he/she only considers the evaluation with the lowest score, then α = 0; if the decision maker’s risk preference is egalitarianism, the decision maker considers the average of the evaluations under different criteria, then α = 0.5.
The evaluations of the alternatives under different criteria are described by Z-numbers, which can take both the uncertainty and reliability into consideration. In this section, the processing of the Z-numbers is explained.
Let
Let
The integrated Z-number is obtained by considering the effect of the component B (the reliability of evaluation) on the component A (the evaluation). The reliable part B′ is assigned to the defuzzified evaluation (component A′) directly, and the unreliable part (1 − B′) is assigned to the average of all possible linguistic variables for evaluation A′, denoted as γ(A′). Hence, a novel formula for integration of defuzzified Z-number Z′ is proposed as follows.
where γ presents the average value of the full set of the linguistic variables of evaluation. Supposed that r linguistic variables of the evaluation are denoted as TFNs
Example 1: the linguistic variable shown in Table 1 can be defuzzified to the crisp number and gathered in the vector as
Example 2: supposed that the Z-number of the evaluation of one alternative under one criterion is represented as (B, VH) with linguistic variables
Owing to the excellent property of DEMATEL in describing the interdependence among criteria, this section aims to obtain the relative importance weights of criteria through DEMATEL and perform the critical assessment of each alternative under the criteria.
Supposed that a set of the pairwise influence of criteria proposed by l decision makers is ZI = [ZIk](k = 1, 2, … , l), where ZIk presents the pairwise influence of the criteria obtained by kth decision maker, and the specific expansion is expressed as follows.
where
Table 3 exhibits the restriction (component A of Z-number) on the linguistic variable of the pairwise influence degree. For example, the linguistic variable “MI” in Table 3 means the degree of pairwise influence between two criteria is “medium influence” and Figure 5 shows the membership functions of TFNs in Table 3 for visualization. It has been noted that the linguistic variable for the reliability (component B of Z-number) of the evaluation is the same as in Table 2.
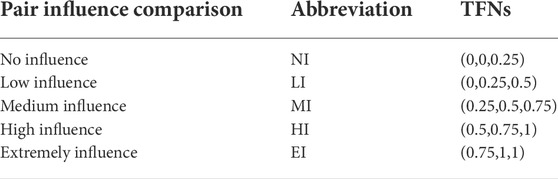
TABLE 3. Linguistic variable for the pairwise influence degree of criteria (component A of Z-number).
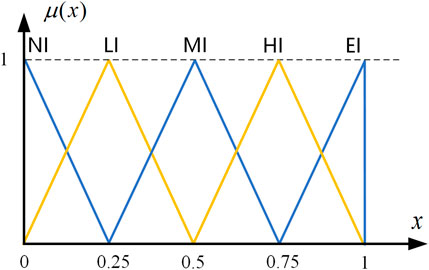
FIGURE 5. Membership functions of TFNs of linguistic variables in Table 3.
The evaluation of pair influence degree
After defuzzifying the evaluation of pair influence degree
Supposed that a set of the relative importance weight of each criterion IW = [IWk](k = 1, 2, … , l) presents the relative importance weight matrix for l decision makers, where
Let a set of critical assessment of the alternatives for the kth decision maker
The maximal entropy OWA operator successfully solves the one-to-many mapping problem. Once the risk preference α ∈ [0, 1] and the number of criteria n are given, the weight vector of different risk preferences (i.e., risk preference vector) is automatically generated. Thus, the maximal entropy OWA operator is utilized to generate the risk preference weight and assess the evaluations of the alternatives.
Let w = [wk](k = 1, 2, … , l) be a set of risk preference matrix for l decision makers, where
Supposed that λ = [λ(k)](k = 1, 2, … , l) be a set of the ranking matrix of the integrated Z-number Z″E of the evaluation of alternatives under criteria obtained from l decision makers, where the ranking matrix λ(k) of the integrated Z-number Z″Ek of the evaluation is presented as follows.
where the element λit(k) (i = 1, 2, … , n; t = 1, 2, … , m; k = 1, 2, … , l) presents the ranking of the integrated Z-number Z″Ek of the evaluation of the alternative St under the criterion Ci.
Example 3: suppose that kth decision maker suggests the integrated evaluation Z″Ek of three alternatives St(t = 1, 2, 3) under four criterion Ci(i = 1, 2, 3, 4) as follows.
The ranking matrix of the kth decision maker is calculated according to the integrated Z-number Z″Ek of the evaluation as follows.
Let a set of the reorder risk preference weight for l decision makers be RW = [RWk](k = 1, 2, … , l), where
where
Example 4: supposed that the risk preference of the kth decision maker is 0.4 and the integrated evaluation is exhibited in Eq. 35. According to the value of risk preference αk = 0.4, the risk preference vector
where the first column of RWk is calculated by
Suppose that RA = [RAk](k = 1, 2, … , l) presents the risk preference assessment of alternatives for l decision makers, where
Example 5: suppose that the kth decision maker participates in the decision making and the risk preference is α = 0.4, and the defuzzified evaluation by the kth decision maker is shown as in Eq. 35. The risk preference weight is acquired by Eq. 38 as shown in Example 4. Hence, the risk preference assessments of three alternatives under four criteria are RA = [0.2199, 0.5199, 0.3565].
Finally, the critical assessment of alternatives and the risk preference assessment are combined to get the final comprehensive assessment, and the optimal alternative option is chosen by ranking the assessment results.
The final assessment of alternatives of each decision maker is performed by considering the relative importance of criteria (the critical assessment) and the attitude toward risk of each decision maker (the risk preference assessment). The critical assessment
where η presents the adjustment factor and the range of η is 0 ≤ η ≤ 1. The selection of η is supposed to be determined by the decision-making group, according to specific situations. If
Assume that each decision maker contributes equally to the evaluation, the final comprehensive assessment FCOMA = [FCOMAt](t = 1, 2, … , m) of the alternatives is obtained as follows.
So far, the procedure of the proposed method for MCDM has been accomplished. Based on the final comprehensive assessment FCOMA, the ranking of alternatives can also be determined. According to the ranking order, the optimal alternative can be easily chosen.
RES investment is a complex problem of MCDM, targeting five mainstream new energy projects: biomass, hydropower, geothermal, wind, and solar power. To select the most worthy RES for investment, many factors have been established and sorted out, which are divided into economic and non-economic criteria Wang et al. (2019). Economic criteria consist of earnings, asset, and equity. Non-economic criteria consist of environmental effect, organizational capacity, and technological infrastructure.
To deal with the RES investment problem, three experienced and professional decision makers provide their judgments of alternatives under different criteria. The following are the specific processes.
The criteria C = [Ci](i = 1, 2, … , 6) of the target is deconstructed as economic criteria Q1 and non-economic criteria Q2, where earning C1, asset C2, and equity C3 are the sub-criteria of economic criteria Q1. Similarly, environmental effect C4, organizational capacity C5, and technological infrastructure C6 are the sub-criteria of non-economic criteria Q2. The set of alternatives is S = [St](t = 1, 2, … , 5), where S1 presents the biomass energy, S2 means the hydropower energy, S3 presents the geothermal energy, S4 means the wind energy, and S5 presents the solar energy.
Let a set of three decision makers be DM = [DMk](k = 1, 2, 3). Three professional decision makers provide the evaluation of five alternatives under six criteria. The expression of evaluation is determined in Table 4, with linguistic variables of Z-number shown in Tables 1, 2. At the same time, three decision makers offer their risk preferences as α = [0.3, 0.5, 0.8]. Furthermore, the hierarchy structure of alternatives and criteria in the RES investment problem can be found in Figure 6.
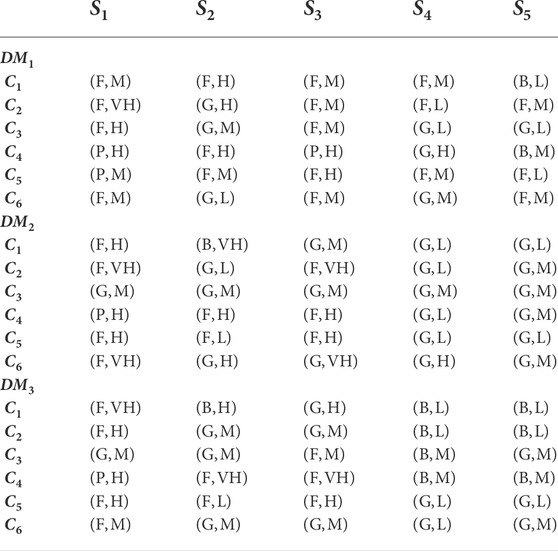
TABLE 4. Z-number of the evaluation of the alternatives under criteria for three decision makers.
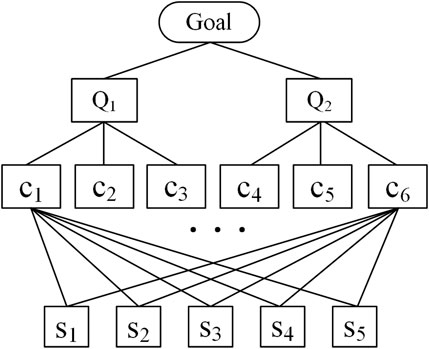
FIGURE 6. Hierarchy structure of the alternatives and criteria.
The evaluation of each alternative in Table 4 is composed of the linguistic variables of Z-number. In processing Z-number, each component A and component B of the Z-number is defuzzified to construct the defuzzified Z-number evaluation by Eq. 28. Then, the defuzzified Z-number is combined with constraint and reliability to generate the integrated Z-number by Eqs. 29 and 30. Finally, the integrated Z-number of evaluation of the alternatives under criteria for three decision makers is gathered in Table 5.
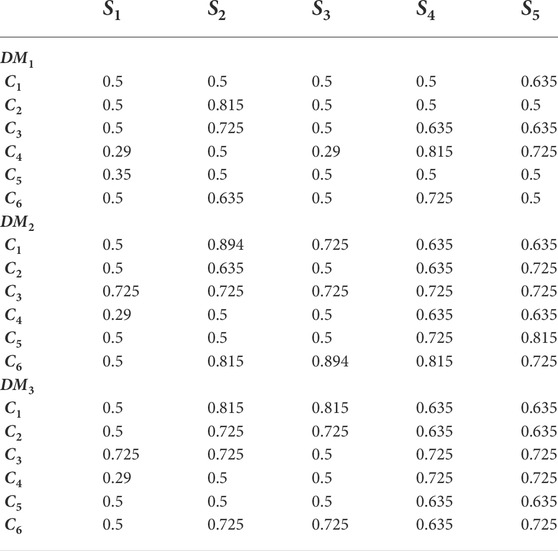
TABLE 5. Integrated Z-number of evaluation of the alternatives under criteria for three decision makers.
To achieve the relative importance among criteria, three decision makers provide their judgments on the pair influence between criteria Q1 and Q2. Table 6 shows the Z-number composed of linguistic variables in Table 2 and Table 3. The evaluation of pairwise influence degree of the sub-criteria of Q1 is generated in Table 7, and the pair influence degree of the sub-criteria of Q2 is generated in Table 8.
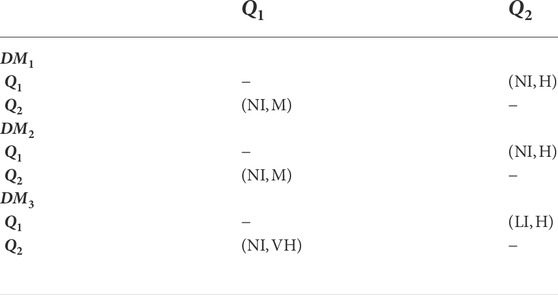
TABLE 6. Pair influence degree between criteria Q1 and Q2 of the evaluation for three decision makers.
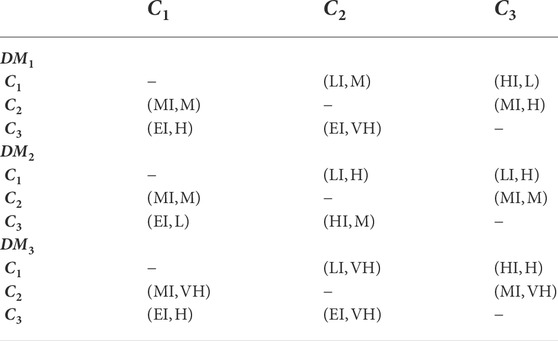
TABLE 7. Pair influence degree of the sub-criteria of Q1 for three decision makers.
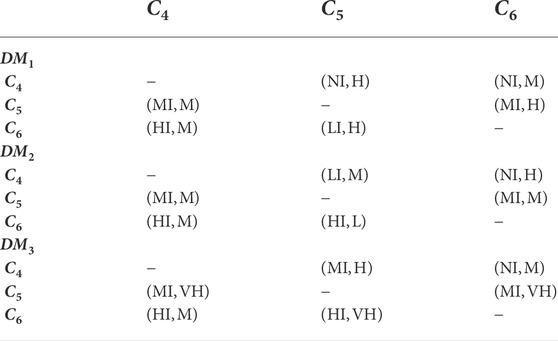
TABLE 8. Pair influence degree of the sub-criteria of Q2 for three decision makers.
By the procedure of Z-DEMATEL in Section 3, the centrality M and causality N are achieved from the evaluation of criterion Q1 and Q2 in Table 6. Similarly, the centrality M and causality N of criteria Ci(i = 1, 2⋯, 6) in Tables 7, 8 are calculated by the same procedure and shown in Figure 7.
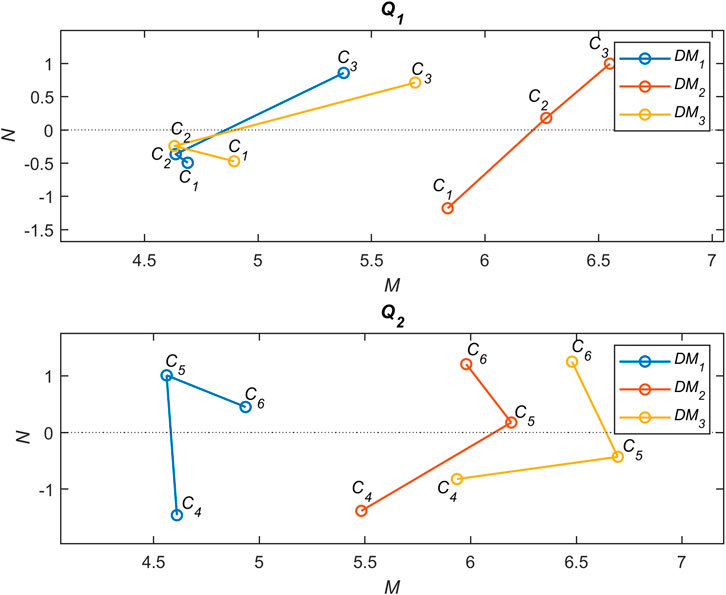
FIGURE 7. Centrality and causality of criteria based on Z-DEMATEL.
According to Figure 7, the variation between each causality N is insignificant. Thus, the significant weight IW of each criterion is mainly considered by the centrality M and generated by Eq. 32. Table 9 shows the results of the calculation of those significant weights. According to the results, the relative importance weight of the criteria generated by combining the two-layer criteria is listed in Table 9.
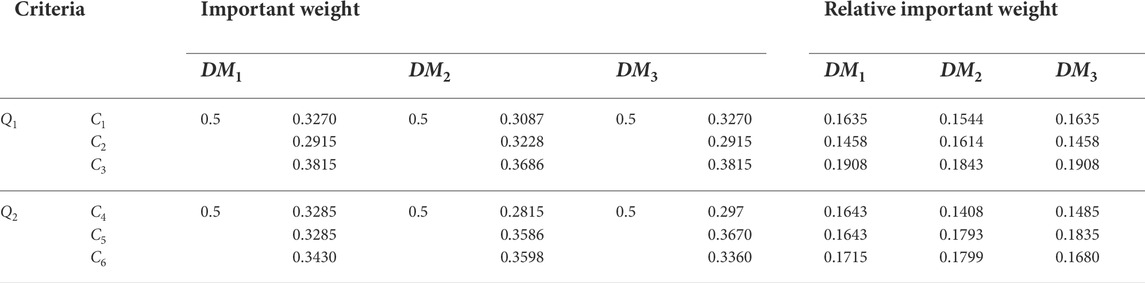
TABLE 9. Important weight of the criteria.
The critical assessments of alternatives are constituted with the relative importance of the weight vectors in Table 9 and the integrated evaluation of the alternatives under six criteria in Table 5. Table 10 exhibits the result of the critical assessments of alternatives by Eq. 33. According to the critical assessment, the ranking is S4 > S2 > S5 > S3 > S1 for DM1, S5 > S4 > S2 > S3 > S1 for DM2, and S5 > S4 > S2 > S3 > S1 for DM3. The ideal alternative may be S4 (wind energy) or S5 (solar energy) with no clear consensus, and the worst choice is S1 (biomass energy) with consensus.
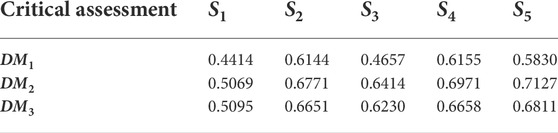
TABLE 10. Critical assessment of five alternatives for three decision makers.
The risk preference vector set is obtained after identifying the risk preferences for three decision makers as α = [0.3, 0.5, 0.8]. Based on the maximal entropy OWA operator, the weight vectors can be obtained as [0.0544, 0.0788, 0.1142, 0.1654, 0.2398, 0.3475], [0.1667, 0.1667, 0.1667, 0.1667, 0.1667, 0.1667], and [0.4781, 0.2548, 0.1357, 0.0723, 0.0385, 0.0205] for the cases that α = 0.3, 0.5, 0.8, respectively, by utilizing Eqs. 24–26. After reordering these weight vectors by Eq. 37, the risk preference weight of each alternative under each criterion is obtained (see Table 11).
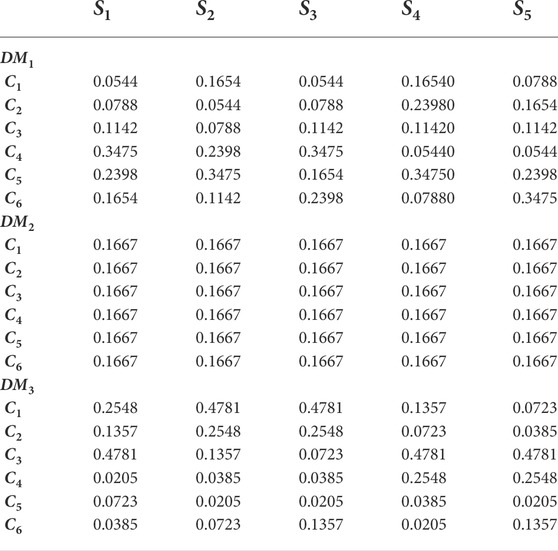
TABLE 11. Reordered ranking risk preference weights of criteria.
The risk preference assessment of each alternative is the production of the risk preference weight in Table 11 and the integrated evaluation of alternatives under different criteria in Table 5, which is shown in Table 12. According to the risk preference assessment, the ranking is S4 > S2 > S5 > S3 > S1 for DM1, S5 > S4 > S2 > S3 > S1 for DM2, and S2 > S3 > S5 > S4 > S1 for DM3. There is still no consensus on the ideal alternative, and the worst choice is still S1 (biomass energy) with consensus.
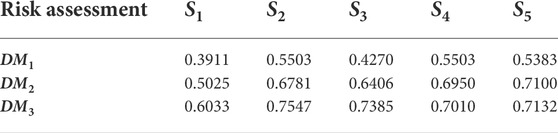
TABLE 12. Risk preference assessment of five alternatives for three decision makers.
In this article, the critical assessment and risk preference assessment are considered equally important to the decision result. That is to say, the setting of the adjustment factor η = 0.5, the combined assessment result of five alternatives for three decision makers is derived in Table 13 with utilizing Eq. 41.

TABLE 13. Combined assessment of five alternatives for three decision makers.
The final comprehensive assessments of alternatives for three decision makers are obtained and listed in Table 13 by Eq. 42. According to Table 13, it is obvious that the ranking of alternatives is S2 > S5 > S4 > S3 > S1. Since the results of the alternatives S2 (hydropower energy) and S5 (solar energy) are so close, two RESs (i.e., hydropower energy and solar energy) are recommended as the optimal alternatives.
In the decision making of the RES investment, when the component B of the Z-number is completely consistent and expresses the total reliability of the evaluation (component A), that is, B = 1, a Z-number is converted into a classical fuzzy number. Wang et al. (2019) used the approach of fuzzy DEMATEL (FDEMATEL) with fuzzy-TOPSIS (FTOPSIS) or fuzzy-VIKOR (FVIKOR) to deal with the same RES investment problem. To verify the effectiveness of the proposed method, this article adopts the data of the evaluation from Wang et al. (2019), in which the component A of the evaluation of alternatives in Tables 6–8 remain unchanged. The adjustment factor η is adjusted to 1 (i.e., only the critical assessment is considered, the risk preference of decision maker is not considered) to obtain the side-by-side comparison of the proposed method and other methods shown in Table 14.
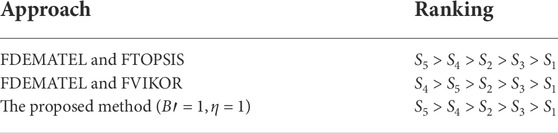
TABLE 14. Comparison of the ranking of alternatives with different approaches.
With the comparison of the ranking of the assessment with different approaches in Table 14, the conclusion is summarized that the ranking of Z-DEMATEL which can be seen as a special case of the proposed method (B′ = 1, η = 1) is the same as the ranking of the FDEMATEL and FTOPSIS and is different from that of the FDEMATEL and FVIKOR methods. The alternatives S4 and S5 are in reverse order but the difference of assessment results between S4 and S5 are very small. If the requirements are relaxed that two energy projects of the RES investment are selected, both wind energy S4 and solar energy S5 can be recommended as the optimal options. In sum, the proposed method is effective and satisfies downward compatibility, especially for the description of uncertainty with fuzzy set theory by assuming the component B to be 1.
The information (especially the knowledge from experts) to be processed is often uncertain and partially reliable due to the complexity of the real world. Thus, the Z-number is introduced to deal with the information in this article. The component A of a Z-number is the restriction of the evaluation, which may be uncertain. The component B of a Z-number represents the reliability of the first component A. The component B (reliability) should be well handled to gain a more reasonable decision result. In the proposed method, by carrying out the integration of Z-number (see Section 3.2.2), the influence of the component B (reliability) is taken into account.
To show the impact of the component B on the final result of the RES investment, this article adopts the data from Wang et al. (2019), where the component A (the evaluation of alternative) in Table 4, and the pair influence degree of criteria in Tables 6–8 remain unchanged, the risk preference and the adjustment factor are the same as that in Section 4.2. The only difference is that the defuzzified components B′ changes from 0 to 1 stepwise by 0.1. The final assessment results are shown in Figure 8.
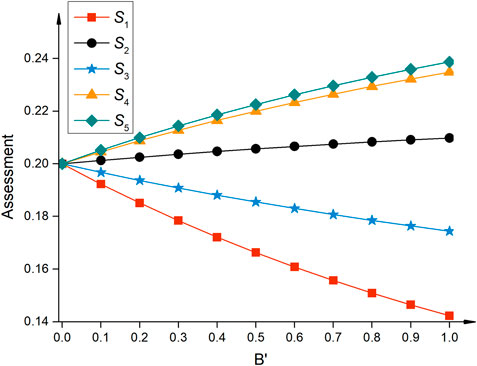
FIGURE 8. Assessment results of alternatives with different component B.
As can be seen from Figure 8, when the entire component B′ of the Z-numbers is 0, the final comprehensive assessment results are all the same as 0.2 after normalization. The reason is that the average of all possible linguistic variables for evaluation A′ is adopted in this case since no reliability (confidence) is given to the evaluation (more details can be found in Section 3.2.2). As the reliability (component B) increases, the reliable part of the evaluation is constantly strengthened, and the influence of the restriction of the evaluation (component A) on the final assessment result is also enhanced, which leads to more differentiated final comprehensive assessment results.
Above the impact of component B on the final assessment result is investigated by changing the component B from 0 to 1 stepwise by 0.1. However, all the evaluations are given the same reliability (component B) for each step, which may be unrealistic in practical use. Thus, an example is designed to further investigate the impact of component B on the result under the situation when some of the component B is changed. Six cases of different defuzzified component B′ as shown in Table 15 are considered. In each case, the defuzzified component B′ of the evaluation of one alternative is uniformly set to 0.1, and others are set to 1. Other conditions remain unchanged. The result of the assessment under six different cases can be found in Table 16 and Figure 9.
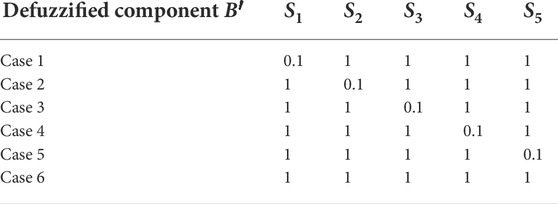
TABLE 15. Six cases of different defuzzified component B′.
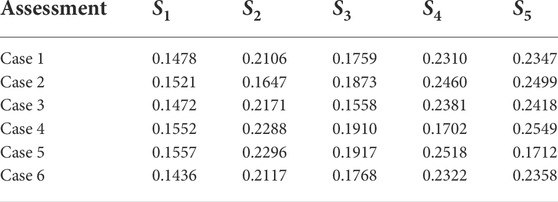
TABLE 16. Assessment results under six cases of defuzzified component B′.
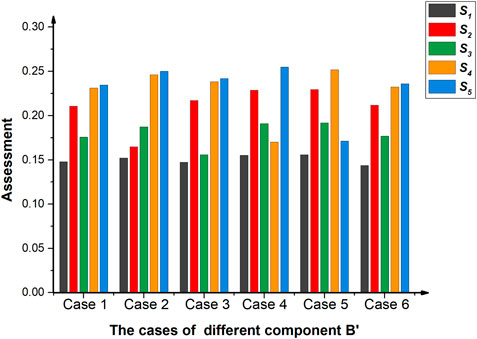
FIGURE 9. Histogram of the assessment results under six cases of different defuzzified component B′.
As can be seen in Table 16 and Figure 9, the result and the ranking in Case 6, which is a control group, are the same as that in Table 14 and Figure 8. In the case where the component B′ is set to 0.1, the integrated Z-number of the corresponding alternative tends to be more moderate (weaken the evaluation in component A), while the integrated Z-numbers of the other alternatives (B′ = 1) strengthen the evaluation in component A. This impact may lead to different assessment results and the ranking.
Through the aforementioned analysis, we found that the reliability (component B) could have a significant impact on the final assessment result. By changing the value of the component B, the decision results and even the ranking can be completely different. Furthermore, when the values of reliability (component B) become smaller, the results become more moderate and the distinguishability of the results is decreased.
The adjustment factor η plays a role in regulating the important proportion of critical assessment and risk preference assessment. To investigate the impact of the adjustment factor η on the final result, an example is designed where the evaluation of the alternatives in Table 4 and the pair influence degree of criteria in Tables 6–8 remain unchanged. The set of the risk preference is α = [1, 1, 1]. With the change of the adjustment factor η from 0 to 1 stepwise by 0.1, the final assessment results change as shown in Figure 10.
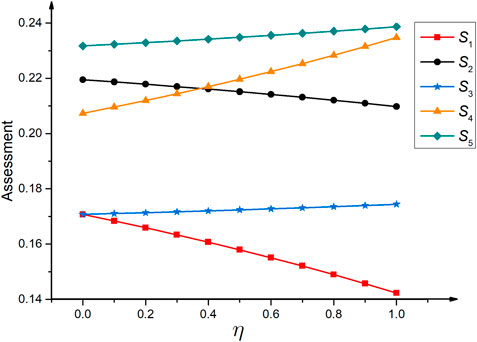
FIGURE 10. Assessment results of alternatives with different adjustment factor η.
According to Figure 10, when η = 0, the weight of the criteria is only affected by risk preference of the decision maker. With the value of η increasing, the weight of the criteria is affected by both the risk preference of the decision maker and the interdependence among the criteria, and the effect of the latter becomes larger. This trend could lead to a change in the ranking of alternatives. For example, the ranking of S2 and S4 is reversed when the value of η is changed around 0.4.
Therefore, the adjustment factor η as an important parameter leads to a significant change in the decision result. In practical applications, decision makers can set this parameter according to a specific situation. When the interdependence among criteria is strong and should be mainly considered, the value of η could be set closer to 1. On the contrary, if the decision problem is highly dependent on the risk preference of the decision maker, the value of η should be set closer to 0.
In this article, we propose a new decision-making method for complex decision problems such as RES investment, which can integrate uncertainty of information, interdependence among criteria, and decision makers’ risk preferences to obtain more reasonable decision results. The uncertainty and reliability of information is handled using Z-number, the interdependence among criteria is modeled using DEMATEL, and the risk preferences of the decision makers are considered using the maximal entropy OWA operator. The application in RES investment shows that the proposed method can deal with simple situations and arrive at the same result as other methods. Several examples are given to show the flexibility of the proposed method in dealing with different situations.
The use of Z-numbers allows the decision system to take into account the uncertainty and reliability of the information. The component B of Z-number, as the reliability of the evaluation (component A), also has a significant impact on the final assessment result. When the component B equals 1, Z-number theory is downward compatible with other uncertainty theories such as fuzzy theory. In addition, when the reliability (component B) of Z-number is smaller, the assessment result ends to be more moderate.
The proposed adjustment factor η allows the decision system to determine the importance proportion of the interdependence among criteria and the decision makers risk preferences. When the effects of interdependence and risk preference are considered equally, then η is set to 0.5. The larger the adjustment factor η, the more dependence among criteria are considered in the decision process, vice versa. The value of η can be determined by experienced specialists in the field according to the actual situation.
The proposed method provides a solution to various situations that may be encountered in the MCDM problem. The new method is applicable to fields other than RES investment, including supplier selection and risk analysis. Currently, the influencing factors to be considered in the MCDM problem are not yet unified, and the evaluation lacks statistical evidence. In addition, the defuzzification method adopted in this article is simple, and may cause information loss in the defuzzification stage. These issues need to be explored in future studies.
The original contributions presented in the study are included in the article/Supplementary Material; further inquiries can be directed to the corresponding author.
Conceptualization, XS; methodology, XS; software, XG; validation, XS; writing—original draft preparation, XG; writing—review and editing, XS; visualization, XG; supervision, HQ and ZX; project administration, HQ and ZX. All authors listed have made a substantial, direct, and intellectual contribution to the work and approved it for publication.
The work is partially supported by the Shanghai Rising-Star Program (Grant No. 21QA1403400), the Shanghai Natural Science Foundation (Grant No. 19ZR1420700), and Shanghai Key Laboratory of Power Station Automation Technology (Grant No. 13DZ2273800).
The authors declare that the research was conducted in the absence of any commercial or financial relationships that could be construed as a potential conflict of interest.
All claims expressed in this article are solely those of the authors and do not necessarily represent those of their affiliated organizations, or those of the publisher, the editors, and the reviewers. Any product that may be evaluated in this article, or claim that may be made by its manufacturer, is not guaranteed or endorsed by the publisher.
Abdul, D., Wenqi, J., and Tanveer, A. (2022). Prioritization of renewable energy source for electricity generation through ahp-vikor integrated methodology. Renew. Energy 184, 1018–1032. doi:10.1016/j.renene.2021.10.082
Ahmed, Z., Ahmad, M., Rjoub, H., Kalugina, O. A., and Hussain, N. (2021). Economic growth, renewable energy consumption, and ecological footprint: Exploring the role of environmental regulations and democracy in sustainable development. New Jersey, NJ: Sustainable Development.
Almutairi, K., Hosseini Dehshiri, S. J., Hosseini Dehshiri, S. S., Mostafaeipour, A., Hoa, A. X., and Techato, K. (2022). Determination of optimal renewable energy growth strategies using swot analysis, hybrid mcdm methods, and game theory: A case study. Int. J. Energy Res. 46, 6766–6789. doi:10.1002/er.7620
Barbier, E. B. (1987). The concept of sustainable economic development. Environ. Conserv. 14, 101–110. doi:10.1017/s0376892900011449
Bilgili, F., Zarali, F., Ilgün, M. F., Dumrul, C., and Dumrul, Y. (2022). The evaluation of renewable energy alternatives for sustainable development in Turkey using intuitionistic fuzzy-topsis method. Renew. Energy 189, 1443–1458. doi:10.1016/j.renene.2022.03.058
Bohra, S. S., and Anvari-Moghaddam, A. (2021). A comprehensive review on applications of multicriteria decision-making methods in power and energy systems. Int. J. Energy Res. 46, 4088–4118. doi:10.1002/er.7517
Chang, K., Zeng, Y., Wang, W., and Wu, X. (2019). The effects of credit policy and financial constraints on tangible and research & development investment: Firm-level evidence from China’s renewable energy industry. Energy policy 130, 438–447. doi:10.1016/j.enpol.2019.04.005
Cheng, R., Zhang, J., and Kang, B. (2022). A novel z-topsis method based on improved distance measure of z-numbers. Int. J. Fuzzy Syst. doi:10.1007/s40815-022-01297-w
Deng, X., and Jiang, W. (2019b). A total uncertainty measure for D numbers based on belief intervals. Int. J. Intell. Syst. 34, 3302–3316. doi:10.1002/int.22195
Deng, X., and Jiang, W. (2019a). D number theory based game-theoretic framework in adversarial decision making under a fuzzy environment. Int. J. Approx. Reason. 106, 194–213. doi:10.1016/j.ijar.2019.01.007
Deng, X., and Jiang, W. (2020). On the negation of a Dempster-Shafer belief structure based on maximum uncertainty allocation. Inf. Sci. 516, 346–352. doi:10.1016/j.ins.2019.12.080
Dinçer, H., Yüksel, S., Aksoy, T., and Hacıoğlu, Ü. (2022). Application of m-swara and topsis methods in the evaluation of investment alternatives of microgeneration energy technologies. Sustainability 14, 6271. doi:10.3390/su14106271
Dincer, I. (2000). Renewable energy and sustainable development: A crucial review. Renew. Sustain. energy Rev. 4, 157–175. doi:10.1016/s1364-0321(99)00011-8
Fuller, R., and Majlender, P. (2000). An analytic approach for obtaining maximal entropy owa operator weights. Fuzzy Sets Syst. 124, 53–57. doi:10.1016/s0165-0114(01)00007-0
Gabus, A., and Fontela, E. (1972). World problems, an invitation to further thought within the framework of dematel.
Gao, X., Su, X., Qian, H., and Pan, X. (2022). Dependence assessment in human reliability analysis under uncertain and dynamic situations. Nucl. Eng. Technol. 54, 948–958. doi:10.1016/j.net.2021.09.045
He, L., Zhang, L., Zhong, Z., Wang, D., and Wang, F. (2019). Green credit, renewable energy investment and green economy development: Empirical analysis based on 150 listed companies of China. J. Clean. Prod. 208, 363–372. doi:10.1016/j.jclepro.2018.10.119
Hu, Z., and Lin, J. (2022). An integrated multicriteria group decision making methodology for property concealment risk assessment under z-number environment. Expert Syst. Appl. 205, 117369. doi:10.1016/j.eswa.2022.117369
Huang, Q. (2022). Selecting sustainable renewable energy-powered desalination: An mcdm framework under uncertain and incomplete information. Clean. Technol. Environ. Policy 24, 1581–1598. doi:10.1007/s10098-021-02268-9
Jiang, W., Cao, Y., and Deng, X. (2020). A novel Z-network model based on Bayesian network and Z-number. IEEE Trans. Fuzzy Syst. 28, 1585–1599. doi:10.1109/tfuzz.2019.2918999
Karatop, B., Taşkan, B., Adar, E., and Kubat, C. (2021). Decision analysis related to the renewable energy investments in Turkey based on a fuzzy ahp-edas-fuzzy fmea approach. Comput. Industrial Eng. 151, 106958. doi:10.1016/j.cie.2020.106958
Keleş, M. K., Özdağoğlu, A., and Yakut, M. Z. (2022). Analysis of the criteria used to evaluate renewable energy sources in Turkey with fuzzy swara. Optim. Decision-Making Renew. Energy Industry (IGI Glob., 59–88.
Kihombo, S., Ahmed, Z., Chen, S., Adebayo, T. S., and Kirikkaleli, D. (2021). Linking financial development, economic growth, and ecological footprint: What is the role of technological innovation? Environ. Sci. Pollut. Res. 28, 61235–61245. doi:10.1007/s11356-021-14993-1
Lak Kamari, M., Isvand, H., and Alhuyi Nazari, M. (2020). Applications of multi-criteria decision-making (mcdm) methods in renewable energy development: A review. Renew. Energy Res. Appl. 1, 47–54.
Li, P., Xu, Z., Wei, C., Bai, Q., and Liu, J. (2022). A novel promethee method based on gra-dematel for pltss and its application in selecting renewable energies. Inf. Sci. 589, 142–161. doi:10.1016/j.ins.2021.12.090
Li, Y., and Deng, Y. (2018). Generalized ordered propositions fusion based on belief entropy. Int. J. Comput. Commun. Control 13, 792–807. doi:10.15837/ijccc.2018.5.3244
Li, Y., Wu, T., Mao, J., Guo, H., and Yao, A. (2020). A method of uncertainty measurements for multidimensional z-number and their applications. Math. Problems Eng. 2020, 1–16. doi:10.1155/2020/8407830
Liu, T., Deng, Y., and Chan, F. (2018). Evidential supplier selection based on DEMATEL and game theory. Int. J. Fuzzy Syst. 20, 1321–1333. doi:10.1007/s40815-017-0400-4
Meng, D., Wang, H., Yang, S., Lv, Z., Hu, Z., and Wang, Z. (2022a). Fault analysis of wind power rolling bearing based on emd feature extraction. Comput. Model. Eng. Sci. 130, 543–558. doi:10.32604/cmes.2022.018123
Meng, D., Yang, S., He, C., Wang, H., Lv, Z., Guo, Y., et al. (2022b). Multidisciplinary design optimization of engineering systems under uncertainty: A review. Int. J. Struct. Integr. 13, 565–593. doi:10.1108/IJSI-05-2022-0076
Mohsin, M., Kamran, H. W., Nawaz, M. A., Hussain, M. S., and Dahri, A. S. (2021). Assessing the impact of transition from nonrenewable to renewable energy consumption on economic growth-environmental nexus from developing Asian economies. J. Environ. Manag. 284, 111999. doi:10.1016/j.jenvman.2021.111999
O’Hagan, M. (1988). Aggregating template or rule antecedents in real-time expert systems with fuzzy set logic. In Twenty-second asilomar conference on signals, systems and computers. New York, NY: IEEE, 2, 681–689.
Peng, H.-g., Shen, K.-w., He, S.-s., Zhang, H.-y., and Wang, J.-q. (2019). Investment risk evaluation for new energy resources: An integrated decision support model based on regret theory and electre iii. Energy Convers. Manag. 183, 332–348. doi:10.1016/j.enconman.2019.01.015
Rani, P., Ali, J., Krishankumar, R., Mishra, A. R., Cavallaro, F., and Ravichandran, K. S. (2021). An integrated single-valued neutrosophic combined compromise solution methodology for renewable energy resource selection problem. Energies 14, 4594. doi:10.3390/en14154594
Rathore, N., Debasis, K., and Singh, M. (2021). “Selection of optimal renewable energy resources using topsis-z methodology,” in Advances in communication and computational Technology (Springer), 967–977.
Samour, A., Baskaya, M. M., and Tursoy, T. (2022). The impact of financial development and fdi on renewable energy in the uae: A path towards sustainable development. Sustainability 14, 1208. doi:10.3390/su14031208
Saraswat, S., and Digalwar, A. K. (2021). Evaluation of energy alternatives for sustainable development of energy sector in India: An integrated shannon’s entropy fuzzy multi-criteria decision approach. Renew. Energy 171, 58–74. doi:10.1016/j.renene.2021.02.068
Sedghiyan, D., Ashouri, A., Maftouni, N., Xiong, Q., Rezaee, E., and Sadeghi, S. (2021). Retracted: Prioritization of renewable energy resources in five climate zones in Iran using AHP, hybrid AHP-TOPSIS and AHP-SAW methods. Sustain. Energy Technol. Assessments 44, 101045. doi:10.1016/j.seta.2021.101045
Si, S. L., You, X. Y., Liu, H. C., and Ping, Z. (2018). Dematel technique: A systematic review of the state-of-the-art literature on methodologies and applications. Math. Problems Eng., 1–33. doi:10.1155/2018/3696457
Strantzali, E., and Aravossis, K. (2016). Decision making in renewable energy investments: A review. Renew. Sustain. Energy Rev. 55, 885–898. doi:10.1016/j.rser.2015.11.021
Tian, Y., and Kang, B. (2020). A modified method of generating z-number based on owa weights and maximum entropy. Soft Comput. 24, 15841–15852. doi:10.1007/s00500-020-04914-8
Tian, Y., Mi, X., Cui, H., Zhang, P., and Kang, B. (2021). Using z-number to measure the reliability of new information fusion method and its application in pattern recognition. Appl. Soft Comput. 111, 107658. doi:10.1016/j.asoc.2021.107658
Ulewicz, R., Siwiec, D., Pacana, A., Tutak, M., and Brodny, J. (2021). Multi-criteria method for the selection of renewable energy sources in the polish industrial sector. Energies 14, 2386. doi:10.3390/en14092386
Vagiona, D. G. (2021). Comparative multicriteria analysis methods for ranking sites for solar farm deployment: A case study in Greece. Energies 14, 8371. doi:10.3390/en14248371
Van Thanh, N. (2022). Sustainable energy source selection for industrial complex in vietnam: A fuzzy mcdm approach. IEEE Access 10, 50692–50701. doi:10.1109/access.2022.3173609
Wang, C.-H., Padmanabhan, P., and Huang, C.-H. (2021a). The impact of renewable energy, urbanization, and environmental sustainability ratings on the environmental kuznets curve and the pollution haven hypothesis. Sustainability 13, 13747. doi:10.3390/su132413747
Wang, C.-N., Kao, J.-C., Wang, Y.-H., Nguyen, V. T., Nguyen, V. T., and Husain, S. T. (2021b). A multicriteria decision-making model for the selection of suitable renewable energy sources. Mathematics 9, 1318. doi:10.3390/math9121318
Wang, H., Fang, Y. P., and Zio, E. (2022). Resilience-oriented optimal post-disruption reconfiguration for coupled traffic-power systems. Reliab. Eng. Syst. Saf. 222. doi:10.1016/j.ress.2022.108408
Wang, S., Liu, Q., Yuksel, S., and Dincer, H. (2019). Hesitant linguistic term sets-based hybrid analysis for renewable energy investments. IEEE Access 7, 114223–114235. doi:10.1109/access.2019.2935427
Xiao, F. (2021). Ceqd: A complex mass function to predict interference effects. IEEE Trans. Cybern. 52, 7402–7414. doi:10.1109/TCYB.2020.3040770
Xie, Y., Zhou, Y., Peng, Y., Dinçer, H., Yüksel, S., and an Xiang, P. (2021). An extended pythagorean fuzzy approach to group decision-making with incomplete preferences for analyzing balanced scorecard-based renewable energy investments. IEEE Access 9, 43020–43035. doi:10.1109/access.2021.3065294
Xiong, L., Su, X., and Qian, H. (2021). Conflicting evidence combination from the perspective of networks. Inf. Sci. 580, 408–418. doi:10.1016/j.ins.2021.08.088
Yager, R. R. (1993). “On ordered weighted averaging aggregation operators in multicriteria decisionmaking,” in Readings in fuzzy sets for intelligent systems. Editors D. Dubois, H. Prade, and R. R. Yager (New York, NY: Morgan Kaufmann), 80–87. doi:10.1016/B978-1-4832-1450-4.50011-0
Yao, J.-S., and Wu, K. (2000). Ranking fuzzy numbers based on decomposition principle and signed distance. Fuzzy Sets Syst. 116, 275–288. doi:10.1016/S0165-0114(98)00122-5
Zadeh, L. A. (2011). A note on z-numbers. Inf. Sci. (N. Y). 181, 2923–2932. doi:10.1016/j.ins.2011.02.022
Zhang, W., and Deng, Y. (2019). Combining conflicting evidence using the DEMATEL method. Soft Comput. 23, 8207–8216. doi:10.1007/s00500-018-3455-8
Zhou, P., Zhou, P., Yüksel, S., Dinçer, H., and Uluer, G. S. (2019). Balanced scorecard-based evaluation of sustainable energy investment projects with it2 fuzzy hybrid decision making approach. Energies 13, 82. doi:10.3390/en13010082
A, B fuzzy number
Z = (A, B) Z-number
i, j = 1, 2, … , n the number of criteria
t = 1, 2, … , m the number of alternatives
k = 1, 2, … , l the number of decision makers
Y = [Yij] crisp direct-influencing matrix
X = [Xij] normalized direct-influencing matrix
T = [Tij] total-influencing matrix
F = [Fi] influencing degree
E = [Ei] impact degree
M = [Mi] centrality degree
N = [Ni] causality degree
w = [wi] risk preference vector obtained by the maximal entropy OWA operator
C = [Ci] criterion
S = [St] alternative
DM = [DMk] decision maker
α = [αk] risk preference
γ average value of the full set of the linguistic variables
λ = [λit(k)] ranking matrix
η adjustment factor
FCOMA = [FCOMAt] final comprehensive assessment
Keywords: renewable energy source investment, Z-number, DEMATEL, OWA, maximal entropy
Citation: Su X, Guan X, Xu Z and Qian H (2022) A new decision making method based on Z-decision-making trial and evaluation laboratory and ordered weighted average and its application in renewable energy source investment. Front. Energy Res. 10:978767. doi: 10.3389/fenrg.2022.978767
Received: 26 June 2022; Accepted: 09 August 2022;
Published: 27 September 2022.
Edited by:
Fanlin Meng, The University of Manchester, United KingdomReviewed by:
Peijia Ren, South China University of Technology, ChinaCopyright © 2022 Su, Guan, Xu and Qian. This is an open-access article distributed under the terms of the Creative Commons Attribution License (CC BY). The use, distribution or reproduction in other forums is permitted, provided the original author(s) and the copyright owner(s) are credited and that the original publication in this journal is cited, in accordance with accepted academic practice. No use, distribution or reproduction is permitted which does not comply with these terms.
*Correspondence: Xiaoyan Su, c3V4aWFveWFuQHNoaWVwLmVkdS5jbg==
Disclaimer: All claims expressed in this article are solely those of the authors and do not necessarily represent those of their affiliated organizations, or those of the publisher, the editors and the reviewers. Any product that may be evaluated in this article or claim that may be made by its manufacturer is not guaranteed or endorsed by the publisher.
Research integrity at Frontiers
Learn more about the work of our research integrity team to safeguard the quality of each article we publish.