 Xiaodong Zhang
 Jing Sun
 Yunlong Shang
 Song Ren1
- 1School of Information and Electronic Engineering, Shandong Technology and Business University, Yantai, China
- 2School of Control Science and Engineering, Shandong University, Jinan, China
- 3YanTai DongFang Wisdom Electric Co., Ltd, Yantai, China
The state-of-health (SOH) of lithium-ion batteries is one of the important core issues of battery management systems (BMS). After the battery reaches its end of life (EOL), its safety performance will deteriorate rapidly, which will be a huge threat to electric vehicles (EVs). Therefore, the accurate SOH prediction can ensure the safety and reliable operation of the battery, which is a critical and challenging issue. Accordingly, this paper proposes a novel SOH prediction method for lithium-ion batteries based on the long short-term memory (LSTM) neural network combined with attention mechanism (AM). First, moving average filter is applied to the lithium-ion battery capacity data for the purpose of reducing noise. Then, according to the battery capacity data of different datasets and different discharge rates, different weights are given to the LSTM hidden layer by AM to enhance the important information, so as to complete SOH prediction. Finally, the model is tested on new data and compared with the current data-driven prediction model. The experiment results show that the proposed SOH prediction method is more accurate, simple and robust. Furthermore, the SOH prediction method proposed in this paper is full of promising for practical EVs applications.
1 Introduction
With the advancement of science and technology, the energy and environmental crisis are deepening, and the development of new energy vehicles has become an important part of sustainable development (Yao et al., 2021). With the advantages of high energy density, long life, low self-discharge rate, low cost, wide operating temperature range and reliable cleanliness (Schmuch et al., 2018; Zubi et al., 2018; Shang et al., 2020), lithium-ion batteries have been widely used in EVs, power sources, secondary charging and energy storage devices, and mobile wearable devices (Wang et al., 2022a; Wang et al., 2022b). Lithium-ion batteries have become the major power source for driving electric vehicles (EVs) (Wei et al., 2018). The aging process of lithium-ion batteries continues as the charge/discharge cycle number increases (Liu et al., 2020a; Li et al., 2021). When the lithium-ion battery ages below the end of life (EOL) point, its performance will decrease dramatically and the probability of dangerous accidents will increase noticeably, resulting in devastating and unmeasurable consequences (Liu et al., 2020b; Xiong et al., 2020). For instance, a Tesla Model S suddenly caught fire in an underground garage in Shanghai on 21 April 2019. A Samsung Galaxy S10 mobile phone was damaged by self-ignition during charging in 2019. The investigation found that all these accidents were linked to the aging of lithium-ion batteries. Therefore, it is critical to accurately predict the state of health (SOH) of lithium-ion batteries (Wang et al., 2020; Shi et al., 2021; Yang et al., 2021; Chen et al., 2022).
The SOH of lithium-ion batteries describes to what extent the current lithium-ion battery is aging relative to a brand-new one (Kim et al., 2020). With the aging of lithium-ion batteries in the process of use, the battery performance will deteriorate, which is mainly manifested in the decay of battery capacity and the increase of internal resistance (Fan et al., 2020). Accordingly, battery capacity and internal resistance are often used as the indicators for SOH estimation of batteries (Pan et al., 2018; Wang et al., 2019). The SOH is respectively defined in terms of capacity and internal resistance as follows (Wang et al., 2021; Tan et al., 2022):
where Cnew and Ccurrent are the rated and current capacity, respectively, Rnow, REOL, and Rnew are the current internal resistance, the internal resistance at the EOL and the internal resistance at the brand-new state of the battery, respectively.
In this paper, according to Eq. 1, the SOH is defined in terms of capacity, which is the ratio of the current available capacity to the rated capacity of the battery. For lithium-ion batteries on new energy vehicles, when the available capacity drops to 70% of the rated capacity, it can be considered to have reached the EOL. Since the SOH of the lithium-ion battery cannot be measured directly by the sensor, it can only be estimated indirectly by the capacity data measured during each charge/discharge cycle. Currently, there are mainly two types of SOH estimation methods, model-based methods and data-driven methods.
The model-based methods usually need to model the lithium-ion battery using priori knowledge and identifying the aging characteristic parameters by least-squares or observation methods, and then use the aging index to estimate SOH. Bi et al. (2020) achieved the simultaneous estimation of SOH and aging parameters by building a physics-based life model and using particle filters with real time current and terminal voltage measurements, which can predict lithium-ion battery failure due to local aging. This method requires knowledge of the constituent materials of the lithium-ion battery and the electrochemical reactions of the lithium-ion battery. Messing et al. (2021) demonstrated that the electrochemical impedance spectroscopy was able to trace the short-term relaxation effect at different SOH of the lithium-ion battery, and therefore, proposed a SOH estimation method based on the electrochemical impedance spectroscopy and the relaxation effect. The method requires an impedance measurement device, which is expensive and not easy to operate. Luo et al. (2021) constructed a mathematical model through the constant phase element parameters in the equivalent circuit model of electrochemical impedance spectroscopy for fast SOH estimation of retired batteries. Yang et al. (2020) introduced a fractional impedance model based on the Grünwald-Letnikov definition and used least-squares to identify the battery parameters. Then a back propagation neural network is introduced to SOH estimation based on the combination of the identified model parameters and the interval capacity. Zhang et al. (2022) proposed a novel SOH estimation method by combining the voltage-capacity (VC) model based incremental capacity analysis (ICA) with the support vector regression (SVR). After correlation analysis of these extracted health features with the reference battery capacity, SVR was used to construct the SOH estimation model by selecting two lithium-ion batteries with different chemical compositions. To sum up, the above model-based methods require a large amount of priori knowledge and frequent revision of the model depending on the lithium-ion battery type and the operating condition, which is unsuitable for online estimation.
The data-driven methods have significant advantages over the model-based methods, which are more accurate and adaptive. The data-driven methods are suitable for online estimation and requires neither the knowledge of the electrochemical reactions nor the establishment of accurate battery model. The SOH estimation can be achieved by the data obtained in the lithium-ion battery aging test experiments. Yang et al. (2018) proposed a Gaussian process regression (GPR) model based on the charging curves. Four specific parameters extracted from the charging curves were used as the input of the GPR model, and afterwards the correlation between the selected features and SOH was analyzed using gray correlation analysis, and next the SOH estimation was completed. Whereas, the GPR model is unsuitable for the prediction of data with strong nonlinear. Niu et al. (2021) proposed a model combining long short-term memory (LSTM) and fully connected (FC) network to accomplish the SOH estimation. The LSTM learned the long-term correlation of battery degradation trends, and the FC network acted as a firewall in the transmission process. Nevertheless, when the time series input is too long, the LSTM tends to lose the information about the series, thus makes the model less accurate. Qian et al. (2021) proposed a SOH estimation method based on one-dimensional convolutional neural network (1D CNN). Random segments of the charging curve were used as input. A linear decreasing weighted particle swarm optimization algorithm was used to optimize some hyperparameters of the neural network. This method cannot effectively learn the capacity degradation trend with a single CNN model when encountering a sudden upward or a sudden downward change in capacity data. Chang et al. (2021) proposed a wavelet neural network combined with genetic algorithm for SOH estimation. After the incremental capacity curve was obtained, the important health feature variables were extracted using Pearson correlation coefficients, and then the initial parameters of the wavelet neural network were optimized using a genetic algorithm. This method can effectively extract local information, but cannot globally learn the capacity degradation trend effectively. Cui et al. (2021) used a coupling-loop nonlinear auto regressive neural network for SOH prediction, in which the weights of the neural network were optimized by the Bayesian regularization algorithm. It can be noted that the above data-driven-based methods are not dependent on the battery model and do not require the measurement of open circuit voltages. As a result, data-based methods have become a hot research topic for SOH estimation.
The SOH of lithium-ion batteries is a time series of performance degradation. The previous researches based on the data-driven method tended to lose sequence information, which had difficulty in capturing the long-term dependent characteristics of the aging process of batteries. There is still a problem of low accuracy when performing complex nonlinear time series forecasting. To achieve better approximation of the function and improve the estimation accuracy of SOH, this paper proposed an attention mechanism (AM) combined with the LSTM network model, hereafter referred to as AM-LSTM. First, the discharge capacity data for each complete charge/discharge cycle is extracted from the dataset, and the moving average filter is applied for noise reduction. Then, the capacity data collected at the end of each charge/discharge cycle is used as input, and AM is introduced based on LSTM. The AM is a resource allocation mechanism that assigns different weights to input features and thus highlights the role of important information. The AM-LSTM is used to train and predict the capacity value of the next stage to determine whether the SOH reaches EOL and thereby how the battery should be handled. Finally, validation is performed on the NASA battery dataset and the university of Maryland battery dataset with different types, different rated capacities and different charge/discharge rates. The results show that the method proposed in this paper has high accuracy, obvious simplicity and excellent robustness.
The remainder of the paper is organized as follows: Section 2 describes the proposed SOH prediction method based on the AM-LSTM model. Section 3 presents the experimental datasets and the performance evaluation indicators used in this paper. Section 4 analyzes the experimental results and validates the accuracy and robustness of the proposed method in comparison with three other SOH prediction methods. Section 5 summarizes the work done in this paper.
2 The proposed state-of-health prediction method based on AM-LSTM model
2.1 Data preprocessing based on the moving average filter and min-max normalization
After obtaining the battery datasets, the capacity data collected at the end of each charge/discharge cycle should first be extracted. In the process of data acquisition, there may be missing or abnormal data due to human factors or system problems. To better estimate and predict this capacity, it is necessary to clean up the data using the moving average filter and the min-max normalization. The purpose of the moving average filter is to reduce the noise of the data. The moving average filter is to consider N successively acquired sample values as a queue. The length of the queue is fixed to N. Each time an unknown data is sampled, the sampled data is put at the end of the queue, and the data at the top of the queue is discarded, following the first in first out (FIFO) principle. The new filtering result is obtained by taking the arithmetic average of the N data in the queue.
Min-max normalization algorithm is used to normalize the capacity data in order to speed up the training of the model, improve the prediction accuracy, and ensure the faster convergence of the program when running. Min-max normalization restricts the capacity data to a specific range that is needed after processing. In this paper, the capacity data is mapped to be processed within the range of 0–1. The definition of min-max normalization is as follows:
where xnorm is the min-max normalized capacity data, x is the real capacity data, xmax and xmin are the maximum and minimum values in the real capacity data respectively. The min-max normalized capacity data are in the interval [0,1].
2.2 Long short-term memory architecture
The LSTM network is a temporal recurrent neural network (RNN), which is one of the most widely used neural networks in nonlinear dynamic systems (Graves, 2012; You et al., 2017; Tan and Zhao, 2019). It can effectively handle time series data and is mainly used to solve the long-term dependence problem present in RNN. The LSTM is a specific kind of RNN that also has a chain-like structure. It has four neural network layers, each of which interacts with each other in an exceptional way. As a nonlinear model, the LSTM can be used as a complex nonlinear unit for constructing larger deep neural networks. The main breakthrough of LSTM compared with traditional recurrent neural networks is the design of memory cells. Memory cells have the function of selective memory, which can selectively remember the important information and filter out the noisy information to reduce the memory burden.
The basic structure of LSTM is shown in Figure 1. Where xt is the input, ht-1 is the output of the previous unit, ht is the output of the current unit, Ct-1 is the previous memory cell state, Ct is the memory cell state, σ is the Sigmoid-type activation function, tanh is the hyperbolic tangent-type activation function, ft is the forget gate, it is the input gate, and Ot is the output gate. A state of transmission unit is equivalent to a conveyor belt that runs through the entire structure, it should ensure the invariance of the information transfer in the process by only some linear action. The LSTM also has an excellent characteristic of managing the information transmission through threshold, which selectively allowing information to pass through.
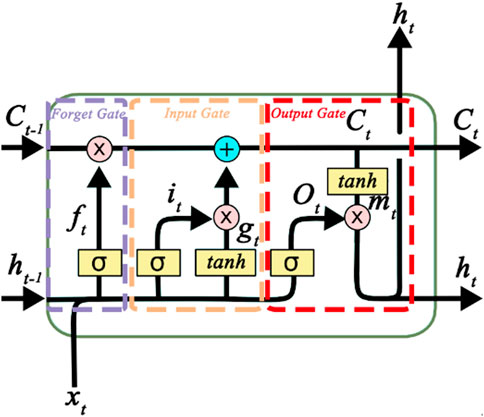
FIGURE 1. The basic structure of LSTM.
The processing flow of the LSTM algorithm is as follows:
Step 1: Taking the input xt of the current layer and the output ht-1 of the previous layer as input, Eq. 4 is used to calculate the forget gate ft value. The forget gate determines which information coming from the preceding unit needs to be discarded from the unit state.
where ft is the output of forget gate, Wxf and Whf is the weights of the linear relationship, bf is the bias.
Step 2: Update state information and decide which new information need to be stored in the unit state. It is controlled by two parts, one of which is a sigmoid layer that determines which ones need to be updated. Eq. 5 is used to calculate the input gate it value. Then, Eq. 6 is used to create a vector gt in the tanh function. It contains the brand-new information which can be added to the new unit state. After that, the unit state is updated by combining the information from these two parts. First, the state of the old unit is updated. Second, new information is inputted to the new unit state. Then, the update gate operation is completed.
where it is the output of the update gate, gt is a vector created by the tanh function. Wxi, Whi, Wxg, and Whg are the weights of the linear relationship, bi and bg are the biases.
Step 3: Using Eq. 7 to update the memory cell information. The memory cell information is updated from Ct-1 to Ct. The memory cell information can be selectively modified through the operation of the forget gate and the input gate. The memory cell information at this moment can be obtained.
where Ct is the memory cell state, Ct-1 is the previous memory cell state,
Step 4: Outputting a new state information. Eq. 8 is used to calculate the output gate Ot value. The sigmoid layer is used to determine the information related to the memory cell state to be output, and then tanh function is used to process the memory cell state using Eq. 9. The multiplication operation of the two parts of information is the new state information to be output, using Eq. 10.
where Ot is the output of the output gate, Wxo and Who are the weights of the linear relationship, bo is the bias, mt is the output of the memory cell passing through the tanh layer, ht is the output of the current unit.
2.3 Attention mechanism architecture
The AM is derived from simulations of human brain attention (Niu et al., 2021). It is based on the core idea that the human brain allocates more attention to the important information due to its limited information-processing ability. The AM is reflected in the model by assigning different weights to the input features by means of probability assignment, highlighting the inputs that have greater impact on the results and ignoring the irrelevant information. It helps the model to improve accuracy without increasing the computation and storage complexity of the model. In this paper, the AM is introduced to improve the situation that the LSTM network loses important capacity data information due to the excessive length of the temporal data by replacing the random assignment of weights with the probabilistic assignment of weights. The structure of AM is shown in Figure 2, where xt is the input capacity data at moment t, ht is the output of the LSTM layer at moment t.
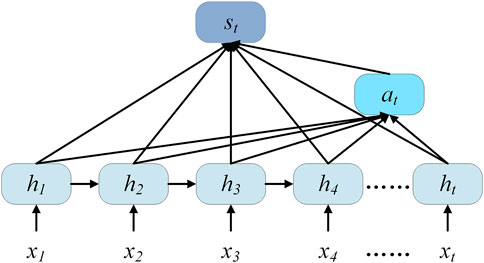
FIGURE 2. The structure of AM.
According to Eq. 11, et is the value of the hidden layer vector ht after one fully connected layer operation. According to Eq. 12, at is the attention weight of the t-th input. st is the output of the attention layer at moment t using Eq. 13.
where et is the probability distribution, u and w are the weights, and b is the bias.
2.4 AM-LSTM overall architecture
The overall structure of SOH prediction model designed in this paper is shown in Figure 3. The model mainly consists of an input layer, a LSTM layer, an attention layer, a dense layer, and an output layer.
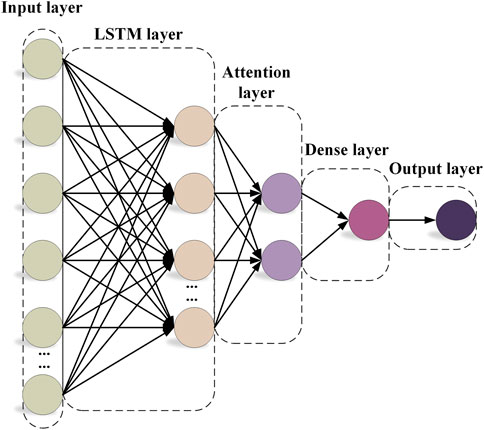
FIGURE 3. The overall structure of SOH prediction model.
The meaning of each layer in the model is as follows:
(1) The input layer: The capacity data are extracted at the end of each charge/discharge cycle of a lithium-ion battery and the moving average filter is introduced to preprocess the capacity data. The data are also min-max normalized and input into the SOH prediction model.
(2) The LSTM layer: The information is judged by many LSTM units. The important information is saved and the unimportant information is forgotten. Back propagation updates the parameters to achieve better output results.
(3) The attention layer: The AM is introduced and placed after the LSTM layer. The output of the LSTM layer is the input of the attention layer. The weight matrix is calculated using probabilistic assignment of weights. By keeping the intermediate outputs of the LSTM encoder for the input capacity sequences, a model is then trained to selectively learn these inputs and associate the output capacity sequences with them at the model output.
(4) The dense layer: The association between features is extracted and mapped to the output by the nonlinear variation of the dense layer.
(5) The output layer: The output of the dense layer is inversely min-max normalized to obtain the predicted values.
Suppose the input and output of the AM-LSTM model are X and Z, respectively. The relationship between the input and output can be expressed by a function
where the computation process of the
In order to make the prediction results have their physical meaning, the prediction results need to be inversely min-max normalized. The inverse min-max normalization equation is as follows:
where x is the real predicted capacity data, xnorm is the normalized capacity data, xmax and xmin are the maximum and minimum values in the real capacity data.
2.5 State-of-health prediction process by AM-LSTM model
The flow chart of SOH prediction for batteries based on AM-LSTM model is shown in Figure 4, including the offline part and the online part. A relatively excellent model is trained by the acquired data onto AM-LSTM network in the offline part. Then the optimal prediction model is selected for online SOH prediction by comparing the validation errors in the training process. Future capacity data are predicted by inputting the known capacity data into the AM-LSTM network in the online part, to determine whether the SOH reaches the EOL. The battery should be abandoned when the SOH exceeded the EOL. When the SOH does not reach the EOL, the next prediction is continued.
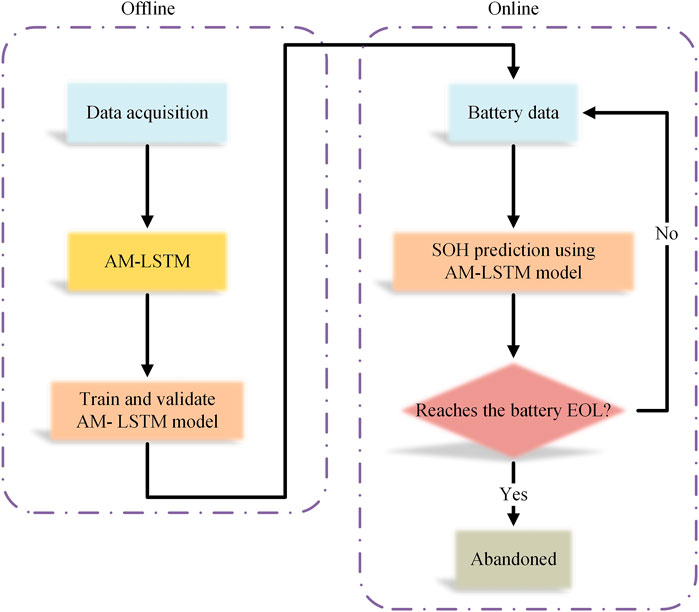
FIGURE 4. The flowchart of the SOH prediction based on the AM-LSTM model.
3 Experimental datasets and performance evaluation
3.1 The NASA dataset and the university of Maryland dataset
The NASA dataset was provided by the Prognostics Center of Excellence (PCoE) at NASA Ames (Saha and Goebel, 2007; Saha and Goebel, 2008). The test platform includes a programmable DC power supply, a thermostat, sensors, a data logger, and an electrochemical impedance spectrum tester. It is widely used in the study of aging characteristics of lithium-ion batteries. The experiments were conducted with 18,650 lithium-ion batteries. These lithium-ion batteries were run through three different operational profiles (charge, discharge and electrochemical impedance spectroscopy). Charging was done with 1.5A constant current until the battery voltage reaches 4.2V, and then continued in constant voltage mode until the charging current drops to 20 mA. In this process, the battery terminal voltage, the battery output current, the battery temperature, the charger voltage, the charger current, and the data-acquisition time were recorded. When discharging, a 2A constant current discharge was used until the voltages of batteries B5 and B6 dropped to 2.7 and 2.5V, respectively. In this course, the battery terminal voltage, the battery output current, the battery temperature, the load voltage, the load current, the data acquisition time and the discharge capacity of the batteries up to their respective cut-off voltages were recorded. For impedance measurements, the internal impedance of the battery was measured using electrochemical impedance spectroscopy (EIS) with a frequency sweep from 0.1 Hz to 5 kHz, recording the sensor current value, the cell current value, and the ratio of the two currents. Repeated charge and discharge cycles result in the accelerated aging of the batteries. In this paper, B0007 (B7) is used to train the model, and B0005 (B5) and B0006 (B6) are used to test the model. This study sets the EOL to 70% of the rated capacity, which means that the battery capacity decays by 30%.
Battery capacity data of the university of Maryland dataset were obtained by continuous charge/discharge experiments using the Arbin BT2000 battery experimental system from the Center for Advanced Life Cycle Engineering (CALCE) (He et al., 2011; Xing et al., 2013). The experiments were conducted with CS2 and CX2 lithium-ion batteries, which were different from 18,650 lithium-ion batteries. The charging and discharging experiments were carried out at room temperature, and the voltage and current data of the battery were recorded at certain time intervals. The impedance was obtained by scanning the electrochemical impedance spectrum for lithium-ion batteries with a frequency scan range of 0.1–50 Hz. In this paper, two types of batteries, CS2 series and CX2 series, are selected. Both types of batteries were charged with constant current and voltage, first at a constant current rate of 0.5°C to bring the voltage to 4.2 V, then maintaining 4.2 V until the charging current drops to 0.05 A. When discharging, each battery was discharged at a set discharge rate until the voltage drops to 2.7 V. These lithium-ion batteries were tested by charge/discharge cycles. Since the chemical composition and rated capacity of the three lithium-ion batteries in the two datasets are different, the battery characteristics are not the same, so the models have to be trained separately according to the different battery types. Battery capacity data are randomly selected for training model. In Section 4, CS2_35 (CS35) is used to train the model and CS2_36 (CS36) is used to test the model. CX2_36 (CX36) is used to train another model, and CX2_8 (CX8), CX2_16 (CX16), CX2_37 (CX37) and CX2_38 (CX38) are used to test the model.
The accuracy and robustness of the proposed method is tested on the NASA dataset and the university of Maryland dataset. In order to express each property of the battery more clearly, Table 1 shows the properties of all batteries.
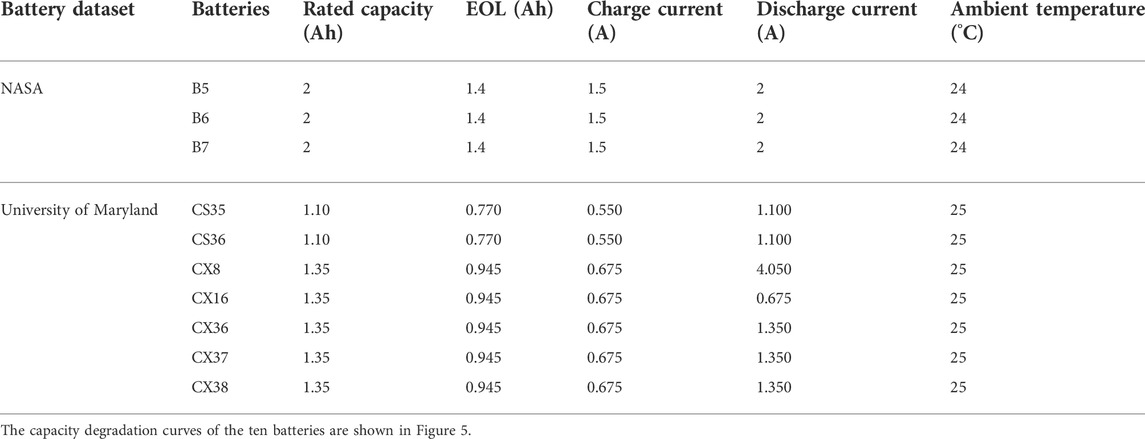
TABLE 1. Detailed parameters of all batteries.
Since the measured initial capacity of a lithium-ion battery is slightly larger than its rated capacity, the starting point of the capacity will be larger than the rated capacity point, so the SOH is greater than 100%. The capacity data are subjected to the moving average filter. The moving window size is set to three due to the small amount of data in the NASA dataset. However, the moving window size is set to five since the university of Maryland dataset has a large amount of data.
Capacity degradation curves for B5 and B6 from the NASA dataset are shown in Figure 5A. The capacity degradation curve sometimes has an upward bulge, called the capacity regeneration phenomenon. The capacity regeneration phenomenon can be considered as a sudden fluctuation of available capacity during battery degradation, which is mainly caused by electrochemical battery relaxation after a suspension or idle period. The capacity of B5, B6, and B7 drop faster mostly because the charge and discharge current are higher, accelerating the aging degree of the battery. University of Maryland dataset are shown in Figures 5B,C. When the capacity drops to 0.8Ah, the capacity of CS35 and CS36 drops sharply, as shown in Figure 5B. This indicates that when the real capacity reaches about 70% of the rated capacity, the battery performance drops sharply and the battery should be replaced as soon as possible or appropriate measures should be taken. Figure 5C represents the battery capacity degradation curves of CX8, CX16, CX36, CX37, and CX38, where degradation curve of CX8 fluctuates greatly since its discharge rate is 3.0°C. The effective cycle numbers of CX16 are longer because its discharge rate is only 0.5°C. The discharge rate of CX36, CX37, and CX38 is 1.0°C and the degradation trends is relatively smooth. Therefore, the degradation rate is directly related to the discharge rate.
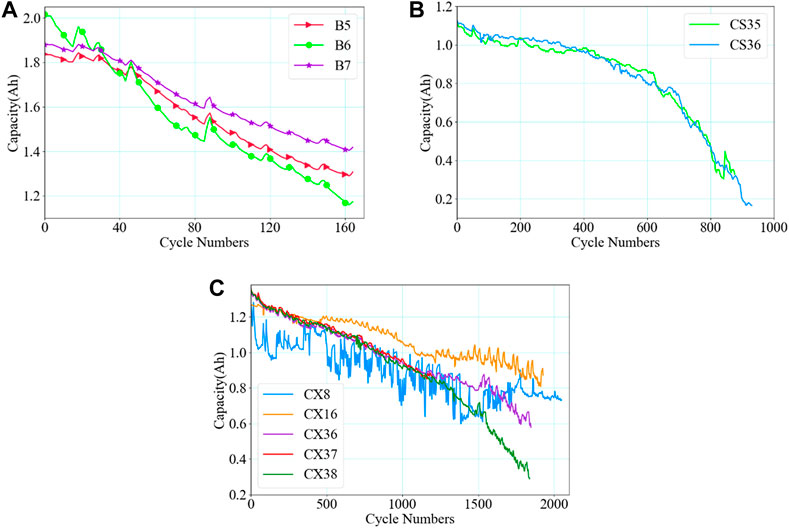
FIGURE 5. The capacity degradation curves of the ten batteries: (A) the real capacity of B5, B6, and B7 batteries from the NASA dataset; (B) the real capacity of CS35 and CS36 batteries from the university of Maryland dataset; (C) the real capacity of CX8, CX16, CX36, CX37, and CX38 batteries from the university of Maryland dataset.
3.2 Prediction Performance Evaluation
After training the network, it was necessary to evaluate the performance of well-trained AM-LSTM capacity prediction model. In order to effectively evaluate the proposed method, three performance evaluation indicators are used. The most commonly used performance indicators are the root mean square error (RMSE), mean absolute error (MAE), and R-square (R2). The closer the RMSE or MAE is to zero, the higher the accuracy of the proposed method. R2 is the goodness of fit, which is the degree to which the predicted capacity curve fits the real capacity curve. The closer the R2 is to one, the closer the predicted capacity value is to the real capacity value. The calculation equation is as follows:
where Ct is the real capacity data, Ĉt is the predicted capacity data,
4 Experimental results and discussion of the proposed state-of-health prediction method
In this section, the accuracy and robustness of the proposed AM-LSTM-based SOH prediction method are verified. From the comparative perspective, performance comparisons are made using other existing neural network models, including CNN, RNN, and LSTM. In Section 4.1, the comparison is conducted in terms of different datasets. Two batteries from NASA dataset and two batteries from university of Maryland dataset are selected as experimental subjects. In Section 4.2, the comparison is made from the perspective of different discharge rates, and three batteries from university of Maryland dataset are selected as testing subjects.
In this study, all the tests are implemented in PyCharm Community Edition 2021.2.3 with an AMD R7-5800H CPU and a RTX3050Ti graphics processing unit (GPU). The proposed network, as well as the three neural networks is compared, has a sequence length of 3 for each input to the network. The number of input nodes of the proposed AM-LSTM model is 3 and the number of output nodes is 1. The training is stateless, and the network uses the default training method of Keras, i.e., stateless LSTM. This model all uses a single-tier architecture. The number of nodes in LSTM layer, Attention layer and Dense layer are set to 64, 2, and 1 respectively. The number of nodes in the LSTM network layer of the proposed method is 64, which is determined based on the amount of data, the type of task, the acceptable computational complexity considerations and some priori knowledge of the authors. The activation functions of LSTM layer and Attention layer are both tanh function. The error function is the mean square error function. Optimization function of the Adam algorithm adaptively updates the learning rate. And four neural networks are implemented in python 3.6 using the deep learning framework Keras. The network structure is clear and the proposed method AM-LSTM is simple.
4.1 The accuracy and robustness of the proposed method to different datasets
To verify the accuracy and robustness of the proposed method to different datasets, the NASA dataset and the university of Maryland dataset are selected in this work. In the training phase, the whole training dataset is divided into two parts, namely, the training data and the validation data. The previous 50% capacity data of the training dataset are used for training the network and the other 50% are used for validation. The training data are all presented to the network and the parameters are updated according to the error function. The validation data are used to evaluate the generalization ability of the network to avoid overfitting and to stop training when the error no longer decreases. In the testing phase, the new data can be used directly to evaluate the performance of the trained model without relearning.
In the NASA dataset, B7 battery is selected for training. The battery capacity data is randomly selected for the training model. The iteration numbers are set to 300 and the batch-size are set to 10. After training the AM-LSTM capacity prediction model, it is crucial to verify the capacity prediction performance of the model on untrained batteries. So, B5 and B6 batteries are selected for whole life cycle testing using the B7 trained model.
In the university of Maryland dataset, two types of batteries are selected, that are CS and CX. CS35 and CX36 batteries are selected for independent training, respectively. The iteration numbers are set to 500 and the batch-size are set to 10. After the training, CS36 is selected for whole life cycle testing using the CS35 trained model. And CX37 is selected for testing using the CX36 trained model.
Depending on the battery type, Table 2 details the performance of the training process, i.e., the RMSE of the training data and the RMSE of the validation data.
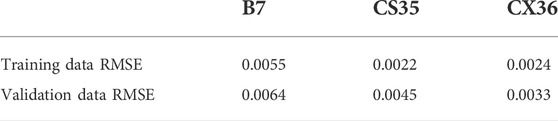
TABLE 2. Training performance of the models.
Firstly, considering from the result aspect, it can be seen from the above table that the RMSE of the validation data is slightly larger than the RMSE of the training data, which is comparable to the training set, without overfitting. And the three models are tested well on the new battery, which proves that the proposed method has good generalization and no overfitting phenomenon. Secondly, considering from the network structure aspect, the proposed method only involves the LSTM and the attention mechanism and the fully connected layer, and the network structure is not particularly complicated, so it will not cause the overfitting phenomenon. In summary, considering both the results and the network structure, this model is basically free of overfitting.
The capacity prediction results of the proposed method for different batteries from different datasets compared with three other kinds of neural networks are shown in Figure 6.

FIGURE 6. The capacity prediction results of the proposed method for different batteries from different datasets compared with three other kinds of neural networks: (A) the capacity prediction result of B5 battery from the NASA dataset; (B) the capacity prediction result of B6 battery from the NASA dataset; (C) the capacity prediction result of CS36 battery from the university of Maryland dataset; (D) the capacity prediction result of CX37 battery from the university of Maryland dataset.
As can be seen from Figure 6, the capacity of the two batteries in the NASA dataset fading faster than that of the two batteries in the university of Maryland dataset, but the proposed method can still predict the capacity of the batteries accurately. In addition, from Figure 6, it can be seen that the capacity regeneration phenomenon is more obvious for B5 and B6 batteries, while it is not obvious for CS36 and CX37 batteries. The other three existing algorithms do not have good stability for capacity regeneration phenomenon prediction. However, the proposed AM-LSTM model is not affected by the uncertainty caused by the capacity regeneration phenomena. It is worth noting that the B5, CS36, and CX37 are three lithium-ion batteries of different types and have different rated capacities. But the proposed method still shows an outstanding prediction performance. Another noteworthy point is that the discharge cut-off voltage of B5 battery is 2.7°V and the discharge cut-off voltage of B6 battery is 2.5°V. From Figures 6A,B, it can be seen that the proposed prediction method is not affected by the different discharge cut-off voltages of the batteries. In addition, the three existing algorithms gradually increase the error in the late stage of capacity prediction, while the proposed method does not show a similar situation. In practical applications, end of life is usually late in the life of the battery, so accurate prediction of late battery capacity is also critical. Table 3 further shows the performance of the proposed method compared with the other three methods for untrained batteries capacity data from NASA dataset and university of Maryland dataset.

TABLE 3. The performance evaluation indicators of the proposed method compared with other neural networks.
The proposed method RMSEs of B5, B6, CS36, and CX37 batteries are 0.0073, 0.0127, 0.0037, and 0.0017, respectively. For the above mentioned batteries, the MAEs are 0.0059, 0.0091, 0.0023, and 0.0013, respectively. For the RMSEs of the four batteries, the proposed method reduces the RNN results by 35.40%, 42.79%, 49.32%, and 72.58%, respectively. The proposed method in this paper reduces by at least 35.4% over the other three methods. For the MAEs of four batteries, the proposed method is 0.0015, 0.006, 0.0024, and 0.0027 lower than the optimal results of the three existing algorithms, improving the prediction accuracy by at least one-fifth. For the average of the MAE evaluation indicator of the four batteries, the proposed method is at least 3.275*10–3 lower than the other three methods. The R2 of the proposed method is closer to 1 than all the other three methods, indicating that the proposed method has the best goodness of fit for the capacity prediction curves. All of the three evaluation indicators in Table 3 show that the proposed method has the highest prediction accuracy. Because the AM controls the output of the LSTM, the AM gives different weights to the LSTM output so that the final prediction result is the most accurate.
In conclusion, the prediction results of the four batteries confirm that the proposed AM-LSTM model have an excellent prediction ability with strong robustness and could effectively predict the battery capacity at different datasets. In fact, the decay rate of the battery capacity, the battery capacity regeneration range, the battery type and the discharge cut-off voltage of the battery do not affect the prediction accuracy of the proposed method. Moreover, it is important to note that the proposed AM-LSTM model provides the best battery capacity prediction in the entire degradation process compared with the CNN, the RNN and the LSTM methods. The SOH prediction methodology described in the paper can be used to other types of cyclically operating electrochemical batteries. Our model makes a more reliable and more accurate SOH prediction of lithium-ion batteries, which can provide more reliable SOH reference to guarantee system security and reduce the cost of using batteries.
4.2 The accuracy and robustness of the proposed method to different discharge rates
In this section, the model trained with the CX36 battery in the previous section is still used, and the CX16, CX38, and CX8 battery capacity data are selected for testing. Among them, the discharge rates of CX16, CX38, and CX8 batteries are 0.5C, 1.0C, and 3.0C, which simulate the decelerated motion, uniform motion and accelerated motion of new energy vehicles, respectively. The capacity prediction results of the proposed method for different discharge rates of batteries compared with three other kinds of neural networks are shown in Figure 7. It can be seen that the capacity degradation curve shakes violently when the new energy vehicle does deceleration or acceleration motion, which is directly related to the size of the discharge rate. As the battery discharge rate increases, the battery capacity decay rate accelerates sharply. Therefore, it can be inferred that the size of the discharge rate affects the remaining useful life of the battery.
FIGURE 7. The capacity prediction results of the proposed method for different discharge rates of batteries compared with three other kinds of neural networks: (A) the capacity prediction result for CX16 battery with a discharge rate of 0.5C; (B) the capacity prediction result for CX38 battery with a discharge rate of 1.0C; (C) the capacity prediction result for CX8 battery with a discharge rate of 3.0C.
As can be seen from Figure 7, the CNN model-based prediction method has the largest prediction error. Because the elements of the CNN are independent of each other, and the input and output are also independent, so the CNN is not exactly suitable for learning capacity time series, and the results are not good. In the prediction problem of capacity time series studied in this paper, the elements are all interconnected. The RNN method and the LSTM method are better than the CNN method for prediction. In comparison with the CNN model, the RNN and the LSTM models can predict the capacity more accurately because they have memory functions. The RNN can be considered as a deep feedforward neural network where all layers share the same weights, but it is difficult to learn and retain information over time. To solve this problem, the LSTM with a special implicit unit is used in order to preserve the input for a long time. The main difference between the LSTM and the RNN is that the LSTM adds a processor to the algorithm to determine whether the information is useful or not, and this processor is called a memory cell. The LSTM is well adapted to the dependence of long time sequences and solves the gradient vanishing problem of the RNN. Now it is being proved that the LSTM is an effective technique for solving long time sequence dependence problems. Therefore, the LSTM is well suited for the capacity sequence prediction problem. The proposed method in this paper uses a combination of the LSTM neural network and the AM. The AM is a resource allocation mechanism that assigns different weights to input features so that important features do not disappear with increasing step size, thus highlighting the role of important information and making it easier for the model to handle long time series of dependencies. The AM gives enough attention to the critical information to highlight the role of important information, which in turn improves the prediction accuracy of the model. The AM is placed after the LSTM network, and by obtaining the importance of the output features of the LSTM layer and replacing the random assignment of weights with probabilistic assignment of attention weights, the network is made to focus on the important capacity time series features in order to finally output more accurate capacity prediction results. So the AM-LSTM model has the best prediction effect.
From Figure 7, it can be seen that the higher the discharge rate of the battery, the shorter its useful life. As can be seen from Figures 7A–C, the capacity degradation curve of the CX16 battery undergoes a slight fluctuation in the middle period and a moderate fluctuation in the later period, and the CX8 battery fluctuates sharply throughout the whole cycle. From Figure 7B it can be seen that the CX38 battery is relatively smooth. Although the fluctuation characteristics of the capacity degradation curves vary considerably, it is observed that the whole degradation trend is well predicted, implying the satisfactory long-term capture performance of the AM-LSTM model. It is noteworthy that during the long-term prediction of capacity, the other three existing methods cannot predict accurately in the late stage of capacity prediction, while the proposed method can always maintain a stable and accurate prediction.
Table 4 illustrates the performance of the proposed method compared with the other three methods for batteries capacity data of different discharge rates. The evaluation indicators of the proposed method are all better than the other three methods. Both long-term decline trend and short-term regeneration phenomena are well captured as desired by using the AM-LSTM model. It is worth noting that the proposed method still keeps good prediction performance for high discharge rate of 3.0C. For CX8 battery, the RMSE of the proposed AM-LSTM model is just 0.0151, which is 33.5%, 24.1%, and 9.0% less than the CNN, the RNN and the LSTM, respectively. For the RMSEs of CX16, CX38, and CX8 batteries, the proposed method reduces 16.13%, 56.18%, and 9.04% over the LSTM algorithms. For the MAEs of the above battery, the proposed method reduces 32.5%, 69.01%, and 22.12% over the LSTM algorithms. For MAEs, the proposed method reduces by at least 22.12% compared to other methods. It can be seen that the AM can well capture the importance of capacity data features and assign effective attention weights, better build the prediction model, and effectively improve the prediction accuracy of the model. To sum up, the above experimental analyses show that the efficient capacity prediction can be achieved with excellent accuracy and good robustness to different discharge rates. Moreover, the proposed method can be applied to the online estimation of SOH in various states of motion. The prediction accuracy improvement of the proposed method in this paper is significant for the lithium-ion battery SOH prediction.
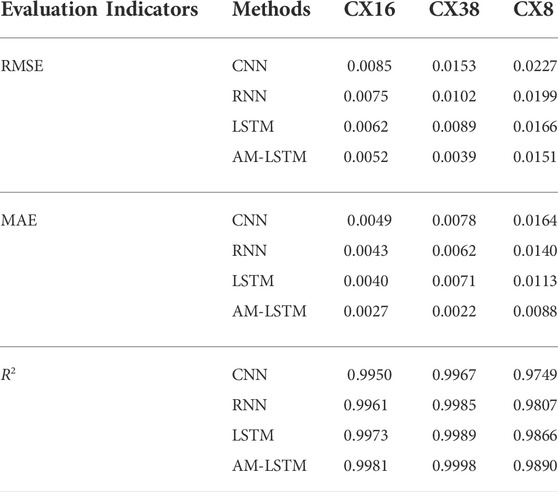
TABLE 4. The predicted evaluation indicators of the proposed method compared with other three capacity prediction methods.
From Figures 6, 7, the difference in the capacity prediction curves is not very obvious visually. However, in the case of CX37, its MAE evaluation indicator is 77.58% better than that of the CNN method, and the capacity degradation interval of CX37 is [1.3631, 0.8576], with a degradation size of 0.5055, which is already a greater improvement. The prediction accuracy improvement of the proposed method in this paper is significant for the lithium-ion battery state of health prediction. First, from a safety perspective, lithium-ion batteries may increase the chances of dangerous accidents if they are not replaced promptly after reaching their end of life. It will also cause the battery’s energy storage capacity to decrease, and the lack of energy storage will be charged more frequently, reducing the driver’s experience. Second, in terms of cost, if lithium-ion batteries are replaced with new ones before they reach their end of life, it will increase the financial burden on new energy automobile owners. Therefore, the accuracy improvement of the proposed prediction method can make more rational use of lithium-ion batteries, so this slight improvement can make a substantial difference.
As can be seen from Sections 4.1, 4.2, the three performance evaluation indicators RMSE, MAE, and R2 are all better than the other three capacity prediction methods for different datasets and different discharge rates. Furthermore, the method proposed is not affected by the dataset, the capacity degradation rate, the capacity regeneration extent, the battery type, the discharge cut-off voltage and the discharge rate, and can still accurately predict future capacity data. Therefore, the accuracy, robustness and simplicity of the proposed method in this paper are fully and effectively demonstrated.
5 Conclusion
In this study, a novel battery SOH prediction method of LSTM neural network combined with AM is proposed. The attention mechanism gives enough attention to the critical capacity feature information to highlight the role of important information, which in turn improves the prediction accuracy of the model. The proposed method captures the fundamental relationship between capacity decay data and performs SOH prediction for lithium-ion batteries. The NASA dataset and the university of Maryland dataset are used to validate in the paper. The experimental results show that the proposed AM-LSTM method has excellent accuracy and robustness as well as strong generalization ability under different capacity degradation rates, different capacity regeneration extents, different battery types, different discharge cut-off voltages and different discharge rates. In addition, the superiorities of the AM-LSTM model proposed in this paper is verified by a comparative study with CNN, RNN, and LSTM methods. The results show that the proposed method outperforms the other three methods in all performance indicators.
Accurate battery SOH prediction can make more reasonable use of lithium-ion batteries, effectively avoid irreversible consequences of battery overuse, and fully utilize batteries to reduce the economic burden of new energy vehicle owners. Simultaneously, the AM-LSTM model developed in this paper can be trained offline and implemented online, which enables online prediction of capacity. It is worth mentioning that the proposed method is highly accurate, robust and simple, and has the potential to be used for online SOH prediction of the electric vehicles which are powered by lithium-ion batteries.
Data availability statement
The datasets presented in this study can be found in online repositories. The names of the repository/repositories and accession number(s) can be found below:https://data.nasa.gov/dataset/Li-ion-Battery-Aging-Datasets/uj5r-zjdb, https://web.calce.umd.edu/batteries/data.htm.
Author contributions
XZ: Methodology, Software, Validation, Data Curation, and Writing—Original Draft. JS: Conceptualization, Investigation, Writing—Review, and Editing, Project administration. YS: Supervision, Writing—Review and Editing, Funding acquisition. SR: Formal analysis, Writing—review, and editing. YL: Investigation, Writing—review and editing. DW: Investigation, Writing—Review, and Editing.
Funding
This paper is supported by the National Natural Science Foundation of China (Nos. 62122041, 62173211), Shandong Provincial Key Research and Development Program (Major Scientific and Technological Innovation Project) (No. 2019JZZY010416), Shandong Provincial Science and Technology Support Program of Youth Innovation Team in Colleges (No. 2019KJN041).
Acknowledgments
The authors would like to acknowledge the support of the Shandong Provincial Demonstration Base for the Joint Cultivation of Graduates with Integrated Production and Education “New Generation Information Technology Joint Cultivation Base for Graduates with Integrated Production and Education.”
Conflict of interest
Author DW was employed by YanTai DongFang Wisdom Electric Co., Ltd.
The remaining authors declare that the research was conducted in the absence of any commercial or financial relationships that could be construed as a potential conflict of interest.
Publisher’s note
All claims expressed in this article are solely those of the authors and do not necessarily represent those of their affiliated organizations, or those of the publisher, the editors and the reviewers. Any product that may be evaluated in this article, or claim that may be made by its manufacturer, is not guaranteed or endorsed by the publisher.
References
Bi, Y., Yin, Y., and Choe, S. (2020). Online state of health and aging parameter estimation using a physics-based life model with a particle filter. J. Power Sources 476, 228655. doi:10.1016/j.jpowsour.2020.228655
Chang, C., Wang, Q., Jiang, J., and Wu, T. (2021). Lithium-ion battery state of health estimation using the incremental capacity and wavelet neural networks with genetic algorithm. J. Energy Storage 38, 102570. doi:10.1016/j.est.2021.102570
Chen, Z., Zhao, H., Zhang, Y., Shen, S., Shen, J., and Liu, Y. (2022). State of health estimation for lithium-ion batteries based on temperature prediction and gated recurrent unit neural network. J. Power Sources 521, 230892. doi:10.1016/j.jpowsour.2021.230892
Cui, Z., Wang, C., Gao, X., and Tian, S. (2021). State of health estimation for lithium-ion battery based on the coupling-loop nonlinear autoregressive with exogenous inputs neural network. Electrochim. Acta 393, 139047. doi:10.1016/j.electacta.2021.139047
Fan, Y., Xiao, F., Li, C., Yang, G., and Tang, X. (2020). A novel deep learning framework for state of health estimation of lithium-ion battery. J. Energy Storage 32, 101741. doi:10.1016/j.est.2020.101741
Graves, A. (2012). Supervised sequence labelling with recurrent neural networks. Long. short-term Mem. 4, 1735–1780.
He, W., Williard, N., Osterman, M., and Pecht, M. (2011). Prognostics of lithium-ion batteries based on dempster–shafer theory and the bayesian Monte Carlo method. J. Power Sources 196 (23), 10314–10321. doi:10.1016/j.jpowsour.2011.08.040
Kim, J., Krüger, L., and Kowal, J. (2020). On-line state-of-health estimation of lithium-ion battery cells using frequency excitation. J. Energy Storage 32, 101841. doi:10.1016/j.est.2020.101841
Li, R., Li, W., Zhang, H., Zhou, Y., and Tian, W. (2021). On-line estimation method of lithium-ion battery health status based on pso-svm. Front. Energy Res. 9, 693249. doi:10.3389/fenrg.2021.693249
Liu, B., Jia, Y., Yuan, C., Wang, L., Gao, X., Yin, S., et al. (2020). Safety issues and mechanisms of lithium-ion battery cell upon mechanical abusive loading: A review. Energy Storage Mat. 24, 85–112. doi:10.1016/j.ensm.2019.06.036
Liu, K., Shang, Y., Ouyang, Q., and Widanage, W. D. (2020). A data-driven approach with uncertainty quantification for predicting future capacities and remaining useful life of lithium-ion battery. IEEE Trans. Ind. Electron. 68 (4), 3170–3180. doi:10.1109/tie.2020.2973876
Luo, F., Huang, H., Ni, L., and Li, T. (2021). Rapid prediction of the state of health of retired power batteries based on electrochemical impedance spectroscopy. J. Energy Storage 41, 102866. doi:10.1016/j.est.2021.102866
Messing, M., Shoa, T., and Habibi, S. (2021). Estimating battery state of health using electrochemical impedance spectroscopy and the relaxation effect. J. Energy Storage 43, 103210. doi:10.1016/j.est.2021.103210
Niu, Z., Zhong, G., and Yu, H. (2021). A review on the attention mechanism of deep learning. Neurocomputing 452, 48–62. doi:10.1016/j.neucom.2021.03.091
Pan, H., Lü, Z., Wang, H., Wei, H., and Chen, L. (2018). Novel battery state-of-health online estimation method using multiple health indicators and an extreme learning machine. Energy 160, 466–477. doi:10.1016/j.energy.2018.06.220
Qian, C., Xu, B., Chang, L., Sun, B., Feng, Q., Yang, D., et al. (2021). Convolutional neural network based capacity estimation using random segments of the charging curves for lithium-ion batteries. Energy 227, 120333. doi:10.1016/j.energy.2021.120333
NASA Ames Saha, B., and Goebel, K. (2007). “Battery data set,” Moffett Field, CA: NASA Ames Prognostics Data Repository. Available at: http://ti.arc.nasa.gov/tech/dash/pcoe/prognostic-data-repository/.
Saha, B., and Goebel, K. (2008). “Uncertainty management for diagnostics and prognostics of batteries using bayesian techniques,” in Proceedings of the IEEE aerospace conference, 1–8.
Schmuch, R., Wagner, R., Hörpel, G., Placke, T., and Winter, M. (2018). Performance and cost of materials for lithium-based rechargeable automotive batteries. Nat. Energy 3 (4), 267–278. doi:10.1038/s41560-018-0107-2
Shang, Y., Liu, K., Cui, N., Wang, N., Li, K., and Zhang, C. (2020). A compact resonant switched-capacitor heater for lithium-ion battery self-heating at low temperatures. IEEE Trans. Power Electron. 35 (7), 7134–7144. doi:10.1109/tpel.2019.2954703
Shi, G., Chen, S., Yuan, H., You, H., Wang, X., Dai, H., et al. (2021). Determination of optimal indicators based on statistical analysis for the state of health estimation of a Lithium-ion battery. Front. Energy Res. 9, 690266. doi:10.3389/fenrg.2021.690266
Tan, X., Liu, X., Wang, H., Fan, Y., and Feng, G. (2022). Intelligent online health estimation for lithium-ion batteries based on a parallel attention network combining multivariate time series. Front. Energy Res. 10, 844985. doi:10.3389/fenrg.2022.844985
Tan, Y., and Zhao, G. (2019). Transfer learning with long short-term memory network for state-of-health prediction of lithium-ion batteries. IEEE Trans. Ind. Electron. 67 (10), 8723–8731. doi:10.1109/tie.2019.2946551
Wang, Y., Li, K., and Chen, Z. (2022). Battery full life cycle management and health prognosis based on cloud service and broad learning. IEEE-CAA J. Autom. 9 (8), 1540–1542.
Wang, Y., Tian, J., Sun, Z., Wang, L., Xu, R., Li, M., et al. (2020). A comprehensive review of battery modeling and state estimation approaches for advanced battery management systems. Renew. Sustain. Energy Rev. 131, 110015. doi:10.1016/j.rser.2020.110015
Wang, Y., Xu, R., Zhou, C., Kang, X., and Chen, Z. (2022). Digital twin and cloud-side-end collaboration for intelligent battery management system. J. Manuf. Syst. 62, 124–134. doi:10.1016/j.jmsy.2021.11.006
Wang, Z., Feng, G., Zhen, D., Gu, F., and Ball, A. (2021). A review on online state of charge and state of health estimation for lithium-ion batteries in electric vehicles. Energy Rep. 7, 5141–5161. doi:10.1016/j.egyr.2021.08.113
Wang, Z., Zeng, S., Guo, J., and Qin, T. (2019). State of health estimation of lithium-ion batteries based on the constant voltage charging curve. Energy 167, 661–669. doi:10.1016/j.energy.2018.11.008
Wei, Z., Zhao, J., Xiong, R., Dong, G., Pou, J., and Tseng, K. J. (2018). Online estimation of power capacity with noise effect attenuation for lithium-ion battery. IEEE Trans. Ind. Electron. 66 (7), 5724–5735. doi:10.1109/tie.2018.2878122
Xing, Y., Ma, E. W. M., Tsui, K. L., and Pecht, M. (2013). An ensemble model for predicting the remaining useful performance of lithium-ion batteries. Microelectron. Reliab. 53 (6), 811–820. doi:10.1016/j.microrel.2012.12.003
Xiong, R., Pan, Y., Shen, W., Li, H., and Sun, F. (2020). Lithium-ion battery aging mechanisms and diagnosis method for automotive applications: Recent advances and perspectives. Renew. Sustain. Energy Rev. 131, 110048. doi:10.1016/j.rser.2020.110048
Yang, D., Zhang, X., Pan, R., Wang, Y., and Chen, Z. (2018). A novel Gaussian process regression model for state-of-health estimation of lithium-ion battery using charging curve. J. Power Sources 384, 387–395. doi:10.1016/j.jpowsour.2018.03.015
Yang, Q., Xu, J., Li, X., Xu, D., and Cao, B. (2020). State-of-health estimation of lithium-ion battery based on fractional impedance model and interval capacity. Int. J. Electr. Power & Energy Syst. 119, 105883. doi:10.1016/j.ijepes.2020.105883
Yang, S., Zhang, C., Jiang, J., Zhang, W., Zhang, L., and Wang, Y. (2021). Review on state-of-health of lithium-ion batteries: Characterizations, estimations and applications. J. Clean. Prod. 314, 128015. doi:10.1016/j.jclepro.2021.128015
Yao, L., Fang, Z., Xiao, Y., Hou, J., and Fu, Z. (2021). An intelligent fault diagnosis method for lithium battery systems based on grid search support vector machine. Energy 214, 118866. doi:10.1016/j.energy.2020.118866
You, G. W., Park, S., and Oh, D. (2017). Diagnosis of electric vehicle batteries using recurrent neural networks. IEEE Trans. Ind. Electron. 64 (6), 4885–4893. doi:10.1109/tie.2017.2674593
Zhang, Y., Liu, Y., Wang, J., and Zhang, T. (2022). State-of-health estimation for lithium-ion batteries by combining model-based incremental capacity analysis with support vector regression. Energy 239, 121986. doi:10.1016/j.energy.2021.121986
Zubi, G., Dufo-López, R., Carvalho, M., and Pasaoglu, G. (2018). The lithium-ion battery: State of the art and future perspectives. Renew. Sustain. Energy Rev. 89, 292–308. doi:10.1016/j.rser.2018.03.002
Nomenclature
Abbreviations
AM Attention mechanism
AM-LSTM Long short-term memory neural network and attention mechanism
BMS Battery management systems
CALCE Center for advanced life cycle engineering
EIS Electrochemical impedance spectroscopy
EVs Electric vehicles
EOL End of life
FC Fully connected
FIFO First in first on
GPR Gaussian process regression
GPU Graphics processing unit
ICA Incremental capacity analysis
LSTM Long short-term memory
MAE Mean absolute error
NASA National Aeronautics and Space Administration
PCoE Prognostics center of excellence
RMSE Root mean square error
RNN Recurrent neural network
R2 R-square
SOH State of health
SVR Support vector regression
VC Voltage capacity
1DCNN One-dimensional convolutional neural network
Keywords: electric vehicles, lithium-ion batteries, state of health, long short-term memory, attention mechanism
Citation: Zhang X, Sun J, Shang Y, Ren S, Liu Y and Wang D (2022) A novel state-of-health prediction method based on long short-term memory network with attention mechanism for lithium-ion battery. Front. Energy Res. 10:972486. doi: 10.3389/fenrg.2022.972486
Received: 18 June 2022; Accepted: 25 July 2022;
Published: 30 August 2022.
Edited by:
Jun Yan, Harbin Engineering University, ChinaReviewed by:
Gautam Kumar, San Jose State University, United StatesYujie Wang, University of Science and Technology of China, China
Copyright © 2022 Zhang, Sun, Shang, Ren, Liu and Wang. This is an open-access article distributed under the terms of the Creative Commons Attribution License (CC BY). The use, distribution or reproduction in other forums is permitted, provided the original author(s) and the copyright owner(s) are credited and that the original publication in this journal is cited, in accordance with accepted academic practice. No use, distribution or reproduction is permitted which does not comply with these terms.
*Correspondence: Jing Sun, c3VuamluZ0BzZHUuZWR1LmNu