 Fatah Yahiaoui1
 Ferhat Chabour2Ouahib Guenounou1Faika Zaouche1
 Youcef Belkhier3
 Mohit Bajaj4
 Mokhtar Shouran5
 Elmazeg Elgamli5*
 Salah Kamel6
- 1Laboratoire de Technologie Industrielle et de l’Information (LTII), Faculté de Technologie, Universite de Bejaia, Bejaia, Algeria
- 2GREAH Laboratory, University of Le Havre, Lebon, France
- 3Centre for Ocean Energy Research, Maynooth University, Maynooth, Kildare, Ireland
- 4Department of Electrical Engineering, Graphic Era (Deemed to be University), Dehradun, India
- 5Wolfson Centre for Magnetics, School of Engineering, Cardiff University, Cardiff, United Kingdom
- 6Electrical Engineering Department, Faculty of Engineering, Aswan University, Aswan, Egypt
This paper presents the performances of an artificial intelligent fuzzy logic controller (FLC) based maximum power point tracking (MPPT) and a conventional perturb and observe (P&O) based MPPT controller is presented for a stand-alone PV system and tested in an emulated test bench experimentation. The studied system is composed of a DC power supply emulating the PV panel, a DC/DC boost converter, a variable resistive load and a real-time MPPT controller implemented in the dSPACE DS1104 controller. To verify the performance of the FLC proposed, several simulations have been performed in Matlab/Simulink environment. The proposed method outperforms the P&O method in terms of global search capability and dynamic performance, according to the comparison with the P&O method. To verify the practical implementation of the proposed method, the control of the emulated PV source and the MPPT algorithms are designed using the simulink/Matlab environment and implemented on dSPACE DS1104 controller. Experimental results confirm the efficiency of the proposed method and its high accuracy to handle the resistance varying.
1 Introduction
Photovoltaic (PV) systems are a clean energy technology that employs solar energy, the planet’s most abundant and broadly distributed renewable energy source. PV power generation systems have outperformed even the most optimistic predictions. The grid linked PV system, the stand-alone PV system, and the hybrid system are the three main types of PV systems now being used in different parts of the world (Mao et al., 2020). Stand-alone PV systems are utilized in distant and specialized locations including an energy storage system, usually installed as a battery system, although alternative options, such as fuel cells, are available. To fulfill the increased demand for alternative sources of energy, grid-connected PV systems are being used. Wind, tidal, and thermal energy may be used in conjunction with solar photovoltaic systems to create hybrid power systems (Mohapatra et al., 2017). However, Power fluctuations produced by atmospheric factors affect PV systems, i.e., solar irradiation and ambient temperature. Maximum power point tracking (MPPT) algorithms are used to harvest maximum power from a PV panel under specific operating conditions, allowing the generated power to be controlled (Mohapatra et al., 2017), (Zaouche et al., 2017).
Several publications have been published to help solar power plants extract the most power possible. In PV systems, a suitable MPPT controller tracks the maximum power point in all environmental conditions. In recent years, a number of MPPT controllers have been proposed, including P&O (Mohammadinodoushan et al., 2021; Mousa et al., 2021; İnci, 2021), incremental conductance (INC) (Nadeem and Hussain, 2021), and fuzzy logic controller (FLC) (Yang et al., 2020). A little variance in the step size causes the control parameter to be perturbed in the P&O approach. Due to the measurement of PV system output power, the orientation of the step size determined by the P&O technique is altered somewhat. When a PV system’s output power is lowered or raised, problems might arise (Sarvi and Azadian, 2021).
The P&O algorithm is the most commonly used MPPT algorithm in renewable energy conversion system because it is relatively simple to implement at low cost (Motahhir et al., 2020). The system control commands are determined using this method based on the difference in power output between the current and prior system states. However, this method has given rise to oscillations around the point of operation of MPP leading to significant energy losses (Zaouche et al., 2017), (Vicente et al., 2020). Furthermore, in rapidly changing atmospheric conditions, P&O does not adapt correctly. Because it is established on the equivalence of increment and conductance, the INC technique enables for the search for the greatest power to be achieved (Yilmaz et al., 2018). The P&O and INC controllers are among the most widely used MPPT controllers, owing to their ease of installation and straightforward design. Nonetheless, rapid changes in weather conditions have an impact on the controllers’ ability to function properly. Furthermore, even in constant climatic conditions, oscillations around the MPP have been seen using such methods. To put it another way, a decrease in Sun irradiation can have an impact on the operation of these controllers (Sarvi and Azadian, 2021). Recently MPPT methods based on artificial intelligence techniques such as artificial neural networks (ANN) and fuzzy logic controllers (FLC) have emerged (Yang et al., 2020). The FLC is another well-known MPPT controller that has significant advantages over traditional INC and P&O control strategies (Youssef et al., 2018). The outputs/inputs of these controller are fully dependent on system model information. In (Harrag and Messalti, 2019), it is suggested that an enhanced MPPT technique based on the SMC be used. The suggested controller’s key advantages are its fast dynamic response, high stability, and simplicity. A sliding mode MPPT based improved krill herd algorithm for variable step size P&O strategy is proposed in (Latifi et al., 2021), adaptive MPPT based sliding mode and fuzzy controls (Miqoi et al., 2019), optimized MPPT algorithm based on fuzzy logic control (Farajdadian and Hosseini, 2019). Recent studies (Dorji et al., 2020; Pandey et al., 2022) have compared between perturb and observe (P&O) and fuzzy logic based on PV-MPPT algorithms. Simulation results confirm the effectiveness of the FLC method.
When using a standard P&O strategy based on a predetermined step size perturbation, output power variations in solar systems are cancelled at the MPP, but this is not possible. It is possible to repair a quicker dynamic response by using greater step sizes, but this leads to huge changes with in output of photovoltaic panels around their maximum point and increased power loss. Small step sizes, on the other hand, lower PV array output power fluctuation, but they might lead to a delayed dynamic response when solar irradiation is quickly altered.
In this paper, performances of an artificial intelligent FLC and a conventional perturb and observe (P&O) controller are presented of a stand-alone PV system and tested in a real test bench experimentation using dSPACE DS1104 controller card. The studied system is composed by a DC power supply emulating the PV panel, a DC/DC boost converter, a resistive load and a real-time maximum power point tracking controller implemented in the dSPACE card. Under the above test conditions, a comparative analysis is performed for the proposed artificial intelligent FLC and conventional P&O control algorithm. Traditionally, the control algorithms of power converters in real time are designed with microcontrollers (Yang et al., 2020). But microcontrollers suffer from a limited performance when used in control applications requiring high operating speeds. Furthermore, comprehending the microcontroller capabilities is difficult in the event of complicated control structures, and programming them becomes a time-consuming operation, resulting in poor performance. A recent study (Altwallbah et al., 2022) presented a hardware implementation of a P&O algorithm under the partial shading condition on a digital signal processing controller (TMS320F28335). The digital processing boards (DSP) with rapid computational capacity, increased flexibility, and ease of programming have emerged, they may now serve as an alternative for numerical implementation of more complicated control algorithms. In this paper the dSPACE DS1104 controller is used to test the proposed control algorithms.
The main originality and contribution of the present work over the related papers in the literature are summarized as given below:
• An artificial intelligent fuzzy logic based MPPT controller and a conventional perturb and observe controller are presented for a stand-alone PV system, investigated and compared to demonstrate the superiority of the FLC over the conventional P&O.
• Extensive numerical investigations are made to demonstrate the robustness of the proposed FLC approach against parameter changes, external disturbances, and the conventional P&O.
• Extensive experimental validation is performed with a real test bench experimentation using dSPACE DS1104 controller.
The present form organizes the present paper: in Section 2, the system description is established. Section 3 deals with the proposed strategy design procedure. Section 4, described in detail the extensive numerical investigation of the proposed candidate strategy and the extensive experimental investigation. Finally, Section 5 deals with the main conclusion of the present paper.
2 PV system description
Figure 1 shows the diagram block of the stand-alone photovoltaic energy conversion system. It mainly contains a BP SX150S panel and a variable resistive load that are interconnected via a boost converter controlled by the MPPT controller:
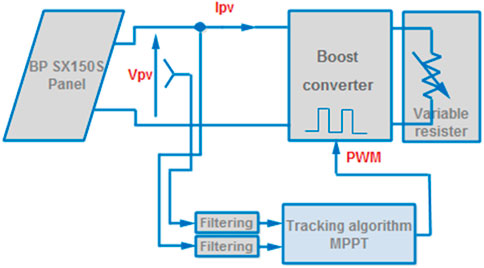
FIGURE 1. Diagram block of stand-alone photovoltaic energy conversion system.
2.1 BP SX150S panel modeling
The fundamental composition element of a PV panel is the solar cell. A cell can be assimilated to a photocell in generator convention. The BP SX150S PV panel is composed of 72 multi-crystalline silicon PV cells connected in series
The electrical circuit equivalent to a one-diode model is presented in Figure 2. The chosen model is efficient, less complex to model and reproduces the electrical characteristic of the BP SX150S panel, as shown in Figure 3. The mathematical equation of the PV panel model is given by the current
where
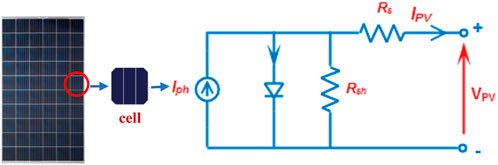
FIGURE 2. Modeling of a solar cell by the one-diode model.
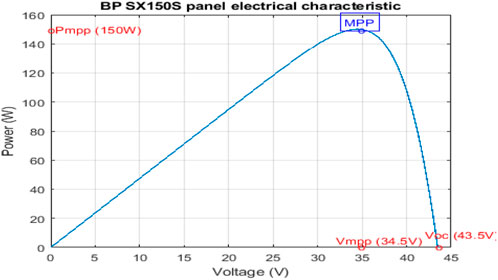
FIGURE 3. BP SX150S panel electrical characteristic.
Table 1 lists the electrical parameters of the BP SX150S panel used in this study, which are reported at Standard Test Condition (STC ie. 1000 W/m2 and 25°C).
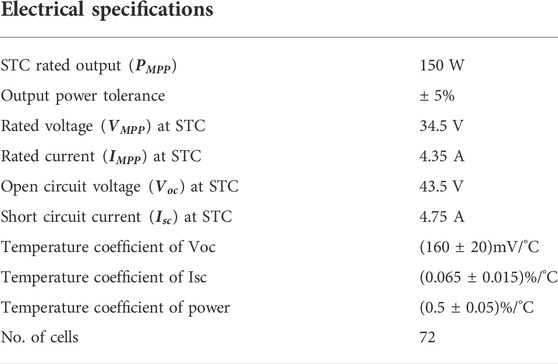
TABLE 1. Electrical specifications of BP SX150S panel at STC.
2.2 Boost converter modeling
Figure 4 shows the boost converter’s construction, which is used to boost the PV output voltage (Vo) for a resistive load. It controls the input source to load power transmission through a Pulse Width Modulation (PWM) technology provided by a high frequency regulating device called an Insulated Gate Bipolar Transistor (IGBT). A 10 kHz PWM signal is injected into the converter’s switch S by a controlling device.
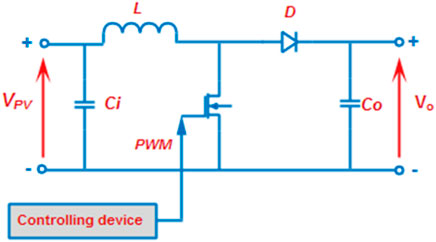
FIGURE 4. Structure of the Boost converter.
The PWM signal’s duty cycle D may be changed in real-time to follow the PV panel’s highest available power and extract as much of it as possible. The parameter values of the designed boost converter are listed in Table 2. The equations characterizing these parameters are given as follows (Weng et al., 2019):
where
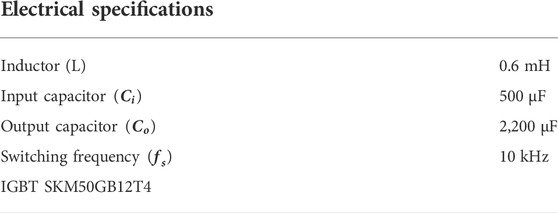
TABLE 2. Electrical specifications of Boost converter.
3 MPPT algorithms
3.1 Conventional perturb and observe algorithm
The P&O algorithm uses current and voltage sensors to measure the solar array’s output power. Because of its simplicity, the conventional P&O algorithm has been widely used. The algorithm mechanism has been depicted in Figure 5. After a prolonged process of data collection of perturbation and observation, the operating point converges to the MPP. The algorithm forecasts the time to approach MPP by comparing the power and voltages of time
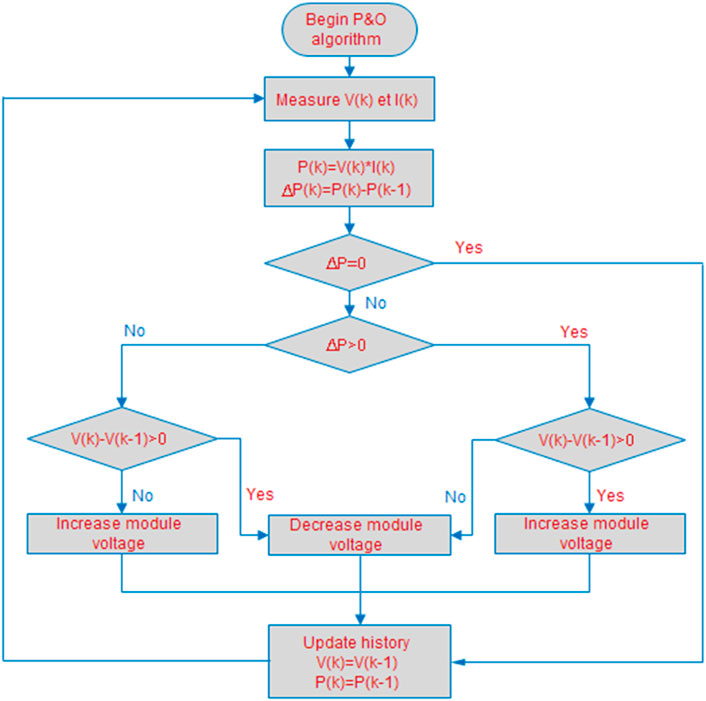
FIGURE 5. Flowchart of the P&O algorithm.
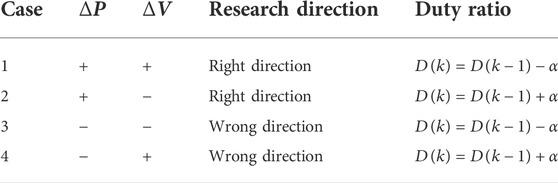
TABLE 3. MPP search rules.
3.2 The proposed fuzzy controller based MPPT algorithm
The MPPT algorithm based on a fuzzy logic controller (FLC) is an intelligent way of tracking the maximum power point in a PV system. It makes use of fuzzy set theory rather than a rigorous mathematical model. It is made up of a step-by-step adaptive search that achieves rapid convergence. Fuzzification, inference engine and defuzzification are functional blocks of the fuzzy controller. Figure 6 shows the main components of the Mamdani type fuzzy controller (Shiau et al., 2015).
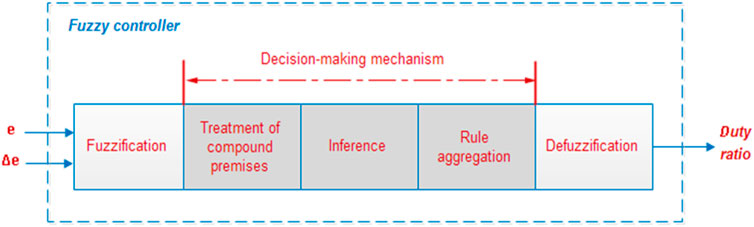
FIGURE 6. Fuzzy controller structure.
MFs are used to convert actual input values back to linguistic values during the fuzzification process. The “if-then” rules that make up the heuristic engine link the input and output. The defuzzification step is used to return the output linguistic variable to its original state of the clear output. The slope of the power-voltage curve
In this case, triangular and trapezoidal MFs are used as input and output because they are simple to implement and reduce computational complexity. These functions are simple to implement. For the linguistic variables depicted in Figure 10, P denotes positive and N denotes negative. Furthermore, the letters B, S, and ZE stand for Big, Small, and Zero. In Figure 9, each input variable,
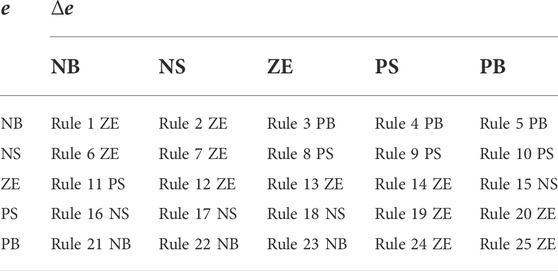
TABLE 4. Rule base table for fuzzy MPPT controller.
The error and error variation are the two inputs variables that are described at a sampling instant k by following:
The FLC determines the next operating point based on these two inputs, using MFs and a rule table. Depending on whether E is negative or positive, the operating point will be on the right or left side of the MPP. The MPP is reached that E is equal to zero. The
A fuzzy-based PI controller is considered in this work, with a duty ratio
where,
4 Results and discussion
4.1 Simulation section
The simulation tests of the PV system depicted in Figure 1 have been performed under MATLAB/Simulink environment. The panel’s maximum output power is 150W. The output capacitance and the series input inductance of the boost converter are

FIGURE 7. The PV system under MATLAB/Simulink.
The FLC output variable
The factor’s scaling output is set to 0.04. The increment step of the P&O method is set at 0.02.
The standard test conditions (STC) are adopted for the simulations, which are STC: S = 1000W/m2 and T = 25°C. Due to the lack of place, the impact of the variation of atmospheric conditions will be studied in future work.
The system is simulated in a 1s total time with a 50 µs fixed step size. At time 0.5 s, a variation of the load from R = 20 Ω to R = 14 Ω was performed to test the MPPT’s performance.
4.1.1 Simulation results discussion
Figure 8 shows the results of the generated PV currents for each the proposed FLC and the P&O method (Motahhir et al., 2020). In the presented results during the transient load step of R = 20 Ω between 0 and 0.5 s, it can be seen that the proposed FLC generates a current which is around the rated value 4.35 A with a tracking error of 4% and with extremely reduced oscillations (the minimal generated current is 4.2 A as shown in the zoom on the current given in Figure 8B). Contrary to the conventional P&O method, which generates a current around the rated value with an important tracking error of 27% and it presents a high oscillation (a minimal current value of 3.2 A is observed). In the second transient load step of R = 14 Ω between 0.5 and 1s, it is clearly observed that the proposed FLC shows the better current generation, which much perfectly the rated value 4.35 A as depicted in Figure 8. Contrary to the conventional P&O, which shows the lowest oscillations compared to the first step but a tracking error of 2% is observed (minimal current value of 4.26 A).
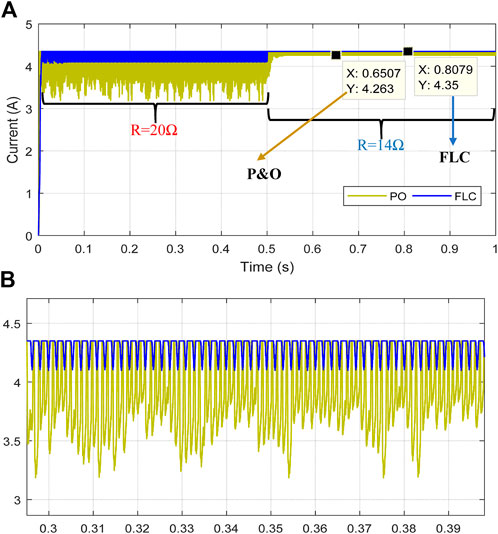
FIGURE 8. Generated PV currents for FLC and P&O controls. (A) current response. (B) Zoom on the current response.
Figure 9 shows the results of the generated PV voltages for each the proposed FLC and the conventional P&O. In the presented results during the transient load step of R = 20 Ω between 0 and 0.5 s; it can be seen that the P&O generates a voltage which is around the value 37 V which diverge from the maximum power point (MPP) voltage of 34.5 V as given in Table 1. Contrary to the proposed FLC method, which generates a voltage around the rated MPP voltage value. In the second transient load step of R = 14 Ω between 0.5 and 1s, it is clearly observed that both proposed FLC and P&O generate a voltage which much perfectly the MPP voltage value 34.5 V as depicted in Figure 9.
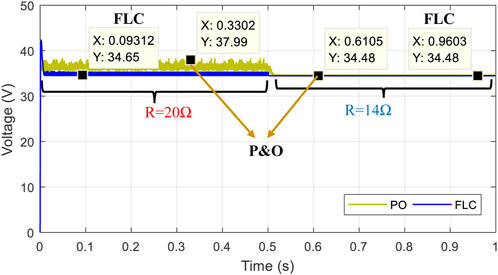
FIGURE 9. Generated PV voltages for FLC and P&O controls.
Figure 10 shows the results of the generated PV powers for each the proposed FLC and the conventional P&O. In the presented results during the transient load step of R = 20 Ω between 0 and 0.5 s; it is observed that the proposed FLC generates a power which is around the rated value 150 W with a tracking error of 6 W under the rated value and 1 W after the rated value which represents an error of 4.66% with extremely reduced oscillations. Contrary to the conventional P&O method, which generates power with an important tracking power error of 28.66% and it presents a high oscillation. In the second transient load step of R = 14 Ω between 0.5 and 1 s, it is clearly observed that the proposed FLC shows better power generation, which much perfectly the rated value 150 W as depicted in Figure 10. Contrary to the conventional P&O, which shows the lowest oscillations compared to the first step but a power loss of 1.26% is observed.
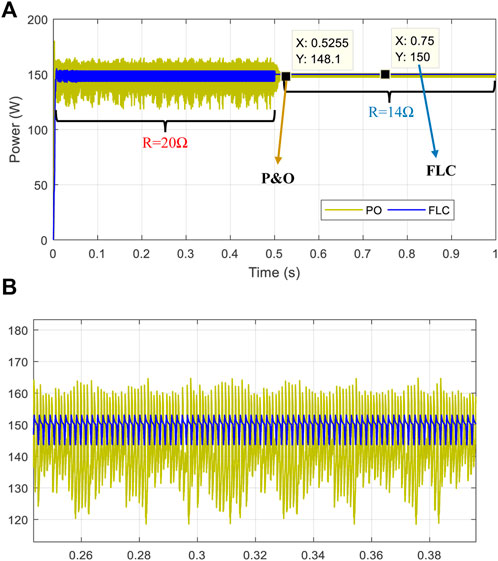
FIGURE 10. Generated PV powers for both FLC and P&O controls. (A) Power response. (B) Zoom on power response.
4.2 Experimental section
Figure 11 shows the experimental test bench of the emulated PV system. The hardware implementation has been developed in the GREAH laboratory - France. Different components of experimental test bench of the emulated PV system have been discussed in this section by giving a list of components and their specifications.
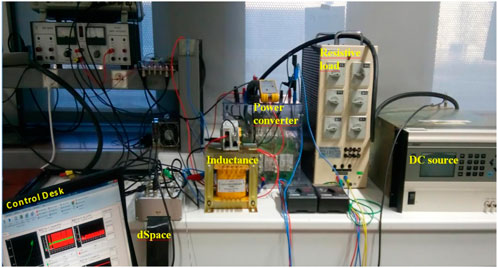
FIGURE 11. Laboratory experimental setup of the emulated PV system.
The suggested MPPT controller is implemented on a dSPACE DS1104 platform, which allows real-time testing. An Emulated PV Source (EPVS) was linked to a variable DC load using a boost converter which specifications are listed in Table 2. To generate the necessary PWM signal, a DS1104SL-DSP-PWM block is used. This later is depicted in Figure 12B. For the measurement of both the current and the voltage of the EPVS, two sensors have been used: Cleqee A622 for the current and TA057 for the voltage. The measured voltage and current are subsequently transformed to digital signals using a DSP Analog Digital Converter (ADC) interface that operates over a voltage range of −10 V to +10 V and filtered with implemented digital filters. By multiplying the instant current and voltage, the instantaneous power is computed. A gain scale of 10 and a gain scale of 20 are respectively programmed to rescale the measured current and voltage signals. Figure 12A shows the used Digital Analog Converter (DAC) blocks providing calculated EPVS’s current and voltage references that will be injected into the programmable DC source. In this study, the sampling step time is programmed equal to 50 µs
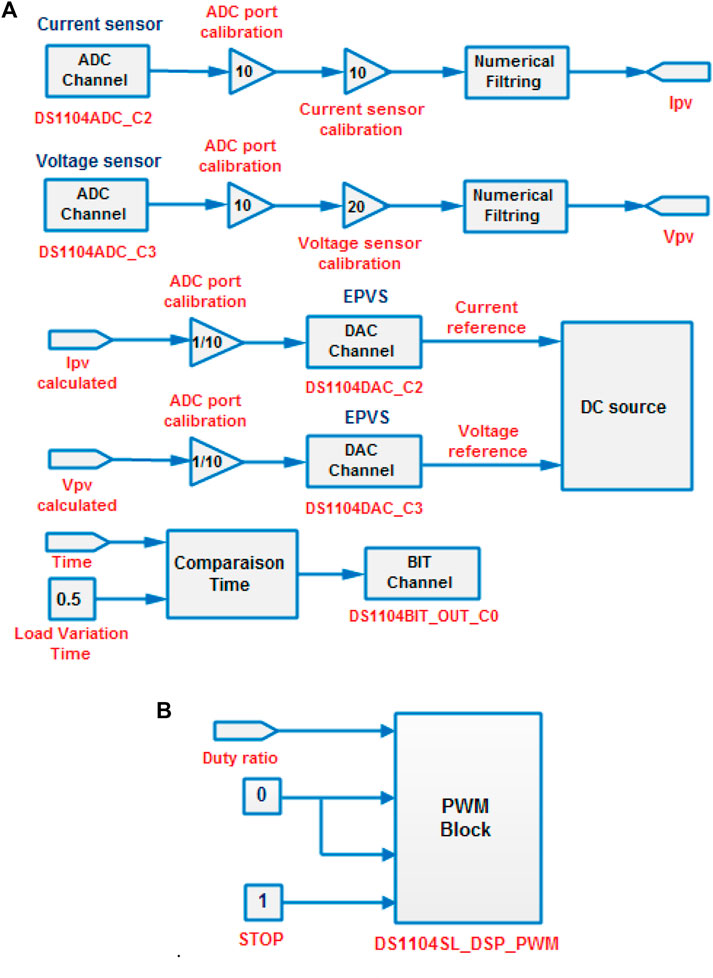
FIGURE 12. (A) ADC and DAC conversion blocks of the EPVS current and voltage, (B) PWM generation block.
4.2.1 Emulated PV source
A DC power supply Elgar 5,500 which is programmable is used to generate the output characteristics of a BP SX150S PV panel (Weng et al., 2019). This emulation makes it possible to compensate for the lack of the PV panel and facilitates the emulation of weather changes. The used Simulink model of the PV panel is implemented in a dSPACE DS1104 controller using a 50 µs sampling time. This last generates the PWM signals controlling the boost converter with a 10 kHz switching frequency. The analog signal (0–10 V range) required to control the DC power supply is generated from a DAC output. Figure 13 shows the practical characteristics of the EPVS obtained by varying the output current of the power DC supply.
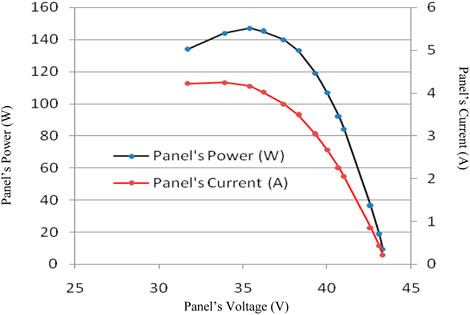
FIGURE 13. Electrical characteristics of the PV panel BP SX150S.
4.2.2 Experimental results discussion
In the experimental steps, the system is also tested in a 1s total time with a 50 µs fixed step size. At time 0.5s, a variation of the load from R = 20 Ω to R = 14 Ω was performed to test the MPPT’s performance is also applied in this testing part. Figure 14 shows the experimental current generated by the emulated PV system due to the proposed FLC and the conventional P&O. It is observed that the proposed FLC offers the best results as it shows extremely lowest oscillations compared to the P&O at the transient load step R = 20Ω and more important the current is maintained close to the rated value with the FLC than the second one at the transient load step R = 14Ω.
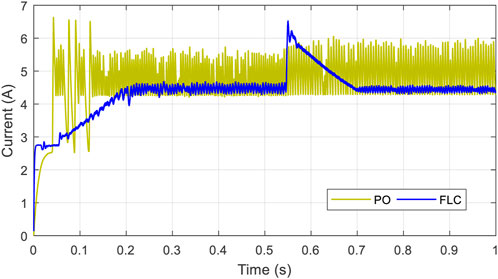
FIGURE 14. Experimental currents for both FLC and P&O controls.
Figure 15 presents the experimental generated voltage by both the FLC and P&O. Here also it is clearly shown that the first control maintains the generated voltage very close to the rated value with the fastest convergence than the P&O. Figure 16 shows the experimental generated power by the test bench. It is is clearly observed that the FLC offers the highest power generation and performance than the conventional control. In fact, the power generated by the FLC converges progressively to the MPP with a fast criterion, as can be seen at 0s where the conventional control shows oscillations between 0 and 0.2 s which is not good for the dynamic of the test bench.
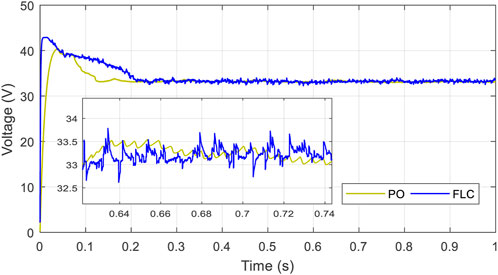
FIGURE 15. Experimental voltages for both FLC and P&O controls.
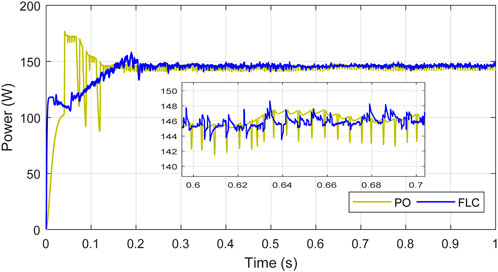
FIGURE 16. Experimental power for both FLC and P&O controls.
The comparative analysis of the proposed FLC and the conventional P&O shows that the FLC ensures fast convergence, high stability, and lowest tracking errors in comparaison to the conventional P&O. In a general way, the proposed method outperforms the P&O method in terms of global search capability. Thus, from the previous simulation and experimental results, the proposed method validates the objective mentioned in the introduction part which is to shows that the FLC based MPPT guarantee efficient, secure, and reliable power to the load side than the conventional MPPT methods.
5 Conclusion
This paper presents a simulation and experimental validation of a stand-alone photovoltaic system. A DC power supply imitating a solar panel, a DC/DC boost converter, a resistive load, and a real-time maximum power point tracking controller built-in a dSPACE DS1104 controller make up the investigated system. In the details of the work, performances of an intelligent FLC and a P&O controller are presented. Both simulated and experimental results are given to demonstrate the obtained performances. The main highlights of the present work are summarized as follows:
• The comparative analysis shows that the FLC proposed ensures fast convergence, high stability, and the lowest tracking errors in comparison to P&O method.
• The FLC proposed reacts quickly to load variations and keeps power at its highest level.
• The proposed FLC shows the lowest transitional state response time, and the steady state variations are significantly minimized over the P&O algorithm, which shows an overtaking.
The practical results obtained in the different tests show the effectiveness of the proposed method. The proposed method is a solution for solving the problem of MPP tracking and the study carried out in this paper answers the questions studied. This work can be used to implement different practical applications of solar energy conversion systems.
Data availability statement
The original contributions presented in the study are included in the article/Supplementary Material, further inquiries can be directed to the corresponding author.
Author contributions
All authors listed have made a substantial, direct, and intellectual contribution to the work and approved it for publication.
Conflict of interest
The authors declare that the research was conducted in the absence of any commercial or financial relationships that could be construed as a potential conflict of interest.
Publisher’s note
All claims expressed in this article are solely those of the authors and do not necessarily represent those of their affiliated organizations, or those of the publisher, the editors and the reviewers. Any product that may be evaluated in this article, or claim that may be made by its manufacturer, is not guaranteed or endorsed by the publisher.
References
Altwallbah, N. M. M., Radzi, M. A. M., Azis, N., Shafie, S., and Zainuri, M. A. A. M. (2022). New perturb and observe algorithm based on trapezoidal rule: Uniform and partial shaing conditions. Energy Convers. Manag. 264, 115738. doi:10.1016/j.enconman.2022.115738
Bennett, T., Zilouchian, A., and Messenger, R. (2012). Photovoltaic model and converter topology considerations for MPPT purposes. Sol. Energy 86 (7), 2029–2040. doi:10.1016/j.solener.2012.04.005
Dhaundiyal, A., and Atsu, D. (2019). Modeling of photovoltaic module using the MATLAB. JNRD-Journal Nat. Resour. Dev. 9, 59–69. doi:10.5027/jnrd.v9i0.06
Dorji, S., Wangchuk, D., Choden, T., and Tshewang, T. (2020). Maximum power point tracking of solar photovoltaic cell using perturb & observe and fuzzy logic controller algorithm for boost converter and quadratic boost converter. Mater. Today Proc. 27, 1224–1229. doi:10.1016/j.matpr.2020.02.144
Farajdadian, S., and Hosseini, S. H. (2019). Optimization of fuzzy-based MPPT controller via metaheuristic techniques for stand-alone PV systems. Int. J. Hydrogen Energy 44 (47), 25457–25472. doi:10.1016/j.ijhydene.2019.08.037
Guenounou, O., Belkaid, A., Colak, I., Dahhou, B., and Chabour, F. (2021). “Optimization of fuzzy logic controller based maximum power point tracking using hierarchical genetic algorithms,” in 2021 9th international conference on Smart grid (icSmartGrid) (New Jersey, United States: IEEE), 207–211.
Harrag, A., and Messalti, S. (2019). PSO-based SMC variable step size P&O MPPT controller for PV systems under fast changing atmospheric conditions. Int. J. Numer. Model. 32, e2603. doi:10.1002/jnm.2603
İnci, M. (2021). A flexible perturb & observe MPPT method to prevent surplus energy for grid-failure conditions of fuel cells. Int. J. Hydrogen Energy 46 (79), 39483–39498. doi:10.1016/j.ijhydene.2021.09.185
Kurokawa, K., Inui, T., Lin, L., and Fukui, M. (2016). “Development and evaluation of a photovoltaic emulation system,” in IEEE International Conference on Consumer Electronics (ICCE), Las, vegas,NV, USA, 07-11 junary, 2016.
Latifi, M., Abbassi, R., Jerbi, H., Ohshima, K., and khaksar, M. (2021). Improved krill herd algorithm based sliding mode MPPT controller for variable step size P&O method in PV system under simultaneous change of irradiance and temperature. J. Frankl. Inst. 358 (7), 3491–3511. doi:10.1016/j.jfranklin.2021.02.021
Mao, M., Cui, L., Zhang, Q., Guo, K., Zhou, L., and Huang, H. (2020). Classification and summarization of solar photovoltaic MPPT techniques: A review based on traditional and intelligent control strategies. Energy Rep. 6, 1312–1327. doi:10.1016/j.egyr.2020.05.013
Miqoi, S., El Ougli, A., and Tidhaf, B. (2019). Adaptive fuzzy sliding mode based MPPT controller for a photovoltaic water pumping system. Int. J. Power Electron. Drive Syst. 10 (1), 414. doi:10.11591/ijpeds.v10.i1.pp414-422
Mohammadinodoushan, M., Abbassi, R., Jerbi, H., Ahmed, F. W., and Rezvani, A. (2021). A new MPPT design using variable step size perturb and observe method for PV system under partially shaded conditions by modified shuffled frog leaping algorithm-SMC controller. Sustain. Energy Technol. Assessments 45, 101056. doi:10.1016/j.seta.2021.101056
Mohapatra, A., Nayak, B., Das, P., and Mohanty, K. B. (2017). A review on MPPT techniques of PV system under partial shading condition. Renew. Sustain. Energy Rev. 80, 854–867. doi:10.1016/j.rser.2017.05.083
Motahhir, S., El Hammoumi, A., and El Ghzizal, A. (2020). The most used MPPT algorithms: Review and the suitable low-cost embedded board for each algorithm. J. Clean. Prod. 246, 118983. doi:10.1016/j.jclepro.2019.118983
Mousa, H. H., Youssef, A. R., and Mohamed, E. E. (2021). State of the art perturb and observe MPPT algorithms based wind energy conversion systems: A technology review. Int. J. Electr. Power & Energy Syst. 126, 106598. doi:10.1016/j.ijepes.2020.106598
Nadeem, A., and Hussain, A. (2021). A comprehensive review of global maximum power point tracking algorithms for photovoltaic systems.. Energy Syst., 1–42. doi:10.1007/s12667-021-00476-2
Pandey, A. K., Singh, V., and Jain, S. (2022). “Study and comparative analysis of perturb and observe (P&O) and fuzzy logic based PV-MPPT algorithms,” in Applications of AI and IOT in renewable energy (Massachusetts, United States: Academic Press), 193–209.
Sarvi, M., and Azadian, A. (2021). A comprehensive review and classified comparison of MPPT algorithms in PV systems. Energy Syst. 13, 281–320. doi:10.1007/s12667-021-00427-x
Shiau, J. K., Wei, Y. C., and Chen, B. C. (2015). A study on the Fuzzy-logic based solar power MPPT algorithms using different fuzzy input variables. Algorithms 8 (2), 100–127. doi:10.3390/a8020100
Vicente, E. M., dos Santos Vicente, P., Moreno, R. L., and Ribeiro, E. R. (2020). High-efficiency MPPT method based on irradiance and temperature measurements. IET Renew. Power Gener. 14, 986–995. doi:10.1049/iet-rpg.2019.0849
Weng, X., Xiao, X., He, W., Zhou, Y., Shen, Y., Zhao, W., et al. (2019). Comprehensive comparison and analysis of non-inverting buck boost and conventional buck boost converters. J. Eng. (Stevenage). 2019 (16), 3030–3034. doi:10.1049/joe.2018.8373
Yanarates, C., Wang, Y., and Zhou, Z. (2021). Unity proportional gain resonant and gain scheduled proportional (PR-P) controller based variable perturbation size real-time adaptive perturb and observe (P&O) MPPT algorithm for PV systems. IEEE Access 9, 138468–138482. doi:10.1109/ACCESS.2021.3119042
Yang, B., Zhu, T., Wang, J., Shu, H., Yu, T., Zhang, X., et al. (2020). Comprehensive overview of maximum power point tracking algorithms of PV systems under partial shading condition. J. Clean. Prod. 268, 121983. doi:10.1016/j.jclepro.2020.121983
Yilmaz, U., Kircay, A., and Borekci, S. (2018). PV system fuzzy logic MPPT method and PI control as a charge controller. Renew. Sustain. Energy Rev. 81, 994–1001. doi:10.1016/j.rser.2017.08.048
Youssef, A., El Telbany, M., and Zekry, A. (2018). Reconfigurable generic FPGA implementation of fuzzy logic controller for MPPT of PV systems. Renew. Sustain. Energy Rev. 82, 1313–1319. doi:10.1016/j.rser.2017.09.093
Zaouche, F., Rekioua, D., Gaubert, J-P., and Mokrani, Z. (2017). Supervision and control strategy for photovoltaic generators with battery storage. Int. J. Hydrogen Energy 42 (30), 19536–19555. doi:10.1016/j.ijhydene.2017.06.107
Keywords: experimental validation, fuzzy logic control, intelligent control, stand-alone solar energy system, DSPACE platform
Citation: Yahiaoui F, Chabour F, Guenounou O, Zaouche F, Belkhier Y, Bajaj M, Shouran M, Elgamli E and Kamel S (2022) Experimental validation and intelligent control of a stand-alone solar energy conversion system using dSPACE platform. Front. Energy Res. 10:971384. doi: 10.3389/fenrg.2022.971384
Received: 17 June 2022; Accepted: 28 July 2022;
Published: 25 August 2022.
Edited by:
Sudhakar Babu Thanikanti, Chaitanya Bharathi Institute of Technology, IndiaReviewed by:
Daniel Tudor Cotfas, Transilvania University of Brașov, RomaniaKarthik Balasubramanian, McMaster University, Canada
R.P. Saini, Indian Institute of Technology Roorkee, India
Copyright © 2022 Yahiaoui, Chabour, Guenounou, Zaouche, Belkhier, Bajaj, Shouran, Elgamli and Kamel. This is an open-access article distributed under the terms of the Creative Commons Attribution License (CC BY). The use, distribution or reproduction in other forums is permitted, provided the original author(s) and the copyright owner(s) are credited and that the original publication in this journal is cited, in accordance with accepted academic practice. No use, distribution or reproduction is permitted which does not comply with these terms.
*Correspondence: Elmazeg Elgamli, RUxHQU1MSUVTQENBUkRJRkYuQUMuVUs=