 Mohamed Awad
 Ahmed M. Ibrahim2
 Adel El-Shahat
 Ahmed I. Omar
95% of researchers rate our articles as excellent or good
Learn more about the work of our research integrity team to safeguard the quality of each article we publish.
Find out more
ORIGINAL RESEARCH article
Front. Energy Res. , 04 August 2022
Sec. Smart Grids
Volume 10 - 2022 | https://doi.org/10.3389/fenrg.2022.969482
This article is part of the Research Topic IoT-Enabled Smart Grids: Stochastic Operation and Management View all 5 articles
According to the current directive, we must rely on green energy for sustainable mobility. One of the green transition’s goals is to use renewable energy to charge electric vehicles (EVs). Solar energy is a form of renewable energy sources, and it is classified as being clean, available, and renewable because it is based on sunshine. Nowadays, the world is turning to EVs which have lower running costs and cleaner environments. Lithium-ion batteries are commonly utilized to store energy in EVs. This article covers the design and analysis of a photovoltaic (PV) system to charge five models of EVs such as BMW i3 2019, Volkswagen e-Golf, Fiat 500e, Mercedes EQA 250, and Hyundai Kona Electric in a DC fast charging mode by using a buck converter to minimize the output voltage and without any addition of energy storage. By applying Perturb & Observe (P&O) Maximum Power Point Tracking (MPPT), the maximum power and efficiency from PVs are obtained. The charging time is calculated for each EV of the five models in the State of Charge (SOC) area at 20–80 percent. A MATLAB program is employed to simulate the EV models by calculating the efficiency of the MPPT controller, time of charging, and characteristic of voltage and current levels for each model of these EVs. All models are tested under the condition of irradiance level from 600 W/m2 to 1000 W/m2 and temperature between 20°C and 30°C. The results showed that the PV system is effective and economical as a stand-alone to charge EVs in a rapid charge mode.
Nowadays, rising energy consumption and climate change are caused by CO2 emissions (Al-Gabalawy et al., 2022). EVs, which are supplied entirely by electricity, had the potential to replace gasoline and diesel automobiles (Omar et al., 2019; Mohammed et al., 2021). In addition, renewable energy should be used to supply electric power to fulfill rising future demand and diminishing generating supplies. Solar energy is one of the important sources (Ismael et al., 2019; Omar et al., 2019). PV systems are supplied to charge electric cars, which is one of the applications of sustainable energy (Mohamed et al., 2020).
Most of the literature articles focused on two directions, the first trend in charging electric cars with grid-connected solar energy and the second trend in charging electric cars with off-grid solar energy. Prem et al. (2020) demonstrated a grid-connected Solar PV-based EV Charging Station with battery backup, as well as a large gain, fast charging DC-DC converter, and a control scheme using MATLAB software. Mahfouz and Iravani (2019) presented, designed, and evaluated a system architecture and control structure that minimizes the impact of DC fast-charging stations for electric vehicles on the AC grid using PLECS software. Killi and Samanta (2015) presented several different charging station architectures, which they compared and rated based on the power grid, modularity, and other characteristics. Shariff et al. (2018) examined the adoption of PV–EV charging systems in depth. Several approaches are given for obtaining information regarding charging patterns, charging equipment geolocation, and modes of operation among other things. In reflection of the beginning state of charge, feeding modalities, arrival time, leaving time, and topmost times suggested searching peak and valley algorithms to find the ideal charging or discharging beginning time for EVs Wang et al. (2020). Chandra Mouli et al. (2019) proposed that the testing waveforms and the measured efficiency of a 10-kW sample have been successfully verified. The converter can function as a PV inverter, an EV charger that works in both directions, or a hybrid of the two using a PV emulator. Modarresi Ghazvini and Olamaei (2019) presented a study to create and test a heuristic development technique for determining the appropriate design for a hybrid PV- diesel - battery system, utilizing V2G space lots as a controlled load. Shariff et al. (2019) presented a complete state-of-the-art study of the V2G system that described the mechanism used for the power stream under the V2G structure. It also highlighted the most significant business impediments to V2G adoption. In addition, Parsons et al. (2014) presented possible consumer demand for V2G electric vehicles. Based on a day-ahead planning profile produced by an EV aggregator, Karfopoulos et al. proposed a distributed EV organization mechanism that allows for the monitoring of an EV fleet’s charging and discharging operations, as well as V2G regulation programs to assist system operation (Karfopoulos et al. 2016). Ustun et al. proposed an IEC 61850-7-420 standard extension by proposing a system model for monitoring both the charging and discharging of electric vehicles (Iec et al., 2012). Mohamed and Mohamed, (2020) proposed a comparison of lithium-ion vs. lead-acid battery performance and is shown when used as a backup storage system to an off-grid PV system, in the MATLAB environment, the suggested system has been constructed and simulated using MATLAB software (Mohamed and Mohamed, 2020). Grande et al. (2018) used HOMER software to assess the technical and commercial viability of a PV off-grid for charging EVs and it has been associated with grid charging outlets in terms of efficiency. Youssef et al. (2018) evaluated the technical issues of (PV–EV) charging stations, in addition, to an overview that obtained studies on charging standards, power converter topologies, and controllers for both PV on-grid and PV freestanding DC charging schemes.
Sahoo and Mathew (2017) took advantage of the benefits of a zero current switching (ZCS), pulse width modulation (PWM) driven Full-Bridge Converter when PV system powered EVs rapid-charging places. The performance of an off-grid PV structure for charging EVs in a lengthy parking lot was investigated by Ghotge et al. Once a year, a simulated performance of charging is evaluated by analyzing the SOC at the leaving of EVs plugged in toward the parking lot (Ghotge et al., 2021). Yang et al. (2019) proposed a study to manage EV charging with locally produced wind power of buildings that can reduce the influences of EV charging calls on the grid. Chen et al. (2018) studied the effects of different fleet forms and EV charging options on emissions under varied wind integration. Mishra et al. proposed the design to charge E-bikes at work. The workplaces start opening normally in the day between 9 a.m. and 6 p.m. Sunlight is often available during this time. A solar PV system with an MPPT controller makes up the off-grid charging solution using MATLAB software (Mishra et al., 2021). Finally, Singh and Shimi (2017) used the perturb and observe approach in MATLAB to simulate the MPPT PV system. Irradiance variations are taken into account in the simulation model, while the temperature remains constant using MATLAB software. A comparison is made between non-MPPT and MPPT output.
A lot of research has studied the analysis and integration of PV on-grid systems that power the fast charging of EVs (Killi and Samanta, 2015; Mahfouz and Iravani, 2019; Prem et al., 2020). In 2018 (Shariff et al., 2018), the integration of a PV on-grid system that powers AC charging (low charging) for EVs has been illustrated. Recently, a group of researchers focused on the possibility of benefiting from EV batteries by feeding battery energy to the network at critical times that the consumer or the electricity network needs (Iec et al., 2012; Parsons et al., 2014; Karfopoulos et al., 2016; Chandra Mouli et al., 2019; Modarresi Ghazvini and Olamaei, 2019; Shariff et al., 2019; Wang et al., 2020). In off-grid systems, researchers focus on designing PV to charge EVs’ load in a fast-charging mode with battery storage (Sahoo and Mathew, 2017; Grande et al., 2018; Youssef et al., 2018; Mohamed and Mohamed, 2020). In addition, another study designed a PV off-grid system to provide ac power (low charging) for EVs that do not have battery storage (Ghotge et al., 2021). Some researchers have studied the analysis and integration of wind turbine on-grid systems that power the electric vehicles (Chen et al., 2018; Yang et al., 2019). Finally, two studies employed MATLAB simulation to investigate the concept of designing a PV off-grid system without battery storage using a boost converter with applied MPPT technique to achieve maximum power from the PV system (Singh and Shimi, 2017).
As a result, a lot of research discussed the PV on-grid systems. The main drawback of PV on-grid system is that when the grid goes down, the PV system will shut down (Mahfouz and Iravani, 2019; Gong et al., 2020; National Electrical Code Committee, and National Fire Protection Association., 2020).To solve this issue, it can be utilized with a hybrid system with energy storage, which adds a lot of extra costs. As well, a lot of research on off-grid classifications obtained the formation of a solar system with an energy storage system, which indicates a high price, especially for fast charging, which requires a high-energy storage method, which is very expensive (Grande et al., 2018; Mohamed and Mohamed, 2020).
This article introduces a PV system to charge five models of electric cars, which are BMW i3 2019, Volkswagen e-Golf, Fiat 500e, Mercedes EQA 250, and Hyundai Kona Electric, in a DC fast charging mode, using a buck converter to reduce the volt output to the voltage of the battery of electric car and applying P&O MPPT to it. The results obtained the efficiency and economy of the PV system with MPPT algorithm, to charge it in fast mode charge. The main contributions of this study can be categorized as follows:
• PV off-grid system to supply electric car as a fast-charging mode using Li-ion battery of electric car as a load without any addition of energy storage.
• Applying P&O MPPT to buck converter circuit to get the maximum energy from the PV system.
• Finally, testing the EV models to estimate the efficiency of the MPPT controller, time of charging, and characteristics of voltage and current levels under the conditions of variance irradiance level and temperature.
The rest of the article is organized as follows: Design and methodology for PV array, DC-DC buck converter, and Li-ion battery are introduced in detail in Section 2. Section 3 shows the efficiency of the MPPT controller, time of charging, and voltage and current characteristics for each model of these electric cars. Section 4 shows the concluding points and next guides for future work. Table 1 concluded the topics in EVs charging.

TABLE 1. A review of the literature based on the charging of electric vehicles.
This article proposes a PV system to charge EVs using a buck converter that uses the MPPT algorithm. PV modules are designed in system with 1500 V and different ranges of Li-ion battery. Figure 1 shows the main construction of the EVs charging station powered by the PV system. Table 2 illustrates the main specification of the utilized PV modules (Solar for Home, Utility, and Commercial, 2022) (Implement PV array modules Simulink, 2022).
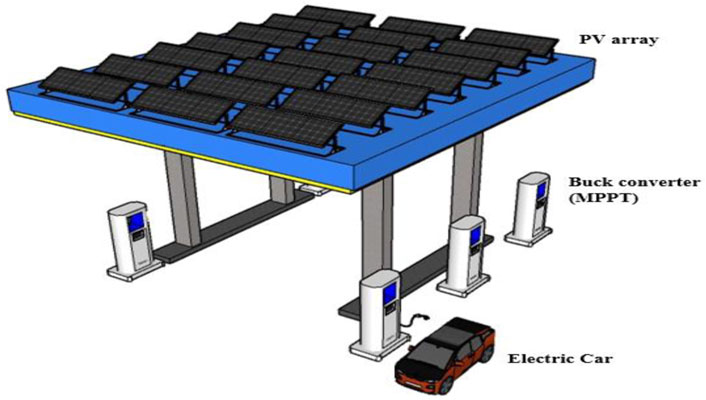
FIGURE 1. Main design of the EV charging station which is powered by the PV system.
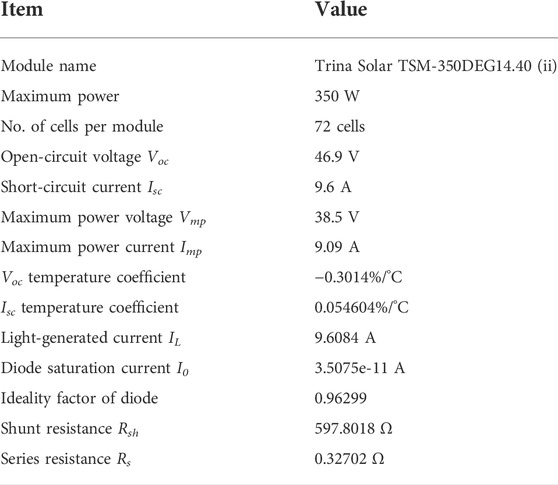
TABLE 2. PV module datasheet.
The PV array gives the power to buck converter. This converter reduces the voltage of PV string to system volt for each system as required. This buck converter used the MPPT concept to get the best power and energy from the PV array and then give it to load which is the electric vehicle battery proposed. Datasheet of Li-ion battery system for each model as follows (Compare electric vehicles EV Database, 2022; EV Specifications—Electric vehicle specifications, electric car news, EV comparisons). Table 3 shows the energy capacity for EVs models.
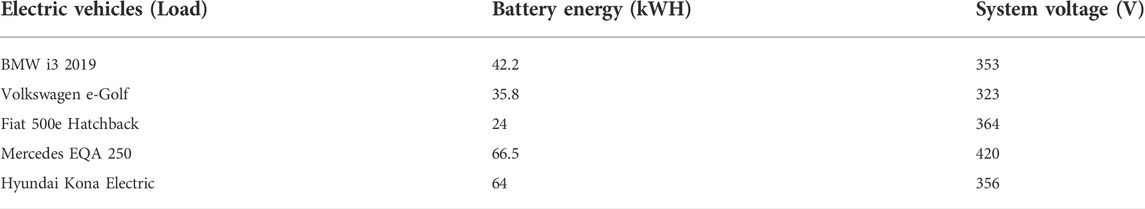
TABLE 3. Li-ion battery datasheets.
PV panels create direct current electricity using sunlight as a type of energy (Mohamed, 2022). Wafer-based crystalline silicon cells are used in the modules. This model proposes a PV array to feed the load (electric vehicles). PV array is defined as a collection of strings that are parallelly connected. Strings: some of the PV modules are connected in series. The standard circuit for the PV module is obtained in Figure 2. The mathematical model of PV cells group output current for one PV module is as follows (Kadeval and Patel, 2021):
where
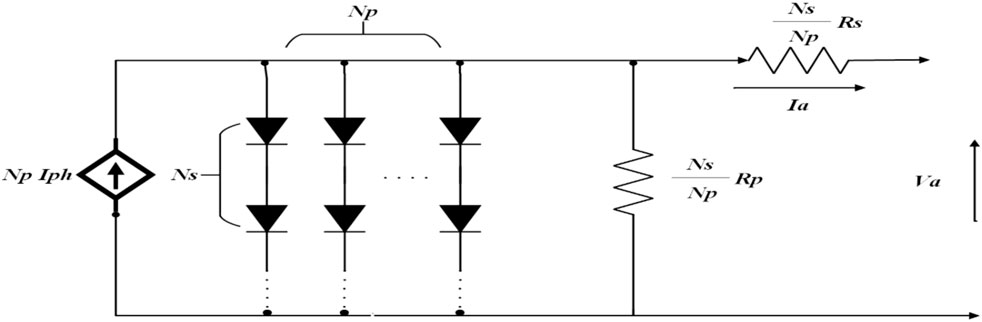
FIGURE 2. Equivalent circuit for solar cells.
The maximum current, maximum voltage, and maximum power of the PV group are all represented by
Figure 3 depicts the I-V and P-V properties of a PV array.
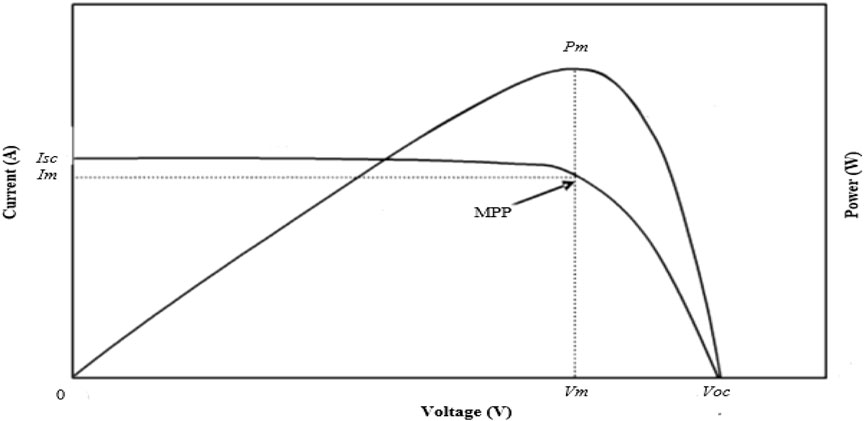
FIGURE 3. I-V and P-V properties of a PV array.
The DC–DC buck converter is a power electronics circuit that reduces the voltage of a greater dc input to a lower dc output voltage. It consists of a controlled switch (MOSFET), an inductor (L), a switch diode, and a capacitance (C). It is obtained in the following Figure 4. The capacitor and inductor are important in providing stable current to the EVs load. Filters consisting of capacitors with inductors are used to decrease the voltage ripple. The inductor is in charge of providing and suppressing ripples in the output current simultaneously. The capacitor is used to confirm a nonstop current stream throughout the EV load by steadying the voltage level across the EV load and letting ripple current permit through it. In sum, L and C is playing as A filter to output (PCB Design Resources and Information, 2022).
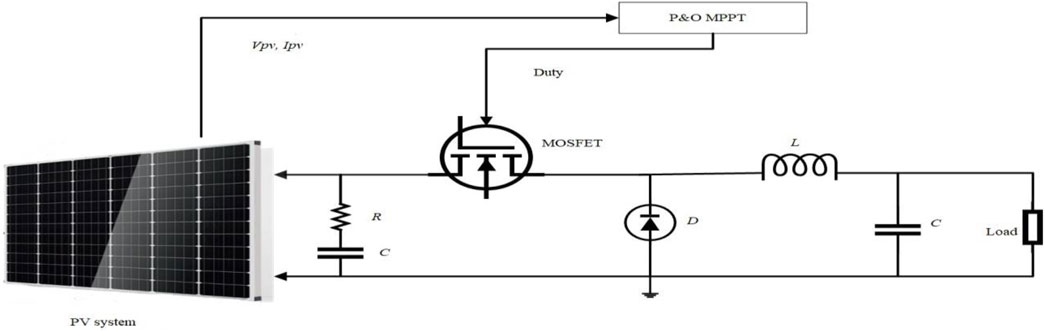
FIGURE 4. DC-DC buck converter diagram.
When the switch is turned on, it provides current to the load. Because energy is also stored in L, the current stream to the load is initially restricted. Nevertheless, the current in the load and the charge on C steadily increase over the “on” period. The energy contained in the magnetic field around L is placed back into the circuit when the transistor is turned off. The voltage through the L inductor (back e.m.f.) has reversed polarity from the voltage across L during the “on” phase. Furthermore, the crumpling magnetic field has sufficient stored energy to keep the current accessed for a minimum part of the time the transistor is open. Inductors back e.m.f. now causes the current to access the circuit through the load and forward bias diode. The charge held in C becomes the main source of current when the inductor has returned a large portion of its energy kept to the circuit. When the load voltage begins to fall, maintaining current accessing through the load till the next “on” date starts (Buck Converters, 2022).
Design inductor, capacitor, and load resistor of the DC-DC buck converter are as follows:
where D is the duty cycle.
where
where
Batteries are one of the most important ways to store electrical energy. This article proposed electric vehicle batteries as a load. This work, among the current rechargeable batteries, is relevant to EVs, li-ion batteries, which are presently recognized as the perfect solution for EVs. Lithium-ion batteries are superior in terms of energy effectiveness and power concentration (Chen et al., 2012). Li-ion battery has high volumetric (energy density) and specific energy densities, with lower diameters and lighter weight cells (Manufacturing That Eliminates Risk and Improves Reliability, 2022). The energy density of a battery is a function of its weight, whereas the volumetric density of energy is a function of its volume (Manufacturing That Eliminates Risk and Improves Reliability, 2022). Energy in battery proposes as WH, which in the next equation expressed the energy in any collection of batteries or one battery.
where V is the system volt of batteries. AH is the capacity of batteries. Figure 5 shows a comparison of energy densities of Lead Acid, Ni-Cd, Ni-MH, and Li-ion batteries.
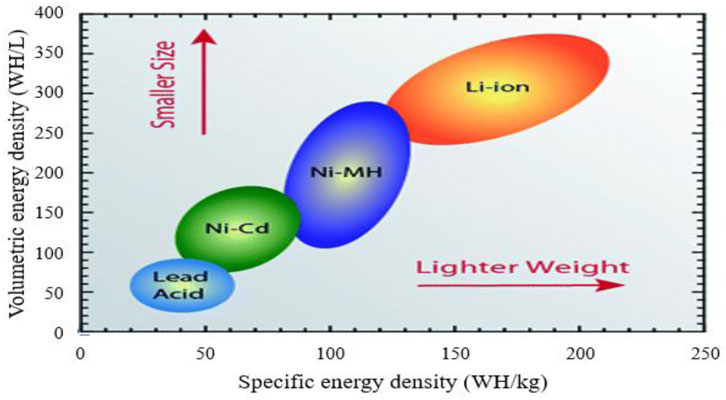
FIGURE 5. Energy densities in batteries.
To achieve the maximum output power, this approach uses Perturb & Observe (MPPT) (Mousa et al., 2016). Figure 6 depicts the output power curve of a PV module as a purpose of (P-V) with the constant irradiance and constant cell temperature, considering that the PV module is working away from the MPPT (Selmi et al., 2014; Killi and Samanta, 2015).
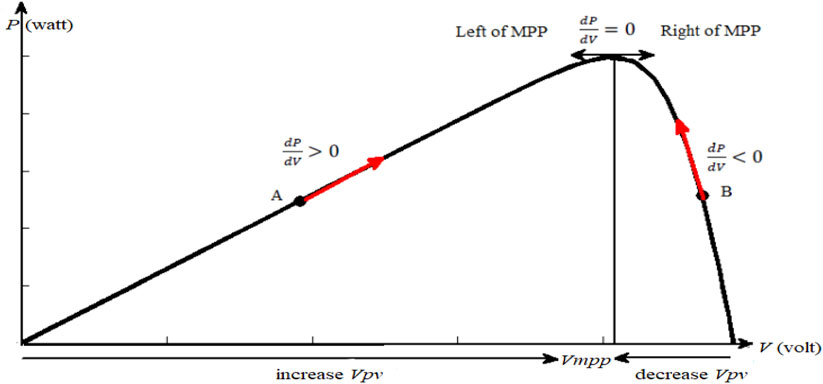
FIGURE 6. P&O on the P-V curve.
The operational voltage of the PV module is disrupted by a modest increase in this procedure, and the consequent change in power, P, is measured. If P is positive, the operating point is thought to have moved closer to the MPP. As a result of more voltage perturbations in a similar path, the operating point should be the closest to the MPP. If P is negative, the operating point deviates from MPP, and the perturbation way should be reversed to bring it back to MPP (Oi, 2005; Selmi et al., 2014; Killi and Samanta, 2015).
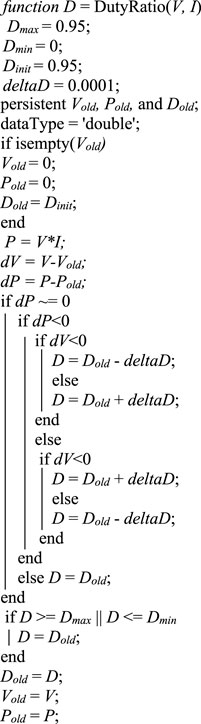
The P&O approach is used to extract most power possible from solar energy, although it has a slower dynamic response than fuzzy logic control (FLC). Therefore, to gain a successful steady-state inaccuracy, we employed lower increments (Saibabu and Kumari, 2011). Figure 7 shows the block diagram of the PV system with P&O MPPT. Figure 8 shows the flowchart of the P&O algorithm.

FIGURE 7. Block diagram of the PV system with P&O MPPT.
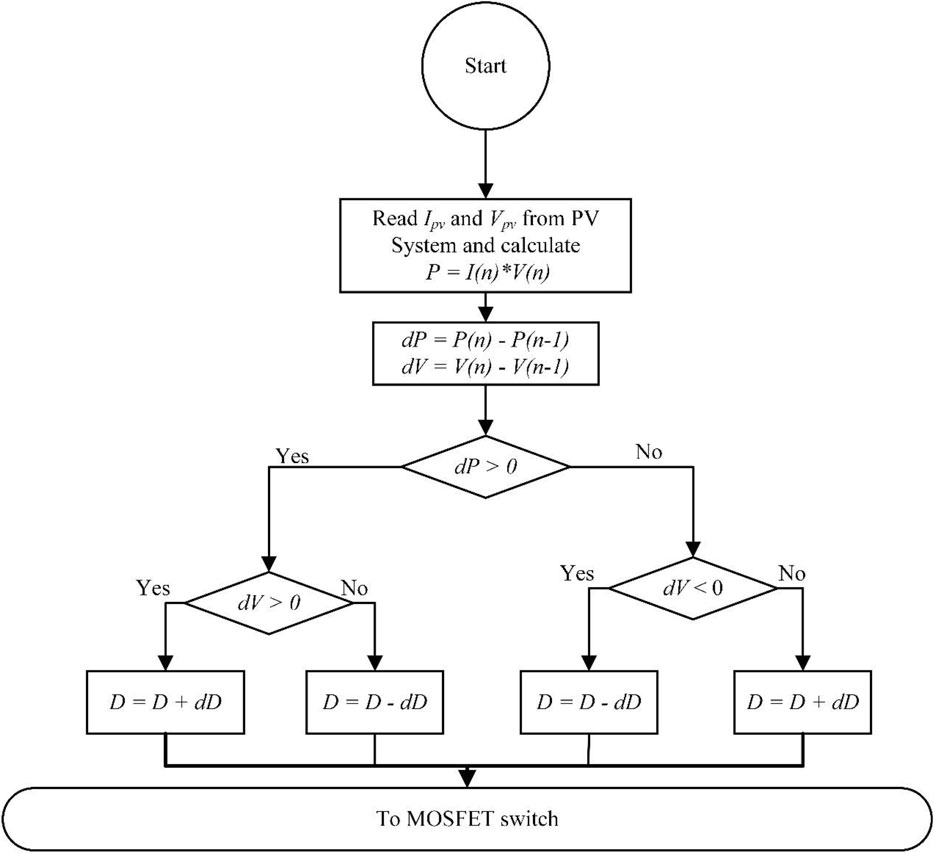
FIGURE 8. Flowchart of P&O algorithm.
MATLAB Simulink was used to determine the properties of the buck converter circuit that had been designed. The PV system simulation model in MATLAB, which applied P&O MPPT controller in it, is shown Figure 8. The temperature is kept at 25°C and the irradiance is kept at 1,000 W/m2. This article simulated the power of an input and output MPPT controller and its efficiency, time of charging, and characteristics of voltage and current levels for each model of these electric vehicles. All models were tested under the condition of variance irradiance level and variance temperature. The electric vehicle loads are BMW i3 2019, Volkswagen e-Golf, and Fiat 500e. The data of electric vehicles are according to the database of it (Compare electric vehicles EV Database, 2022; EVSpecifications - Electric vehicle specifications, 2022). The characteristics of these five models are shown in Table 4. Figure 9 Shows the PV system with EVs models in MATLAB simulation.
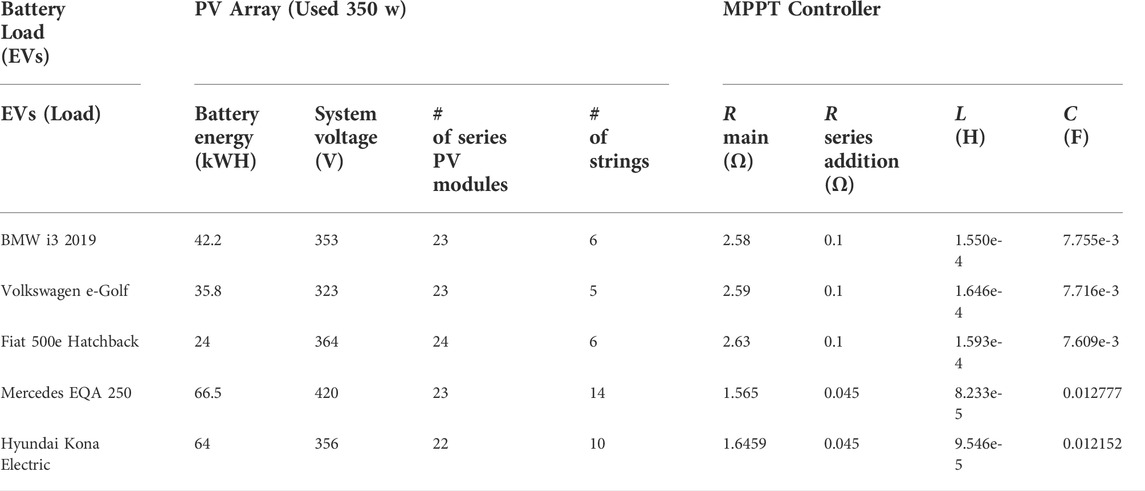
TABLE 4. Main parameters of MATLAB model.
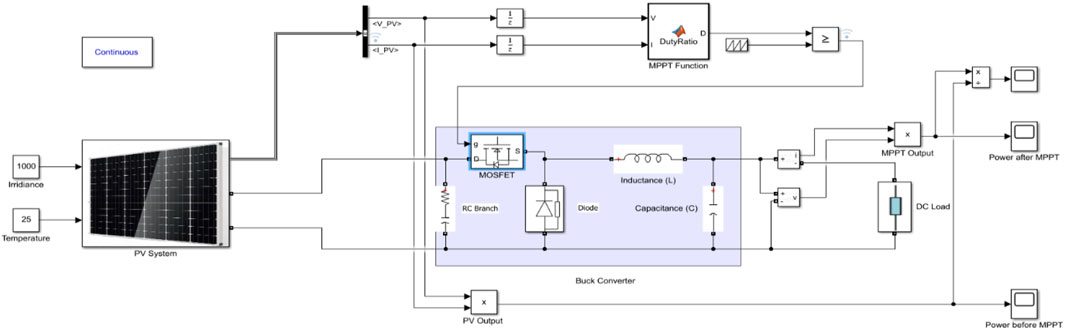
FIGURE 9. PV system simulation model in MATLAB with MPPT controller.
A MATLAB platform is employed to obtain and calculate MPPT efficiency according to the input and output power for each system. All the EV models are tested under variance irradiance which changed from 600 W/m2 to 1,000 W/m2 also, and the variance temperature is changed from 20°C to 30°C.
First, the simulation results obtained of an MPPT controller’s efficiency for BMW i3 2019 at a constant temperature of 25°C are 97.06%, 97.18%, and 97.22% at 1,000, 800, and 600 W/m2, respectively. Second, the simulation results obtained at a constant irradiance of 1,000 W/m2 are 97.07%, 97.06 %, and 97.05% at 30, 25, and 20°C, respectively.
Table 5 illustrates the results of the MPPT controller for BMW i3 2019 at variable irradiance-constant temperature and constant irradiance-variable temperature.
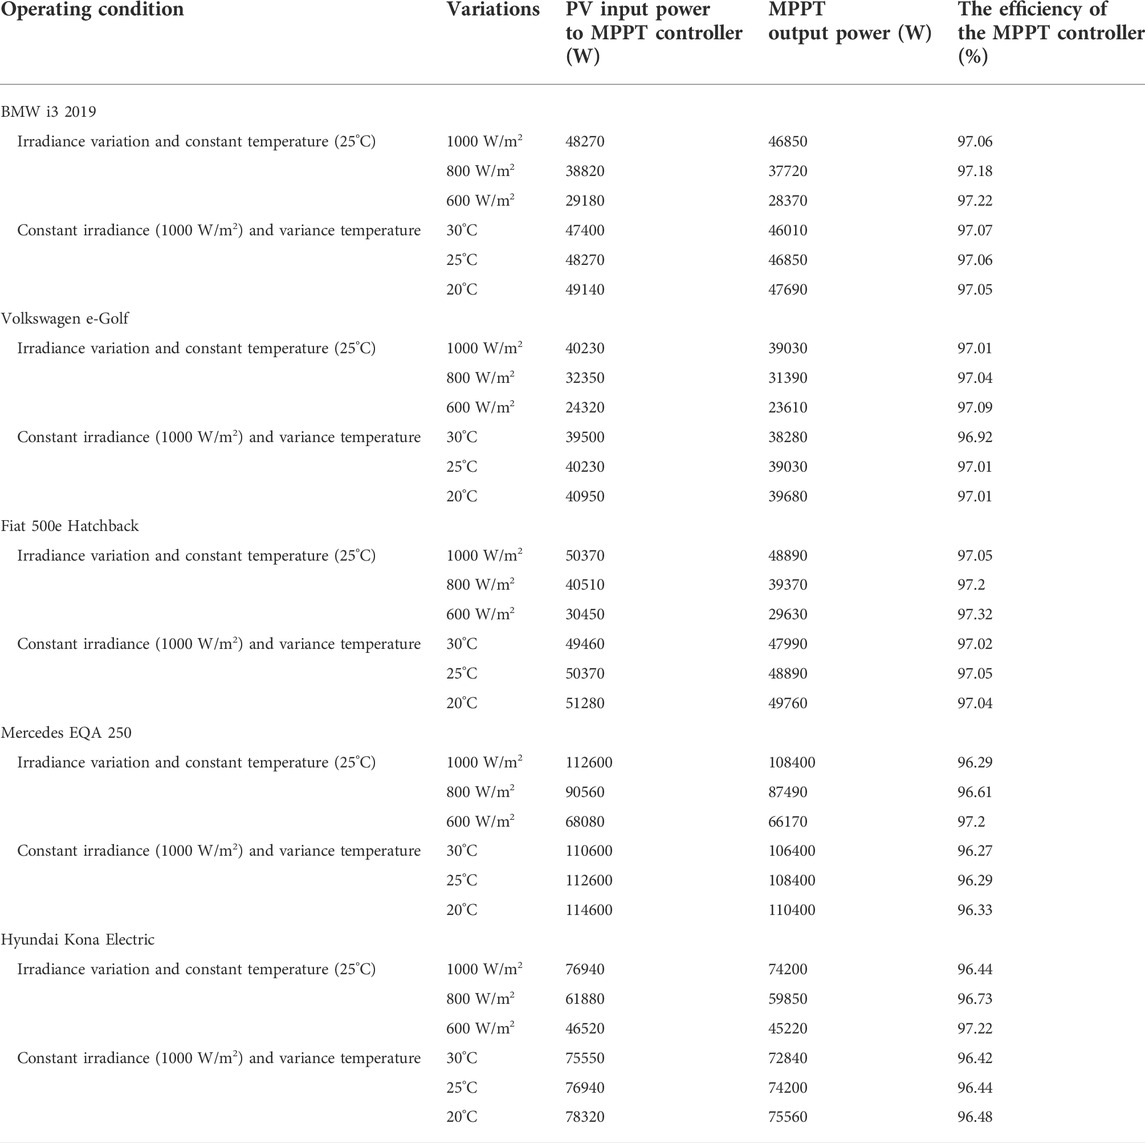
TABLE 5. Input, output power, and efficiency for MPPT controller for utilized EV models.
Figure 10 displays the results of the MPPT controller for BMW i3 2019 at two operating conditions of variable irradiance-constant temperature and constant irradiance-variable temperature.

FIGURE 10. Simulation results of the MPPT controller for BMW i3 2019. (A) PV input power to MPPT controller at variable irradiance and constant temperature. (B) PV input power to MPPT controller at constant irradiance and variable temperature. (C) MPPT controller output power at variable irradiance and constant temperature. (D) MPPT controller output power at constant irradiance and variable temperature. (E) Efficiency of the MPPT controller at variable irradiance and constant temperature. (F) Efficiency of the MPPT controller at constant irradiance and variable temperature.
First, the simulation results obtained of an MPPT controller’s efficiency for Volkswagen e-Golf at a constant temperature of 25°C are 97.01%, 97.04%, and 97.09% at 1,000, 800, and 600 W/m2, respectively. Second, the simulation results obtained at constant irradiance of 1,000 W/m2 are 96.92%, 97.01 %, and 97.01% at 30, 25, and 20°C, respectively.
Table 5 illustrates the results of the MPPT controller for Volkswagen e-Golf at variable irradiance-constant temperature and constant irradiance-variable temperature.
Figure 11 displays the results of the MPPT controller for Volkswagen e-Golf at two operating conditions of variable irradiance-constant temperature and constant irradiance-variable temperature.

FIGURE 11. Simulation results of the MPPT controller for Volkswagen e-Golf. (A) PV input power to MPPT controller at variable irradiance and constant temperature. (B) PV input power to MPPT controller at constant irradiance and variable temperature. (C) MPPT controller output power at variable irradiance and constant temperature. (D) MPPT controller output power at constant irradiance and variable temperature. (E) Efficiency of the MPPT controller at variable irradiance and constant temperature. (F) Efficiency of the MPPT controller at constant irradiance and variable temperature.
First, the simulation results obtained of an MPPT controller’s efficiency for Fiat 500e Hatchback at a constant temperature of 25°C are 97.05%, 97.2%, and 97.32% at 1,000, 800, and 600 W/m2, respectively. Second, the simulation results obtained at constant irradiance of 1,000 W/m2 are 97.02%, 97.05 %, and 97.04% at 30, 25, and 20°C, respectively. Table 5 illustrates the results of the MPPT controller for Fiat 500e Hatchback at variable irradiance-constant temperature and constant irradiance-variable temperature.
Figure 12 displays the results of the MPPT controller for Fiat 500e Hatchback at two operating conditions of variable irradiance-constant temperature and constant irradiance-variable temperature.
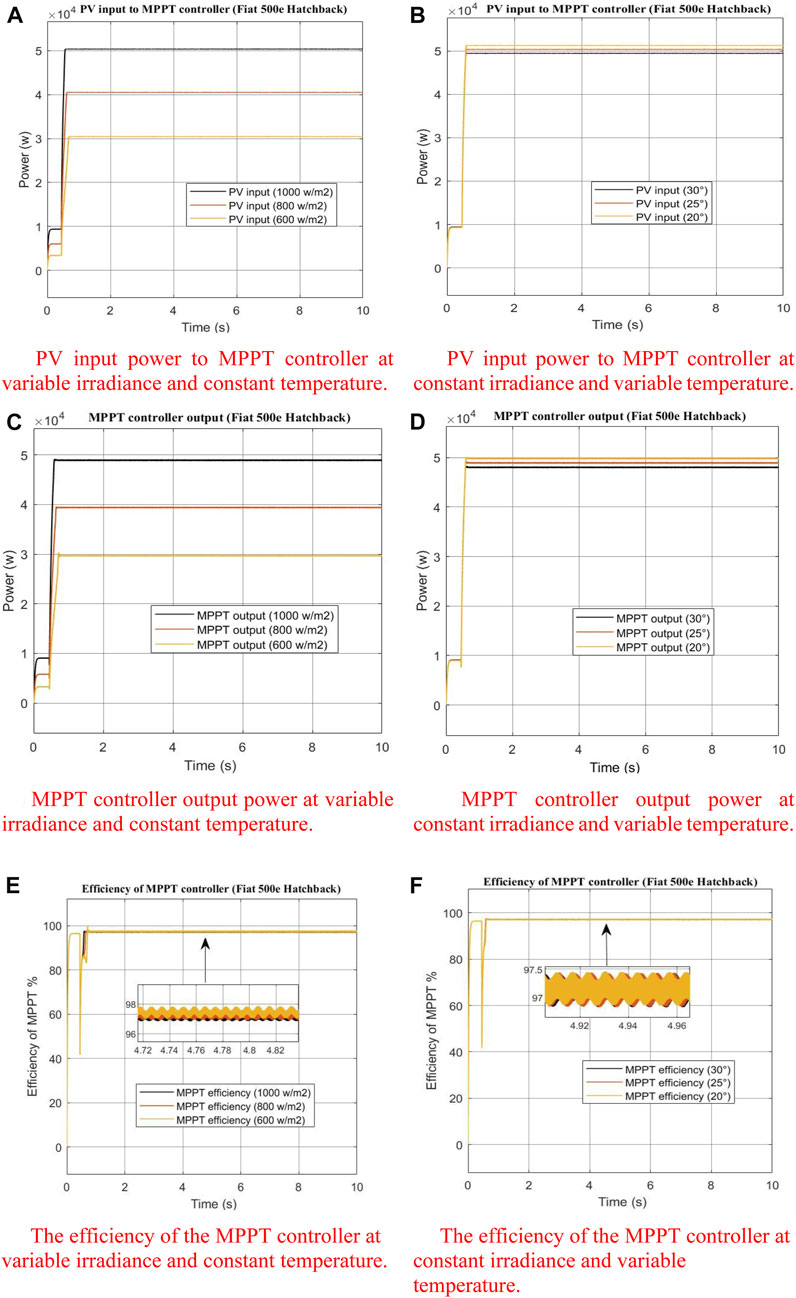
FIGURE 12. Simulation results of the MPPT controller for Fiat 500e Hatchback. (A) PV input power to MPPT controller at variable irradiance and constant temperature. (B) PV input power to MPPT controller at constant irradiance and variable temperature. (C) MPPT controller output power at variable irradiance and constant temperature. (D) MPPT controller output power at constant irradiance and variable temperature. (E) Efficiency of the MPPT controller at variable irradiance and constant temperature. (F) Efficiency of the MPPT controller at constant irradiance and variable temperature.
First, the simulation results obtained of an MPPT controller’s efficiency for Mercedes EQA 250 at a constant temperature of 25°C are 96.29%, 96.61%, and 97.2% at 1,000, 800, and 600 W/m2, respectively. Second, the simulation results obtained at constant irradiance of 1,000 W/m2 are 96.27%, 96.29%, and 96.33% at 30, 25, and 20°C, respectively. Table 5 illustrates the results of the MPPT controller for Mercedes EQA 250 at variable irradiance-constant temperature and constant irradiance-variable temperature.
Figure 13 displays the results of the MPPT controller for Mercedes EQA 250 at two operating conditions of variable irradiance-constant temperature and constant irradiance-variable temperature.
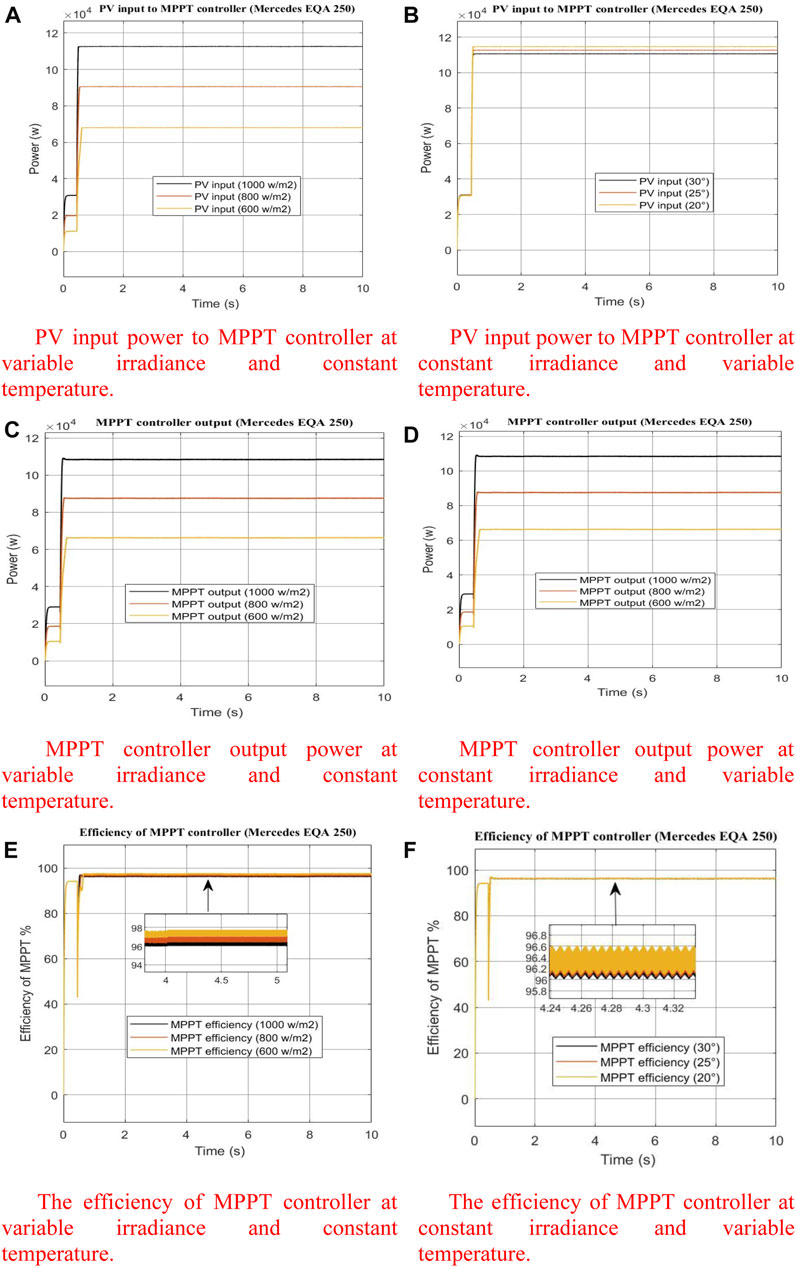
FIGURE 13. Simulation results of the MPPT controller for Mercedes EQA 250. (A) PV input power to MPPT controller at variable irradiance and constant temperature. (B) PV input power to MPPT controller at constant irradiance and variable temperature. (C) MPPT controller output power at variable irradiance and constant temperature. (D) MPPT controller output power at constant irradiance and variable temperature. (E) Efficiency of the MPPT controller at variable irradiance and constant temperature. (F) Efficiency of the MPPT controller at constant irradiance and variable temperature.
First, the simulation results obtained of an MPPT controller’s efficiency for Hyundai Kona Electric at a constant temperature of 25°C are 96.44%, 96.73%, and 97.22% at 1000, 800, and 600 W/m2, respectively. Second, the simulation results obtained at constant irradiance of 1,000 W/m2 are 96.42%, 96.44%, and 96.48% at 30, 25, and 20°C, respectively. Table 5 illustrates the results of the MPPT controller for Hyundai Kona Electric at variable irradiance-constant temperature and constant irradiance-variable temperature.
Figure 14 displays the results of the MPPT controller for Hyundai Kona Electric at two operating conditions of variable irradiance-constant temperature and constant irradiance-variable temperature.
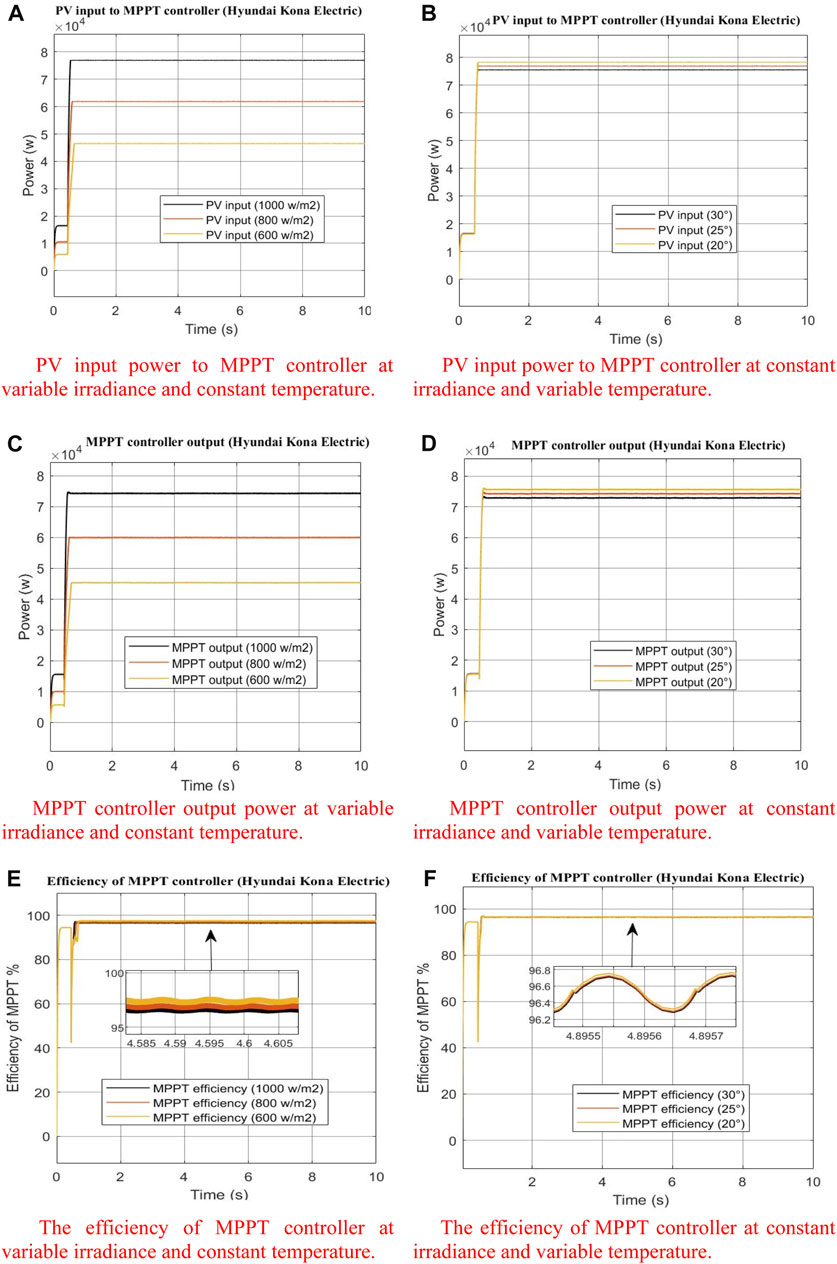
FIGURE 14. Simulation results of the MPPT controller for Mercedes EQA 250. (A) PV input power to MPPT controller at variable irradiance and constant temperature. (B) PV input power to MPPT controller at constant irradiance and variable temperature. (C) MPPT controller output power at variable irradiance and constant temperature. (D) MPPT controller output power at constant irradiance and variable temperature. (E) Efficiency of the MPPT controller at variable irradiance and constant temperature. (F) Efficiency of the MPPT controller at constant irradiance and variable temperature.
The PV output power from the P&O MPPT controller is near the PV array specifications’ maximum available power. At the constant temperature of 25°C and the variable irradiance from 600 to 1000 W/m2, the higher power is at 1000 W/m2. Also, at the constant irradiance of 1,000 W/m2 and a variable temperature from 20°C to 30°C, the maximum power is at the lower temperature.
It is clear to us from the results of the simulation program that the application of the MPPT method to the solar system achieves a high efficiency for charging electric cars, as the results for any system were not less than 96%.
The models also tested the time charge for each EV and started SOC from 20%. For EVs, the ideal SOC area ranges from 20 to 80% (Kostopoulos et al., 2020). The model calculates the time charge from 20 to 80% of SOC. Under constant irradiance is 1000 W/m2 and the constant temperature is 25°C. The model MATLAB used to measure time charging is obtained in Figure 15.
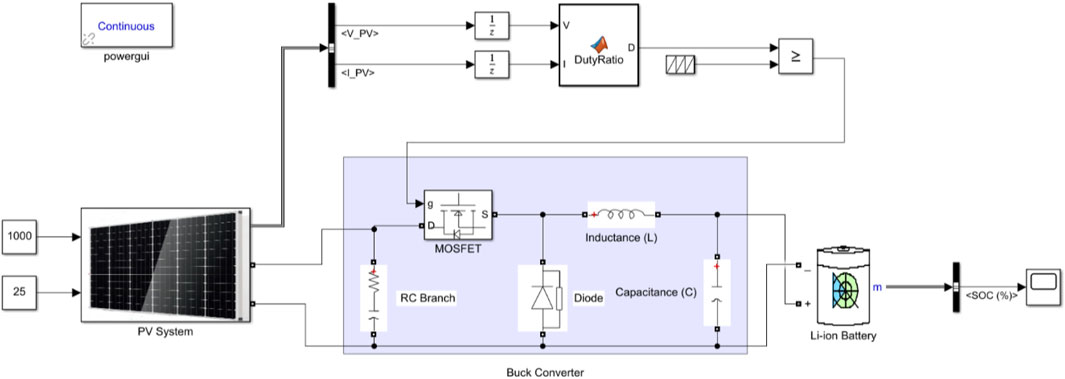
FIGURE 15. MATLAB model to measure time charging.
The simulation results for BMW i3 2019, the time to charge it from 20 to 80% SOC is 35–36 min, and the reference time to charge BMW i3 2019 from 10 to 80% SOC is 36 min according to EVs database (Compare electric vehicles EV Database, 2022). Under constant irradiance is 1000 w/
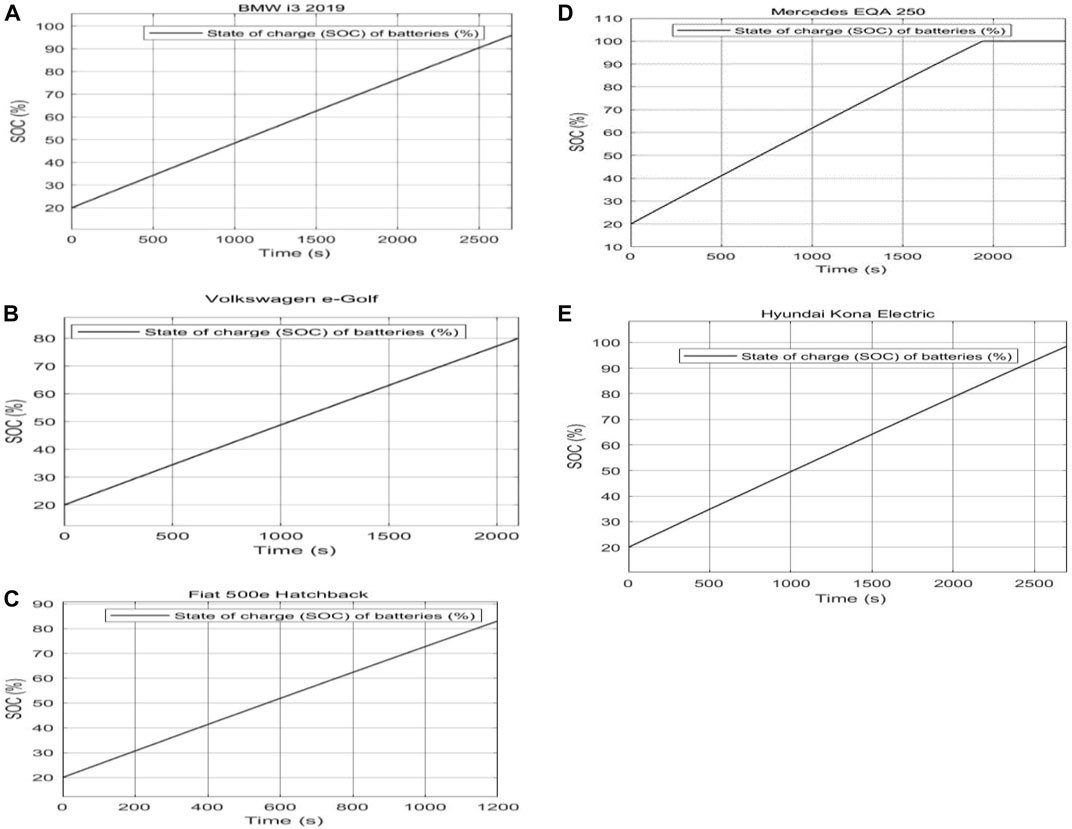
FIGURE 16. (A) Time charging for BMW i3 2019. (B) Time charging for Volkswagen e-Golf. (C) Time charging for Fiat 500e Hatchback. (D) Time charging for Mercedes EQA 250. (E) Time charging for Hyundai Kona Electric.
The simulation results for Volkswagen e-Golf, the time to charge it from 20 to 80% SOC is 35 min, and the reference time to charge Volkswagen e-Golf from 10 to 80% SOC is 36 min according to EVs database (Compare electric vehicles EV Database, 2022). Under constant irradiance is 1000 W/m2, the constant temperature is 25°C, and the PV input power is 40230 W, which is obtained in Figure 16B.
The simulation results for Fiat 500e Hatchback, the time to charge it from 20 to 80% SOC is 19–20 min, and the reference time to charge Fiat 500e Hatchback from 10 to 80% SOC is 24 min according to EVs database (Compare electric vehicles EV Database, 2022). Under constant irradiance is 1000 W/m2, the constant temperature is 25°C, and the PV input power is 50370 W, which is obtained in Figure 16C.
The simulation results for Mercedes EQA 250, the time to charge it from 20 to 80% SOC is 24–25 min, and the reference time to charge Mercedes EQA 250 from 10 to 80% SOC is 29 min according to the electric vehicles database (Compare electric vehicles EV Database, 2022). Under constant irradiance is 1000 W/m2, constant temperature is 25°C, and PV input power is 112600 W, which is obtained in Figure 16D.
For Hyundai Kona Electric, the time to charge it from 20 to 80% SOC is 33–34 min, and the reference time to charge Hyundai Kona Electric from 10 to 80% SOC is 44 min according to EVs database (Compare electric vehicles EV Database, 2022). Under constant irradiance is 1000 W/m2, the constant temperature is 25°C, and the PV input power is 76940 W, which is obtained in Figure 16E.
Table 6 summarizes the results of the charging time for each model of electric car from 20 to 80 percent of the state of charge and comparing it with the charging time from 10 to 80% of SOC according to electric vehicles database (Compare electric vehicles—EV Database, 2022). Using MATLAB software to calculate time charging powered by a PV system with constant irradiance which equals 1000 W/m2 and constant temperature which equals 25°C.
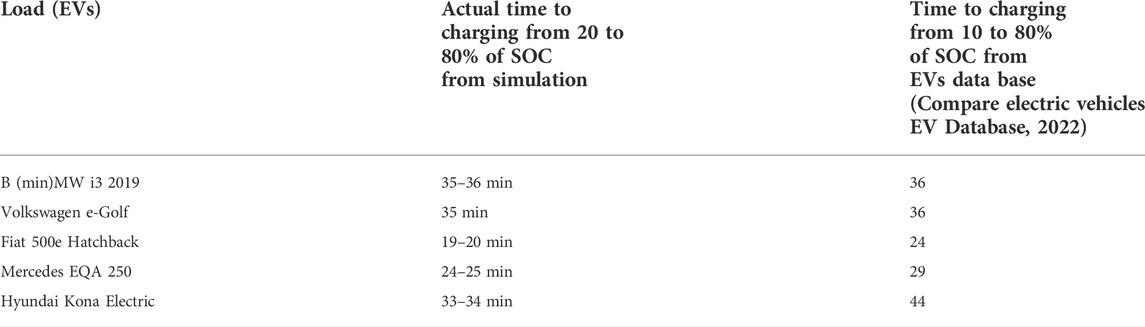
TABLE 6. Results of time charging for each model of Electric Vehicles.
It is obtained from the results of the charging period that how efficient and fast the PV stand-alone system with MPPT algorithm was in achieving fast charging for electric cars that are seriously economical and effective, as it relied on the electric car battery as a load and did not charge external batteries, which ensures better efficiency and fewer energy losses.
For the simulation results for BMW i3 2019, the voltage level is 380 V, and the current level is 120 A. SOC is 45% and for 100 s with constant irradiance is 1000 W/m2, the constant temperature is 25°C, and the PV input power is 48270 W, which is obtained in Figure 17. For the simulation results for Volkswagen e-Golf, the voltage level is 354 V, and the current level is 110 A. SOC is 45% and for 100 s with constant irradiance is 1000 W/m2. The constant temperature is 25°C and the PV input power is 40230 W, which is obtained in Figure 17. For the simulation results for Fiat 500e Hatchback, the voltage level is 407 V, and the current level is 127 A. SOC is 45% and for 100 s with constant irradiance is 1000 W/m2, the constant temperature is 25°C, and the PV input power is 50370 W, which is obtained in Figure 17. For the simulation results for Mercedes EQA 250, the voltage level is 466 V, and the current level is 240 A. SOC is 45% and for 100 s with constant irradiance is 1000 W/m2 and the constant temperature is 25°C, and the PV input power is 112600 W, which is obtained in Figure 17. For the simulation results for Hyundai Kona Electric, the voltage level is 391 V, and the current level is 190 A. SOC is 45% and for 100 s with constant irradiance is 1000 W/m2, constant temperature is 25°C, and the PV input power is 76940 W, which is obtained in Figure 17.
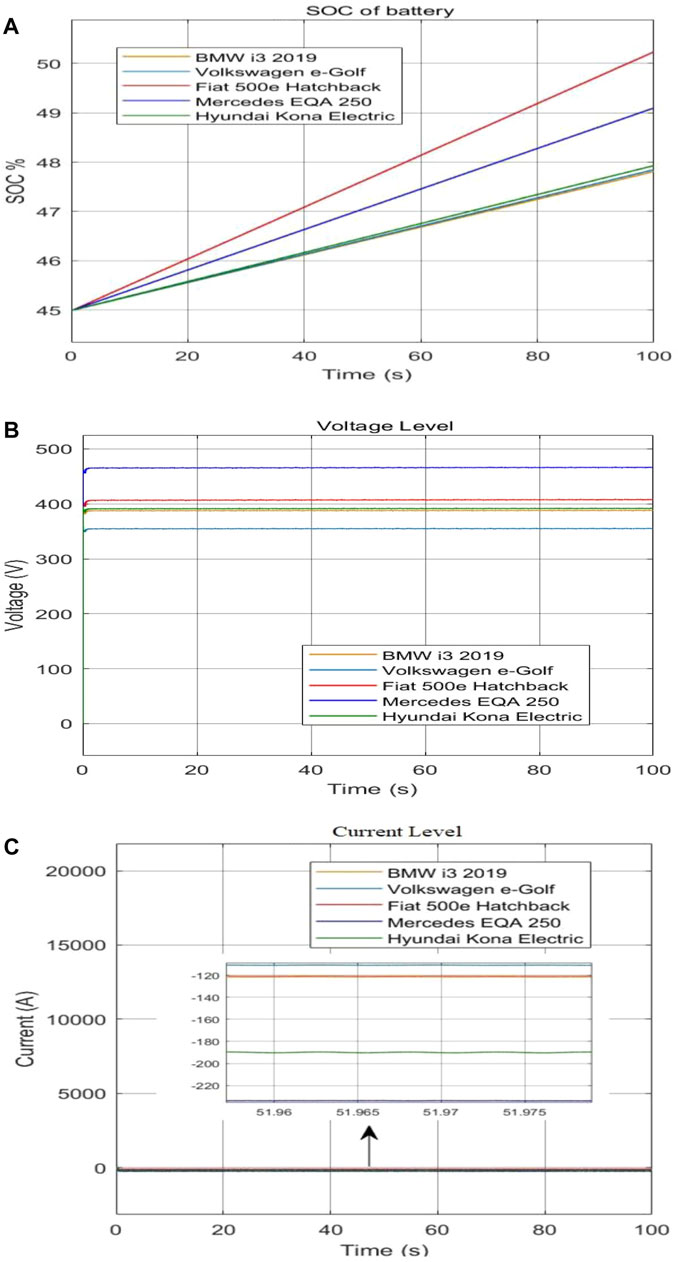
FIGURE 17. Charging for EV models. (A) SOC from 45% for 100 s, (B) voltage level, (C) current level.
This study concludes that EVs can be charged in a rapid charging mode using solar energy as a stand-alone system with P&O MPPT to maximize solar panel efficiency. This system used EVs as a load to minimize cost in addition to using a PV off-grid system to avoid the issue of disconnecting power when the grid is out of service when using a PV on-grid system. By applying this model to five different types of electric automobiles (BMW i3 2019, Volkswagen e-Golf, Fiat 500e, Mercedes EQA 250, and Hyundai Kona Electric), the results obtained that the P&O MPPT method is used to maximize the PV array’s output power and can successfully run the system at a level extremely near the PV array’s maximum available power. This simulation was done using a variance irradiance from 600 W/m2 to 1000 W/m2 and temperature between 20°C and 30°C and applied in MATLAB software. From the outcomes, the time of the charge for five types of electric vehicles is near its range according to the electric vehicles database.
The future work will focus on charging electric vehicles by using a hybrid system like PV systems, wind turbines, and fuel cell (FC) technology to ensure that charging is always available. To address the problem of the changing intensity of the sun for the solar system and the erratic wind speed for wind stations, in addition to the use of hydrogen technology as an energy storage method, it is expected to be efficient and economically feasible.
Furthermore, how to enhance the efficiency of PV modules to create more power in the same size is already accessible. In addition, how to adapt battery manufacturing to become more energy-dense to gain more energy in the same size. In addition, studying grid integration when a system is converted to connection with a grid system is expected to see some errors and effects when the system is linked to the grid. In addition, making the comparison of results if using FLC or an adaptive fuzzy logic controller (AFLC). To compensate P&O MPPT in MPPT efficiency and time charging of EVs. Finally, analyze the integration of V2G with the network, which places that will be economic and optimal options, and analysis charging it with renewable energy resources.
The original contributions presented in the study are included in the article/Supplementary Material. Further inquiries can be directed to the corresponding author.
All authors listed have made a substantial, direct, and intellectual contribution to the work and approved it for publication.
The authors declare that the research was conducted in the absence of any commercial or financial relationships that could be construed as a potential conflict of interest.
All claims expressed in this article are solely those of the authors and do not necessarily represent those of their affiliated organizations, or those of the publisher, the editors, and the reviewers. Any product that may be evaluated in this article, or claim that may be made by its manufacturer, is not guaranteed or endorsed by the publisher.
Al-Gabalawy, M., Elmetwaly, A. H., Younis, R. A., and Omar, A. I. (2022). Temperature prediction for electric vehicles of permanent magnet synchronous motor using robust machine learning tools. J. Ambient. Intell. Humaniz. Comput. doi:10.1007/S12652-022-03888-9
Buck Converters (2022). Learnabout electronics. Available at: https://learnabout-electronics.org/PSU/psu31.php (Accessed May 6, 2022).
Chandra Mouli, G. R., Schijffelen, J., Van Den Heuvel, M., Kardolus, M., and Bauer, P. (2019). A 10 kW solar-powered bidirectional EV charger compatible with chademo and COMBO. IEEE Trans. Power Electron. 34, 1082–1098. doi:10.1109/TPEL.2018.2829211
Chen, X., Shen, W., Vo, T. T., Cao, Z., and Kapoor, A. (2012). “An overview of lithium-ion batteries for electric vehicles,” in 2012 10th International Power and Energy Conference IPEC, Ho Chi Minh City, Vietnam, 12-14 December 2012 (IEEE), 230–235. doi:10.1109/ASSCC.2012.6523269
Chen, X., Zhang, H., Xu, Z., Nielsen, C. P., McElroy, M. B., Lv, J., et al. (2018). Impacts of fleet types and charging modes for electric vehicles on emissions under different penetrations of wind power. Nat. Energy 3, 413–421. doi:10.1038/s41560-018-0133-0
Compare electric vehicles EV Database (2022). Electric vehicle database. Available at: https://ev-database.org/(Accessed April 3, 2022).
EVSpecifications Electric vehicle specifications (2022). Electric car news, EV comparisons. Available at: https://www.evspecifications.com/(Accessed April 3, 2022).
Ghotge, R., van Wijk, A., and Lukszo, Z. (2021). Off-grid solar charging of electric vehicles at long-term parking locations. Energy 227, 120356. doi:10.1016/j.energy.2021.120356
Gong, X., Dong, F., Mohamed, M. A., Abdalla, O. M., and Ali, Z. M. (2020). A secured energy management architecture for smart hybrid microgrids considering PEM-Fuel cell and electric vehicles. IEEE Access 8, 47807–47823. doi:10.1109/ACCESS.2020.2978789
Grande, L. S. A., Yahyaoui, I., and Gómez, S. A. (2018). Energetic, economic and environmental viability of off-grid PV-BESS for charging electric vehicles: Case study of Spain. Sustain. Cities Soc. 37, 519–529. doi:10.1016/j.scs.2017.12.009
Iec, W., Ustun, T. S., Member, S., Ozansoy, C. R., and Zayegh, A. (2012). “Implementing vehicle-to-grid ( V2G ) technology with IEC 61850-7-420,” in IEEE Transactions on Smart Grid (IEEE), 1–8. doi:10.1109/TSG.2012.2227515
Implement PV array modules Simulink (2022). MathWorks. Available at: https://www.mathworks.com/help/physmod/sps/powersys/ref/pvarray.html (Accessed May 6, 2022).
Ismael, S. M., Aleem, S. H. E. A., Abdelaziz, A. Y., and Zobaa, A. F. (2019). Probabilistic hosting capacity enhancement in non-sinusoidal power distribution systems using a hybrid PSOGSA optimization algorithm. Energies (Basel) 12, 1018. doi:10.3390/en12061018
Kadeval, H. N., and Patel, V. K. (2021). Mathematical modelling for solar cell, panel and array for photovoltaic system. J. Appl. Nat. Sci. 13, 937–943. doi:10.31018/jans.v13i3.2529
Karfopoulos, E. L., Panourgias, K. A., and Hatziargyriou, N. D. (2016). Distributed coordination of electric vehicles providing V2G regulation services. IEEE Trans. Power Syst. 31, 2834–2846. doi:10.1109/TPWRS.2015.2472957
Killi, M., and Samanta, S. (2015). Modified perturb and observe MPPT algorithm for drift avoidance in photovoltaic systems. IEEE Trans. Ind. Electron. 62, 5549–5559. doi:10.1109/TIE.2015.2407854
Kostopoulos, E. D., Spyropoulos, G. C., and Kaldellis, J. K. (2020). Real-world study for the optimal charging of electric vehicles. Energy Rep. 6, 418–426. doi:10.1016/j.egyr.2019.12.008
Mahfouz, M. M., and Iravani, M. R. (2019). Grid-integration of battery-enabled DC fast charging station for electric vehicles. IEEE Trans. Energy Convers. 35, 375–385. doi:10.1109/TEC.2019.2945293
Manufacturing That Eliminates Risk and Improves Reliability Epec (2022). Epec engineered technologies. Available at: https://www.epectec.com/(Accessed April 6, 2022).
Mishra, S., Dwivedi, G., Upadhyay, S., and Chauhan, A. (2021). Modelling of standalone solar photovoltaic based electric bike charging. Mater. Today Proc. 49, 473–480. doi:10.1016/j.matpr.2021.02.738
Modarresi Ghazvini, A., and Olamaei, J. (2019). Optimal sizing of autonomous hybrid PV system with considerations for V2G parking lot as controllable load based on a heuristic optimization algorithm. Sol. Energy 184, 30–39. doi:10.1016/j.solener.2019.03.087
Mohamed, M. A. (2022). A relaxed consensus plus innovation based effective negotiation approach for energy cooperation between smart grid and microgrid. Energy 252, 123996. doi:10.1016/J.ENERGY.2022.123996
Mohamed, M. A., Chabok, H., Awwad, E. M., El-Sherbeeny, A. M., Elmeligy, M. A., Ali, Z. M., et al. (2020). Stochastic and distributed scheduling of shipboard power systems using MθFOA-ADMM. Energy 206, 118041. doi:10.1016/j.energy.2020.118041
Mohamed, M. A., and Mohamed, F. A. (2020). Design and simulate an off-grid PV system with a battery bank for EV charging. ujeee. 7, 273–288. doi:10.13189/ujeee.2020.070502
Mohammed, S. S., Ahamed, T. P. I., Aleem, S. H. E. A., and Omar, A. I. (2021). Interruptible charge scheduling of plug-in electric vehicle to minimize charging cost using heuristic algorithm. Electr. Eng. 104, 1425–1440. doi:10.1007/S00202-021-01398-Z
Mohammed, S. S., and Devaraj, D. (2014). “System with boost converter using,” in International Conference on Circuit, Power and Computing Technologies [ICCPCT], 814–821. doi:10.1109/ICCPCT.2014.7054991
Mousa, A. G. E., Abdel Aleem, S. H. E., and Ibrahim, A. M. (2016). Mathematical analysis of maximum power points and currents based maximum power point tracking in solar photovoltaic system: A solar powered water pump application. Int. Rev. Electr. Eng. 11, 97. doi:10.15866/IREE.V11I1.8137
National Electrical Code Committee, and National Fire Protection Association (2020). NFPA 70: National Electrical Code. NFPA. MA, United States: McGraw Hill’s.
Oi, A. (2005). Design and simulation of photo-voltaic water pumping system for irrigation. Adv. Appl. Sci. 4, 51–63. doi:10.11648/j.aas.20190402.14
Omar, A. I., Sharaf, A. M., Shady, A., Mohamed, A. A., and Essam, E. Z. (2019). “Optimal switched compensator for vehicle-to-grid battery chargers using salp optimization,” in 2019 21st International Middle East Power Systems Conference, MEPCON 2019 - Proceedings, Cairo, Egypt, 17-19 December 2019 (IEEE), 139–144. doi:10.1109/MEPCON47431.2019.9008229
Parsons, G. R., Hidrue, M. K., Kempton, W., and Gardner, M. P. (2014). Willingness to pay for vehicle-to-grid (V2G) electric vehicles and their contract terms. Energy Econ. 42, 313–324. doi:10.1016/j.eneco.2013.12.018
PCB Design Resources and Information (2022). Altium. Available at: https://resources.altium.com/(Accessed April 10, 2022).
Prem, P., Sivaraman, P., Sakthi Suriya Raj, J. S., Jagabar Sathik, M., and Almakhles, D. (2020). Fast charging converter and control algorithm for solar PV battery and electrical grid integrated electric vehicle charging station. Automatika 61, 614–625. doi:10.1080/00051144.2020.1810506
Putri, R. I., Rifa’i, M., and Adhisuwignjo, S. (2021). “Design of buck converter for photovoltaic system Applications,” in Applied Electromagnetic Technology (AEMT), 11 - 15 April (Lombok: AEMT), 51–54.
Sahoo, J. K., and Mathew, A. T. (2017). “Design of a ZCS full - bridge DC - DC converter for PV based electric vehicle fast charging station,” in TENSYMP 2017 - IEEE International Symposium on Technologies for Smart Cities, Cochin, India, 14-16 July 2017 (IEEE), 1–5. doi:10.1109/TENCONSpring.2017.8070079
Saibabu, T., and Kumari, J. (2011). Modeling and simulation of PV array and its performance enhancement using MPPT (P&O) technique. Ijcscn. Com. 1, 9–16. Available at: http://www.ijcscn.com/Documents/Volumes/vol1issue1/ijcscn2011010103.pdf.
Selmi, T., Abdul-Niby, M., Devis, L., and Davis, A. (2014). “P & O MPPT implementation using MATLAB/Simulink,” in 2014 Ninth International Conference on Ecological Vehicles and Renewable Energies (EVER), Monte-Carlo, Monaco, 25-27 March 2014 (IEEE).
Shariff, S., Alam, M. S., Khan, S., Shemami, M. S., and Sayeed, F. (2018). “A review on sustainable xEV charging system in sun rich nations,” in 2018 International Conference on Computing, Power and Communication Technologies, GUCON 2018, Greater Noida, India, 28-29 September 2018 (IEEE), 1042–1048. doi:10.1109/GUCON.2018.8674905
Shariff, S. M., Iqbal, D., Saad Alam, M., and Ahmad, F. (2019). A state of the art review of electric vehicle to grid (V2G) technology. IOP Conf. Ser. Mat. Sci. Eng. 561, 012103. doi:10.1088/1757-899X/561/1/012103
Singh, A., and Shimi, S. L. (2017). “MATLAB/SIMULINK simulation of PV system based on MPPT in variable irradiance with EV battery as load,” in 2017 IEEE International Conference on Computational Intelligence and Computing Research, ICCIC, Coimbatore, India, 14-16 December 2017 (IEEE). doi:10.1109/ICCIC.2017.8524563
Solar for Home, Utility, and Commercial (2022). Trina solar. Available at: https://www.trinasolar.com/us (Accessed April 30, 2022).
Wang, D., Sechilariu, M., and Locment, F. (2020). PV-powered charging station for electric vehicles: Power management with integrated V2G. Appl. Sci. Switz. 10, 6500. doi:10.3390/APP10186500
Yang, Y., Jia, Q. S., Guan, X., Zhang, X., Qiu, Z., Deconinck, G., et al. (2019). Decentralized EV-based charging optimization with building integrated wind energy. IEEE Trans. Autom. Sci. Eng. 16, 1002–1017. doi:10.1109/TASE.2018.2856908
Keywords: electric vehicles, MPPT, PV system, perturb & observe, fast charging, li-ion battery
Citation: Awad M, Ibrahim AM, Alaas ZM, El-Shahat A and Omar AI (2022) Design and analysis of an efficient photovoltaic energy-powered electric vehicle charging station using perturb and observe MPPT algorithm. Front. Energy Res. 10:969482. doi: 10.3389/fenrg.2022.969482
Received: 15 June 2022; Accepted: 04 July 2022;
Published: 04 August 2022.
Edited by:
Mohamed A. Mohamed, Minia University, EgyptReviewed by:
Mohamed M. Refaat, Electronics Research Institute, EgyptCopyright © 2022 Awad, Ibrahim, Alaas, El-Shahat and Omar. This is an open-access article distributed under the terms of the Creative Commons Attribution License (CC BY). The use, distribution or reproduction in other forums is permitted, provided the original author(s) and the copyright owner(s) are credited and that the original publication in this journal is cited, in accordance with accepted academic practice. No use, distribution or reproduction is permitted which does not comply with these terms.
*Correspondence: Adel El-Shahat, YXNheWVkYWhAcHVyZHVlLmVkdQ==
Disclaimer: All claims expressed in this article are solely those of the authors and do not necessarily represent those of their affiliated organizations, or those of the publisher, the editors and the reviewers. Any product that may be evaluated in this article or claim that may be made by its manufacturer is not guaranteed or endorsed by the publisher.
Research integrity at Frontiers
Learn more about the work of our research integrity team to safeguard the quality of each article we publish.