 Zhao Fei
 Xue Longjiang2
94% of researchers rate our articles as excellent or good
Learn more about the work of our research integrity team to safeguard the quality of each article we publish.
Find out more
ORIGINAL RESEARCH article
Front. Energy Res., 05 January 2023
Sec. Process and Energy Systems Engineering
Volume 10 - 2022 | https://doi.org/10.3389/fenrg.2022.968944
This article is part of the Research TopicAdvanced Technologies for Planning and Operation of Prosumer Energy Systems, volume IIView all 30 articles
Aiming at the problem of insufficient adaptability to the new elements of the new power system in the current distribution network investment method, this paper innovatively proposes a distribution network investment method based on the new power system. By constructing a source-grid-load-storage-side investment calculation model, the investment in the new power system can be accurately calculated. First, the distributed power investment is calculated from the two aspects of new construction and renovation. Secondly, construct the grid investment demand and grid investment capacity measurement model, and obtain the grid side investment model by weighted summation. Then, a model for calculating the scale of investment that can be saved due to demand-side response is constructed, and the cost of demand response is subtracted to obtain a model for calculating the scale of investment that can be saved on the load side. Finally, the energy storage side investment calculation model is constructed from the power supply side, grid side, user-side energy storage investment, and energy storage investment benefit. The research results are applied to the empirical area, and scientific guidance is provided to realize the precise investment in the area.
Building a new type of power system is an all-round change, a very challenging and pioneering strategic project (Sánchez et al., 2022). From the perspective of power grid investment, the investment structure and focus will undergo major changes (He et al., 2022). Power grid enterprises should actively implement the reform of management methods (Zhu et al., 2022), change investment concepts and thinking in a timely manner, accurately grasp the focus and direction of investment, optimize investment strategies (Zhang et al., 2022), and provide sufficient and accurate investment support for the construction of new power systems.
At present, experts and scholars have conducted much research on distribution network investment methods. Reference (Ren et al., 2019)estimates the size of the distribution network based on the current situation and load growth of the distribution network, and proposes a model strategy for distribution network investment allocation in combination with regional development needs, economic and social benefits of investment. Reference (Zheng et al., 2021) establishes an improved comprehensive evaluation method and evaluation model of distribution network investment benefit based on the individual evaluation results of investment benefit of distribution network reconstruction project, combined with information entropy and fuzzy analysis method. Reference (Wu et al., 2019)starts from technology, benefit, and project maturity, and builds an index system for investment ranking and evaluation of power grid planning projects under the new power reform environment. The precise investment decision of the distribution network in the above literature is mainly aimed at the traditional power system and has insufficient adaptability to the new elements of the new power system.
In order to implement the dual carbon goal, the state proposes to build a new power system with new energy as the main body. Compared with the traditional power system, its core feature is that new energy occupies a dominant position. In the future, wind power, photovoltaics, and energy storage will show explosive growth. Reference (Elkadeem et al., 2019) proposes an optimal investment model for a distribution network with renewable energy that considers efficiency, benefit, and carbon emission reduction. Based on the research of regional multi-energy system model, reference (Nazir et al., 2021) proposes a regional renewable energy generation capacity planning and investment benefit optimization model based on different dispatch time scales. Reference (Gao and Zhao, 2018) used system dynamics and evolutionary game methods to study the willingness of all parties to photovoltaic projects under the contract energy management model. Although the above references all add new elements related to renewable energy and storage, they do not fully consider the impact of new elements on the investment and construction of the new power system on the four sides of the source, network, load and storage.
In order to adapt to the new elements of the new power system, this paper proposes a distribution network investment method based on the new power system. By constructing the four-side investment model of source, network, load, and storage, and predicting and analyzing the investment data of each side, the asset investment strategy of power grid enterprises can be adjusted., It is of great significance to realize precise investment and improve market competitiveness.
The general idea of research on new power system investment methods is shown in Figure 1.
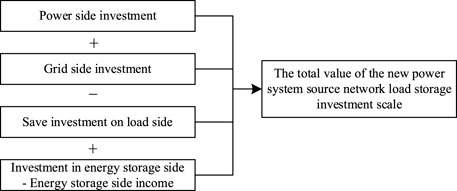
FIGURE 1. Research idea of new power system investment method.
The formula for calculating the total investment scale of the source, grid, load, and storage side of the new power system is shown in Eq. 1:
In the formula,
Investment on the power supply side: In response to the need of accelerating the construction of a clean, low-carbon, safe and efficient modern energy system, taking clean development as the direction, and investing in optimizing the power supply structure on the basis of ensuring energy security.
Grid-side investment: In order to accelerate the transformation of the distribution network from a single power supply to an intelligent and interactive energy Internet, realize a first-class modern distribution network with high reliability, good interaction, economic efficiency, and reasonably and effectively meet the demand for load growth and safe and reliable power saving on the load side: the investment in the construction of high, medium, and low voltage distribution networks that can be saved due to interruptible load response, etc. Minus the cost of demand response.
Energy storage side investment: the initial cost investment of energy storage on the power supply side, the grid side, and the user side, and the operation cost investment minus the energy storage subsidy.
Energy storage side income: The income from increasing on-grid electricity, reducing the deviation of power generation plant, and providing auxiliary services is the energy storage income on the power supply side; the income such as delaying the investment in grid construction is the energy storage income on the grid side; the income such as peak-valley arbitrage is the energy storage income on the user side.
Figure 2 shows the calculation process of the investment scale of the power supply side in the future.
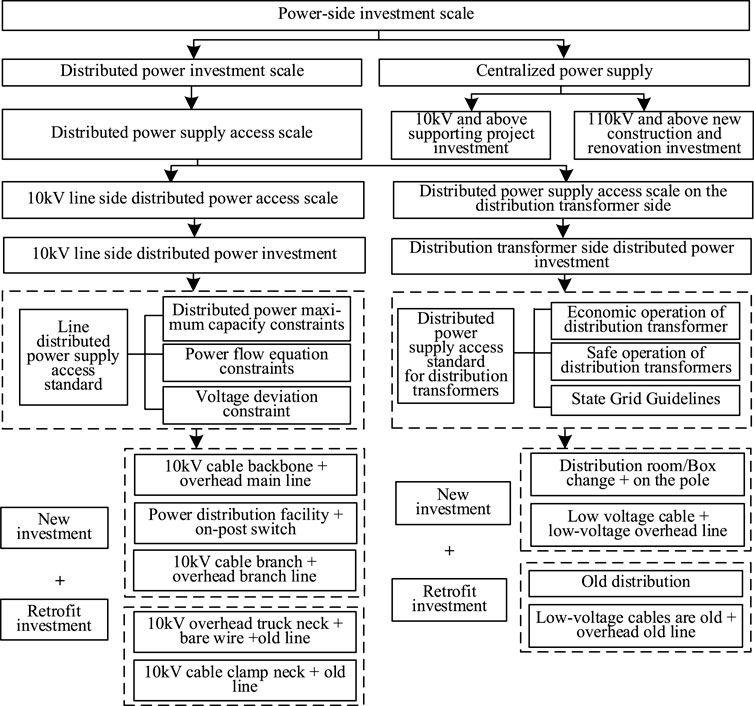
FIGURE 2. Flow chart of investment scale calculation of power supply side in future years.
The total investment scale of the power supply side is the sum of the investment in the centralized power supply and the investment in the distributed power supply. This paper mainly studies the calculation method of the investment scale of the distributed power supply (Abdelkader et al., 2018). The calculation formula is shown in Eqs. 2–3:
In the formula,
Considering that the tie line satisfies the N-1 check and the maximum load rate of the single radiation line does not exceed 70%, the maximum access capacity of the single-circuit 10 kV line distributed power supply is 6 MW.
1) Investment in new 10 kV lines and power distribution facilities
The calculation formula is shown in Eq. 4:
In the formula,
2) Investment in transforming 10 kV lines
The calculation formula is shown in Eq. 5:
In the formula,
After calculation, the maximum distributed power access capacity
1) Investment in new distribution transformers
The calculation formula is shown in Eq. 6:
In the formula,
2) Investment in the transformation of distribution transformers
The calculation formula is shown in Eq. 7:
In the formula,
Figure 3 shows the calculation process of the investment scale on the grid side in the future.
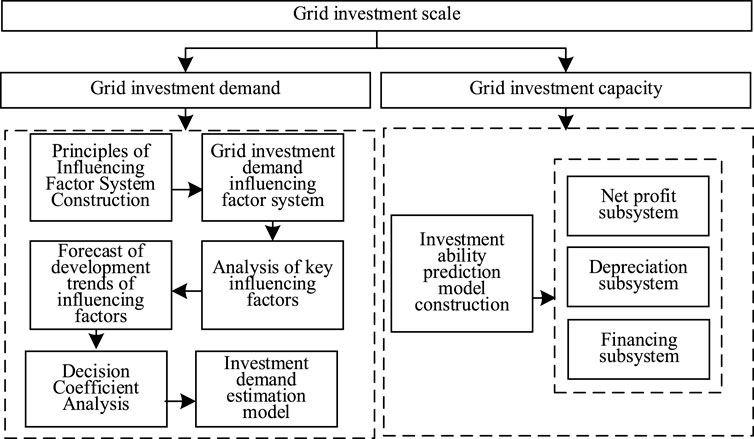
FIGURE 3. Calculation flow chart of investment scale of grid side in future years.
The calculation formula for the investment scale on the grid side is shown in Eq. 8:
In the formula,
The idea of investment demand estimation is shown in Figure 4.
1) Influencing factor system of power grid investment demand
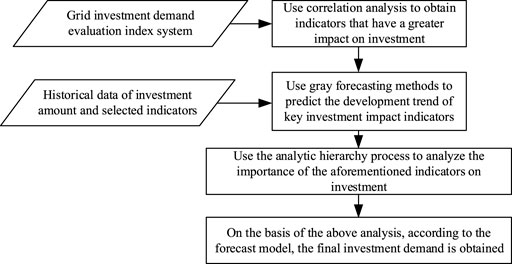
FIGURE 4. Investment demand forecasting ideas.
The indicator system is shown in Figure 5.
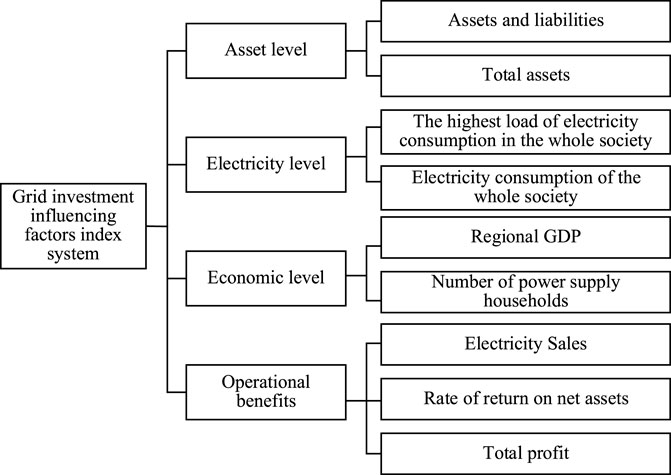
FIGURE 5. Investment scale forecast influencing factors.
The selection of key impact indicators is carried out through correlation analysis (Gao et al., 2022). Correlation analysis refers to the analysis of two or more related variable elements to measure the closeness of the correlation between the two variable factors.
The calculation of the correlation coefficient is shown in Eq. 9:
In the formula,
From the correlation analysis, the key impact indicators are GDP, the number of power supply households, electricity sales, total profit, and the highest load of the whole society.
3) Forecast of the development trend of influencing factors based on gray forecast
The amount of data required for gray prediction is small. When processing the data, it does not seek the probability distribution and statistical law of the data but uses the “gray generation method” to seek a new sequence with weakened randomness and strengthened regularity. The GM (1, 1)model is used for the prediction of the development trend of the influencing factors.
The initial year index value is recorded as
By reducing the above formula, the gray prediction model of the original sequence can be obtained as:
4) Decision coefficient analysis based on AHP (Wang et al., 2021)
The analytic hierarchy process is used to analyze and predict the decision coefficient of key impact indicators. The calculation steps are as follows:
Generally, the judgment matrix is established by the reciprocal 1–9 scale scaling method. Assuming that the judgment matrix is:
Assuming that the judgment moment is
By normalizing
The rationality of the decision coefficient can be verified by the consistency of the judgment matrix. If the judgment matrix can pass the consistency check, it means that the decision coefficient is reasonable; otherwise, the decision coefficient is unreasonable.
Calculate the maximum eigenvalue
To calculate the consistency index C.I., the formula is shown in Eq. 15:
Define the mean consistency metric R.I..
4) Calculate the random consistency ratio C.R., the formula is shown in Eq. 16:
The average random consistency index R.I. can be found from the Table 1 according to the matrix order m.

TABLE 1. Average stochastic consistency indicator parameters.
When
5) Grid investment demand estimation
Construct an investment demand estimation model as shown in Eq. 17:
In the formula,
Figure 6 shows the calculation idea of investment capacity.
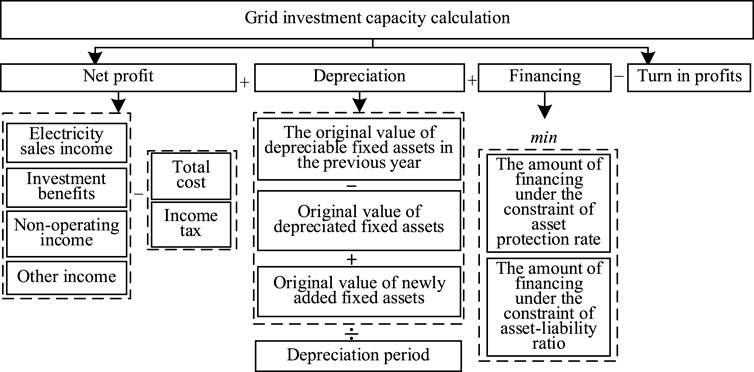
FIGURE 6. Investment capability forecast flow chart.
The power grid investment capacity prediction model (Yi et al., 2021) can be divided into profit subsystem, depreciation subsystem, and financing subsystem.
The investment ability prediction formula is shown in Eq. 18:
In the formula,
1) The net profit subsystem is shown in Eq. 19:
In the formula,
2) The depreciation subsystem is shown in Eq. 20:
In the formula,
3) The financing subsystem is shown in Eqs. 21–23:
In the formula,
Figure 7 shows the calculation process of the scale of investment savings on the load side in the coming years.
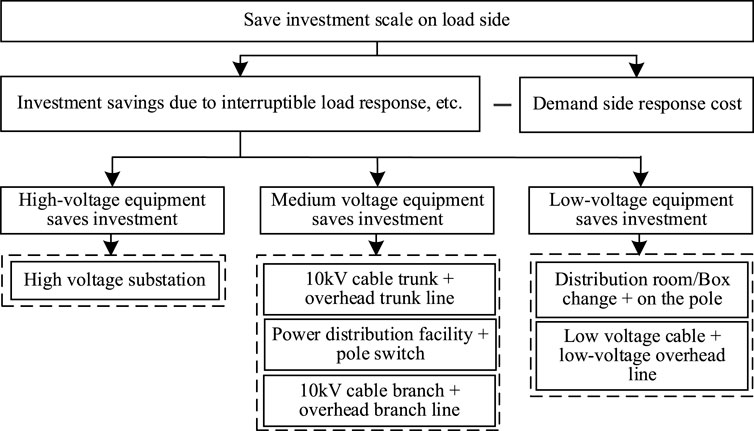
FIGURE 7. Flow chart of the scale of investment savings on the load side in the coming years.
The formula for calculating the scale of saving investment on the load side is shown in Eqs. 24–25:
In the formula,
The cost of demand-side response (Yang et al., 2021) is calculated according to the regional demand response subsidy price scheme.
Figure 8 shows the calculation process of the investment scale of the energy storage side in the future.
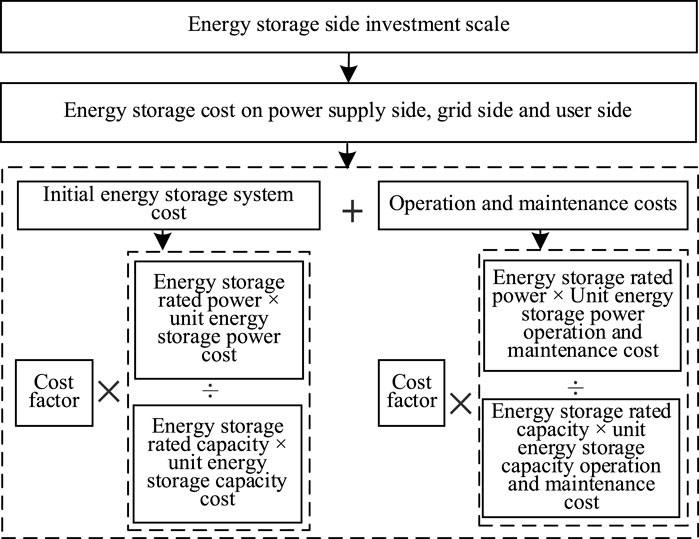
FIGURE 8. Calculation flow chart of investment scale of energy storage side in the future.
The total investment cost of the energy storage system is shown in Eqs. 26–28:
In the formula,
Figure 9 shows the calculation process of the investment income of the energy storage side in the future.

FIGURE 9. Flow chart of future annual investment income calculation of energy storage side.
The future annual investment income of the energy storage side is shown in Eq. 29:
1) Delaying investment in grid construction
The economic benefits of reducing investment in grid expansion and reconstruction by installing energy storage can avoid fixed capacity costs, which can be determined according to the average cost of substations, transformers, transmission lines, and their supporting equipment that are less or delayed in construction, as shown in Eq. 30:
In the formula:
2) Peak and valley arbitrage income
Under the premise of charging and discharging twice a day, the main benefits of user-side energy storage projects are the peak-valley price difference and the peak-to-parity price difference arbitrage.
Assuming two charges and two discharges per day, the peak electricity price under special circumstances is not considered, and only the peak, flat, and valley electricity prices are considered, and the daily charge and discharge income is calculated as shown in Eqs. 31–33:
In the formula:
Policy subsidy income
The distribution network investment calculation method based on historical investment results (Li et al., 2019) and based on the new power system are respectively used to calculate the investment scale of the county’s power grid in the current year.
Based on the actual power grid investment scale from 2018 to 2021, the maximum deviation rate of the distribution network investment calculation method based on historical investment results is 9.42%, and the average deviation rate is 7.46%. But based on the new power system investment calculation, the maximum deviation rate is 4.14%, and the average deviation rate is 2.33%. The details are shown in Table 2.
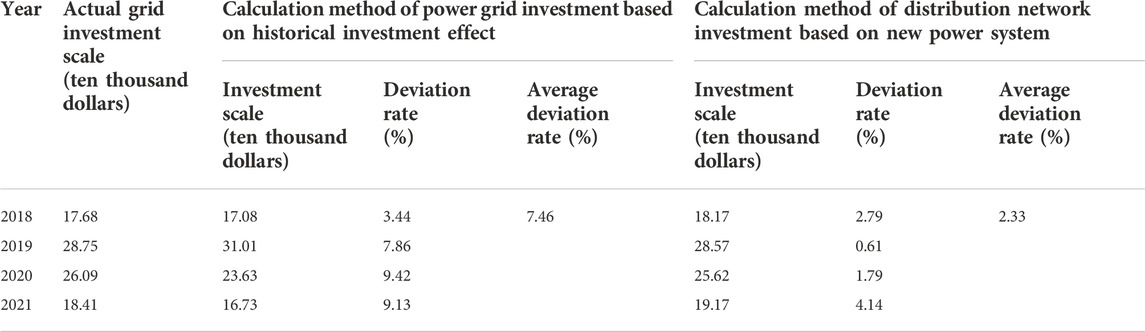
TABLE 2. Comparison of calculation results of two grid investment calculation methods.
The calculation results show that, compared with the distribution network investment calculation method based on historical investment results, the deviation rate of the distribution network investment calculation method based on the new power system is significantly smaller, and the investment scale is closer to the actual investment completion.
Taking a county as a demonstration area, the investment scale of the county’s distribution network based on the new power system is predicted in 2022.
The county is a Class C power supply area. In 2022, the installed capacity of distributed power supply in the county will reach 30 MVA, the current line can accommodate an installed capacity of 11.7 MVA, and the remaining capacity needs to be absorbed by new lines and distribution transformers. The variable side distributed installed capacity is 11.9 MV A. In 2022, the county’s power supply side investment is 3.6809 million dollars, and the details are shown in Table 3.
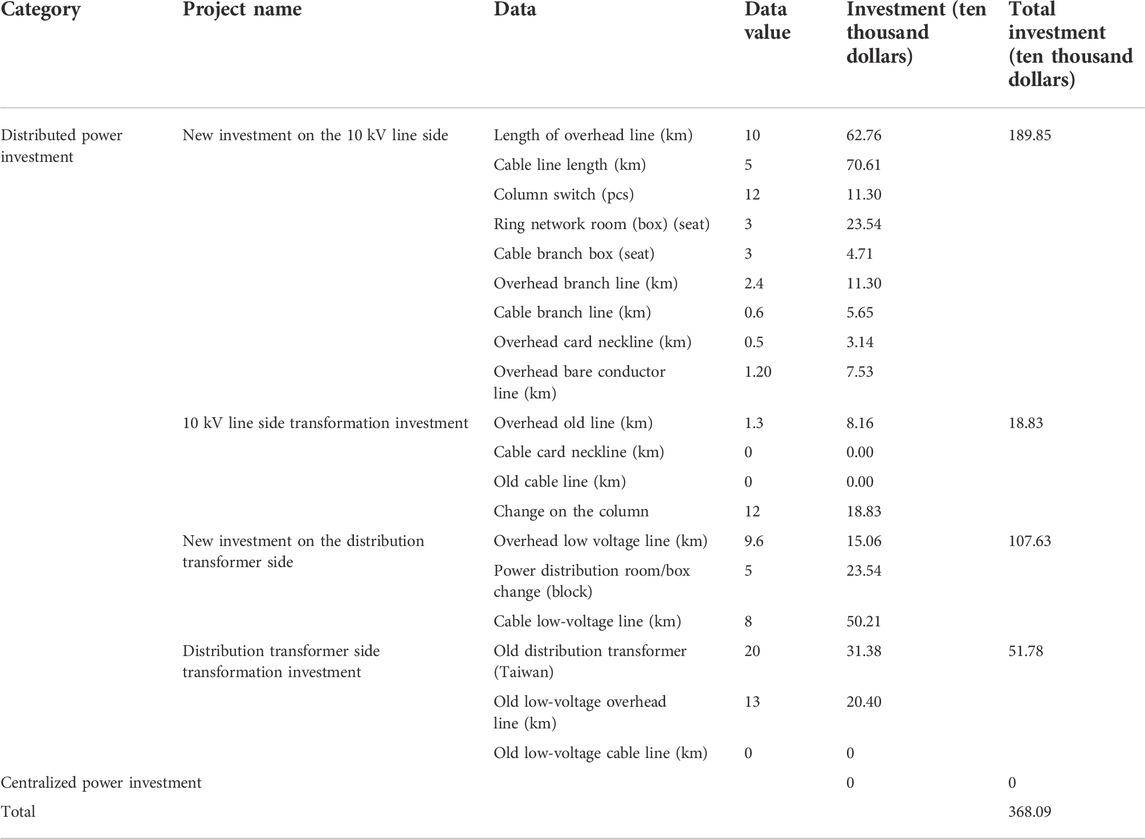
TABLE 3. Calculation results of investment scale on the power supply side.
1) Calculation of power grid investment demand
In 2022, the county’s power grid investment demand is 18.3998 million dollars, and the specific results are shown in Table 4.
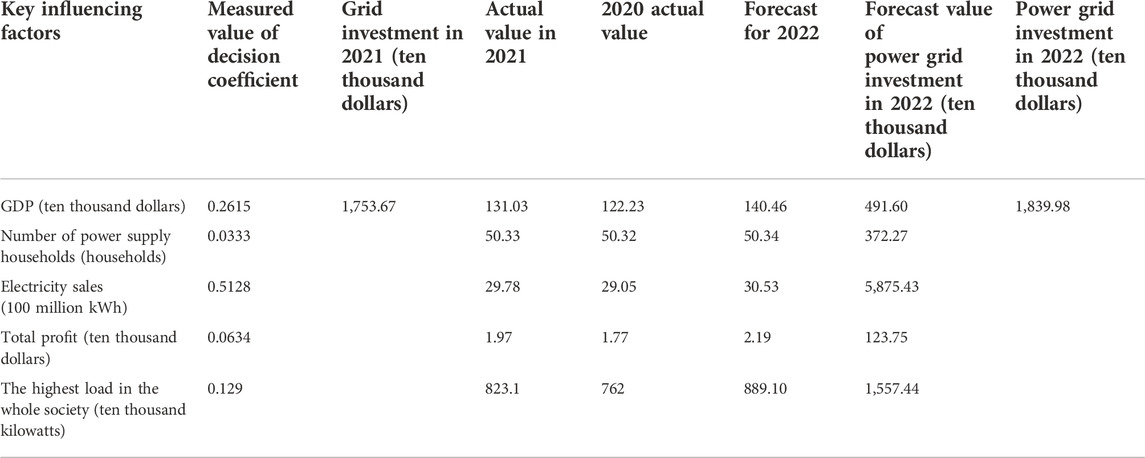
TABLE 4. Calculated results of power grid investment demand scale.
Taking the highest electricity load of the whole society as an example, the sensitivity analysis of the index is carried out. In 2022, the highest electricity load in the whole society will increase by 8% compared with 2021. Assuming other conditions remain unchanged, a sensitivity analysis is carried out on the different growth rates of the highest electricity load in the whole society. The calculation results of the scale of power grid investment demand show that when the growth rate of the highest electricity load in the whole society changes between −20% and 20%, the predicted value of investment demand changes between −3.34% and 6.59%.
The changes in the forecast value of investment demand are shown in Table 5.
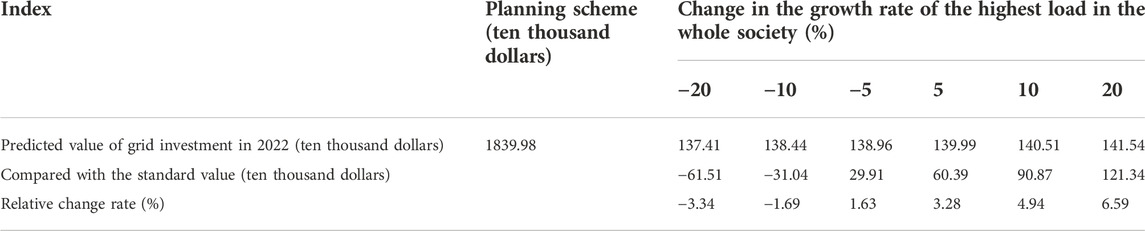
TABLE 5. Sensitivity analysis results of the highest electricity load in the whole society.
After calculation, GDP, electricity sales, and the highest load of the whole society are the most sensitive factors.
2) Calculation of power grid investment capacity
Using the investment capacity prediction model, it is estimated that the county’s power grid investment capacity in 2022 will be 28.2955 million dollars. The specific results are shown in Table 6.
3) Calculation results of grid side investment
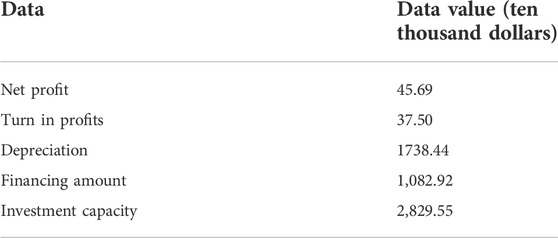
TABLE 6. Calculation results of power grid investment capacity.
Taking into account the investment demand and investment capacity of the power grid in the region, the weights of the investment proportion calculated by the AHP method are 0.4 and 0.6 respectively, and considering the grid side investment correction coefficient of 0.95, the final investment on the grid side of the county in 2022 is 23.1204 million dollars.
In 2022, the maximum demand-side response load in the county is 30MW, and the demand-side load response coefficient is 0.7. Due to the interruptible load response, 30 km of new 10 kV overhead lines, 36 switches on the column, 7.2 km of overhead branch lines, 32 transformers on the column, and 32 km of overhead low-voltage lines can be reduced, saving investment of 3.5648 million dollars as shown in Table 7.
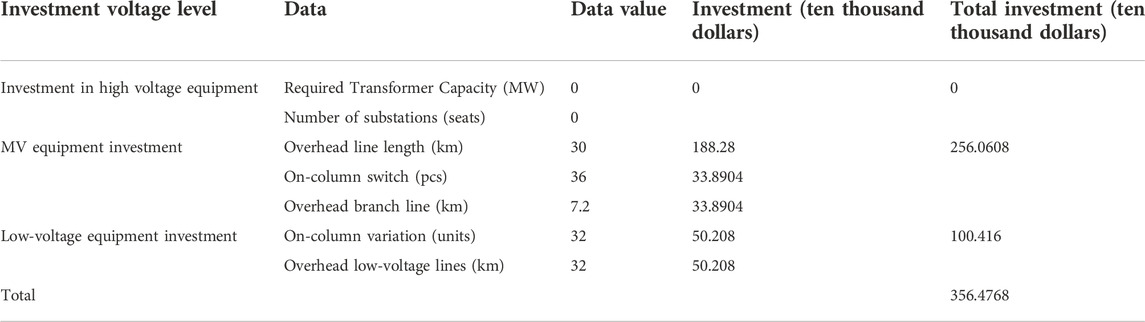
TABLE 7. Save investment due to interruptible load response in 2022.
The annual fixed unit price of the electricity subsidy is 62.79 cents/kWh, the single response time is 2 h, and the number of responses in the whole year is 10 times. The demand response load in the county is 65,577kW, and the demand response cost is about 0.8231 million dollars.
To sum up, the load-side saving investment in 2022 is 2.7416 million dollars.
1) Investment scale of energy storage side
In this paper, the unit energy storage power cost is 0.3923 million dollars/MW, the unit energy storage capacity cost is 0.3138 million dollars/MWh, and the unit energy storage power operation and maintenance cost and unit energy storage capacity operation and maintenance cost are 6.276 dollars/kW. In 2022, the county’s energy storage side investment will be 4.6741 million dollars, the details are shown in Table 8.
2) Energy storage side investment income
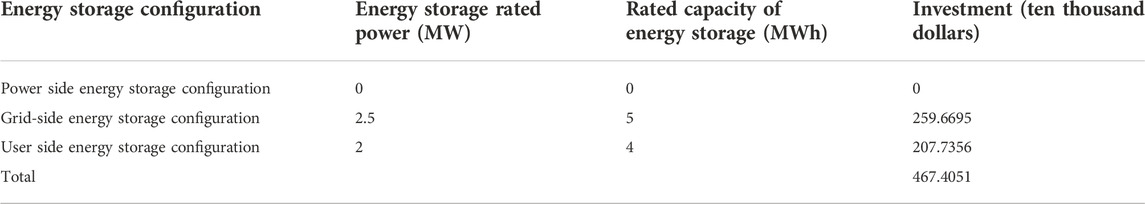
TABLE 8. Calculation results of investment scale on the energy storage side.
In this paper, the unit power cost of the distribution network is 0.1569 million dollars/MW, the charging and discharging efficiency is 81%, the fixed asset depreciation rate of the distribution equipment is 30%, and the rated power of the energy storage is 5 MW. According to Eq. 30, it can be obtained that the delay of power grid construction is 0.1906 million dollars.
In this paper, the peak electricity price is 14.59 cents/kWh; the trough electricity price is 3.36 cents/kWh, and the flat segment electricity price is 8.34 dollars/kWh. The rated capacity of the user-side energy storage is 4 MWh, the charging and discharging efficiency is 81%, and the energy storage system works 330 days a year. Then the Eqs. 31–33 can be obtained, the peak-valley arbitrage income is 0.1575 million dollars.
The energy storage compensation standard in this area is 31.38 dollars/kW per year. After calculation, the energy storage subsidy income in this area is 0.1412 million dollars.
To sum up, in 2022, the energy storage side income in the region will be about 0.5678 million dollars, and the energy storage side investment in the region 2022 will be 4.1847 million dollars.
The estimated scale of investment on the power supply side is 3.68 million dollars, the estimated scale of investment on the grid side is 23.1204 million dollars, the scale of saving investment on the load side is 2.7416 million dollars, and the estimated scale of investment on the energy storage side is 4.1847 million dollars.
According to the research idea of the new power system investment method, which can be obtained from Eq. 1, the total investment in the county’s new power system in 2022 is estimated to be 28.2443 million dollars.
Considering the investment and construction needs of new elements on the source, grid, load, and storage sides, this paper innovatively constructs an investment scale calculation model based on the new power system on the four sides of the source, grid, load, and storage. On the power supply side: Considering factors such as lines, distribution and transformation distributed power access standards, safe and reliable operation, and grid construction standards in different power supply areas, develop a new energy grid investment scale calculation model that takes into account safety and economy. On the grid side: overall consideration of regional investment needs and investment capacity, and research on the investment scale calculation model based on the three major financial statements, economic development and power demand. On the load side: Considering the interruptible load’s participation in peak shaving and the corresponding demand subsidy policy, a load-side saving investment scale calculation model that takes into account the benefits of the delay in the construction of the distribution network and the corresponding demand is developed. On the energy storage side: Considering the configuration of energy storage capacity and energy storage subsidy policy, develop an energy storage side investment calculation model that takes into account the costs and benefits of energy storage. The four-side investment calculation method based on the new power system, load and storage, plays an important role in meeting the precision requirements of distribution network investment projects under the new situation and improving the investment efficiency of the power grid.
The research results are applied to the calculation of the investment scale of a new power system in a county in the future, and can accurately predict the investment scale of the next year. From the perspective of historical years, compared with the traditional distribution network investment calculation method, the calculation results of the four-side investment scale calculation method of the source network, load and storage are more accurate and have certain forward-looking results. In the future, the input data optimization model can be revised based on accumulated experience, providing more flexible investment plans for long-term construction investment decisions, continuously improving the accuracy of model prediction, and better adapting to the new energy-based distribution network under the “carbon peaking and carbon neutrality” goals. New power system planning investment decisions.
The original contributions presented in the study are included in the article/supplementary material, further inquiries can be directed to the corresponding author.
ZF was responsible for the specific work of this article. ZF and XL guided the work of this article. CD and FJ did some calculations. FJ and WJ collected data and calculated and compared the plans.
The authors acknowledge the funding of the State Grid Corporation of China’s Science and Technology Project (JSB17202000260).
The corresponding author thanks State Grid Jiaxing Electric Power Supply Company and State Grid Zhejiang Electric Power Co., Ltd. Pinghu Power Supply Company’s selfless support.
The authors declare that the research was conducted in the absence of any commercial or financial relationships that could be construed as a potential conflict of interest.
All claims expressed in this article are solely those of the authors and do not necessarily represent those of their affiliated organizations, or those of the publisher, the editors and the reviewers. Any product that may be evaluated in this article, or claim that may be made by its manufacturer, is not guaranteed or endorsed by the publisher.
Abdelkader, A., Rabeh, A., Ali, D. M., and Mohamed, J. (2018). Multi-objective genetic algorithm based sizing optimization of a stand-alone wind/PV power supply system with enhanced battery/supercapacitor hybrid energy storage. Energy 163, 351–363. doi:10.1016/j.energy.2018.08.135
Elkadeem, M. R., Abd Elaziz, M., Ullah, Z., Wang, S., and Sharshir, S. W. (2019). Optimal planning of renewable energy-integrated distribution system considering uncertainties. IEEE Access 7, 164887–164907. doi:10.1109/ACCESS.2019.2947308
Gao, J., Wu, F., Yasen, Y., Song, W., and Ren, L. (2022). Generalized Cauchy process based on heavy-tailed distribution and grey relational analysis for reliability predicting of distribution systems. Math. Biosci. Eng. 19 (7), 6620–6637. doi:10.3934/mbe.2022311
Gao, L., and Zhao, Z. Y. (2018). System dynamics analysis of evolutionary game strategies between the government and investors based on new energy power construction public-private-partnership (PPP) project. Sustainability 10 (7), 2533. doi:10.3390/su10072533
He, Y., Xiong, W., Yang, B., Yang, H. Y., Zhou, J. F., Cui, M. L., et al. (2022). Combined game model and investment decision making of power grid-distributed energy system. Environ. Dev. Sustain. 24 (6), 8667–8690. doi:10.1007/s10668-021-01804-3
Li, K., Fu, G. H., and Tian, C. S. (2019). Distribution network investment allocation and project opimization method considering the historical investment effectiveness. Comput. Technol. Automation 38, 33–38. doi:10.16339/j.cnki.jsjsyzdh.201903007
Luo, C., Ling, W., Mo, D., Li, Y., Li, Q., Liang, Z., et al. (2021). Power system load forecasting method based on LSTM network. J. Phys. Conf. Ser. 2005, 012179. doi:10.1088/1742-6596/2005/1/012179
Nazir, M. S., Abdalla, A. N., Sohail, H. M., Tang, Y., Rashed, G. I., and Chen, W. (2021). Optimal planning and investment of Multi-renewable power generation and energy storage system capacity. J. Electr. Syst. 17 (2), 171–181. doi:10.1016/j.est.2020.101866
Ren, X., Ye, B., Yang, N., Shao, H., and Gao, C. (2019). “Investment optimization of incremental distribution network based on cooperative game in the context of investment liberalization,” in 2019 IEEE innovative smart grid technologies-asia (ISGT asia) (IEEE), 888–893. doi:10.1109/ISGT-Asia.2019.8881271
Sánchez, A., Zhang, Q., Martín, M., and Vega, P. (2022). Towards a new renewable power system using energy storage: An economic and social analysis. Energy Convers. Manag. 252, 115056. doi:10.1016/j.enconman.2021.115056
Wang, X., Zhou, Z., Sun, L., Xie, G., and Lou, Q. (2021). Study on the whole process evaluation of new energy grid connection based on AHP-entropy weight method IOP conference series: Earth and environmental science. IOP Conf. Ser. Earth Environ. Sci. 831 (1), 012023. doi:10.1088/1755-1315/831/1/012023
Wu, W., Li, M., Yan, T., Huang, P., Lu, X., and Wang, Z. (2019). “Distribution network project portfolio optimization decision model based on power demand matching,” in 2019 IEEE PES asia-pacific power and energy engineering conference (Macau, China: APPEEC), 1–5. doi:10.1109/APPEEC45492.2019.8994475
Yang, H., Wang, L., Ma, Y., Zhang, D., and Wu, H. (2021). Optimization strategy of price-based demand response considering the bidirectional feedback effect. IET Gener. Transm. Distrib. 15 (11), 1752–1762. doi:10.1049/gtd2.12131
Yi, L., Li, T., and Zhang, T. (2021). Optimal investment selection of regional integrated energy system under multiple strategic objectives portfolio. Energy 218, 119409. doi:10.1016/j.energy.2020.119409
Zhang, M., Tang, Y., Liu, L., and Zhou, D. (2022). Optimal investment portfolio strategies for power enterprises under multi-policy scenarios of renewable energy. Renew. Sustain. Energy Rev. 154, 111879. doi:10.1016/j.rser.2021.111879
Zheng, Y., Li, J., and Jiao, Y. (2021). “Distribution network planning and comprehensive investment evaluation based on bayes-entropy weight-fuzzy analytic hierarchy process,” in 2021 IEEE international conference on power electronics (Shenyang, China: Computer Applications (ICPECA), 477–481. doi:10.1109/ICPECA51329.2021.9362726
Keywords: new power system, distribution network investment, source network load-storage, calculation model, precise investment
Citation: Fei Z, Longjiang X, Jingliang Z, Ding C, Jinghui F and Jun W (2023) A novel investment strategy for renewable-dominated power distribution networks. Front. Energy Res. 10:968944. doi: 10.3389/fenrg.2022.968944
Received: 14 June 2022; Accepted: 31 August 2022;
Published: 05 January 2023.
Edited by:
Bin Zhou, Hunan University, ChinaReviewed by:
Leijiao Ge, Tianjin University, ChinaCopyright © 2023 Fei, Longjiang, Jingliang, Ding, Jinghui and Jun. This is an open-access article distributed under the terms of the Creative Commons Attribution License (CC BY). The use, distribution or reproduction in other forums is permitted, provided the original author(s) and the copyright owner(s) are credited and that the original publication in this journal is cited, in accordance with accepted academic practice. No use, distribution or reproduction is permitted which does not comply with these terms.
*Correspondence: Zhao Fei, emZqeGRsQDEyNi5jb20=
Disclaimer: All claims expressed in this article are solely those of the authors and do not necessarily represent those of their affiliated organizations, or those of the publisher, the editors and the reviewers. Any product that may be evaluated in this article or claim that may be made by its manufacturer is not guaranteed or endorsed by the publisher.
Research integrity at Frontiers
Learn more about the work of our research integrity team to safeguard the quality of each article we publish.