 Xiran Wang
 Yuhang Zhao
- Northeastern University, Shenyang, China
The electricity grid is facing the dual pressure of a high percentage of renewable energy generation and increasing load-side spike load. The participation of demand-side resources in grid interaction is an effective solution to this problem. To address this issue, a demand-side guidance method based on time-of-use pricing and coupon is proposed to increase the revenue of power retailers and reduce peak-valley difference. First, a guidance mechanism combining time-of-use pricing and coupon is proposed, and an adjustment load prediction model based on Attention-LSTM network is constructed to predict the adjustment load of electricity customers under different coupon coefficients. Based on this, a power purchase-sale optimization decision model in multi-level electricity market with the goal of maximizing the revenue of power retailers is established to set a suitable coupon strategy to guide electricity customers to participate in the interaction more precisely. Finally, the effectiveness of the proposed method is demonstrated by arithmetic examples.
Introduction
With the rapid development of the social economy and technology, especially the popularity of smart devices such as intelligent home appliances, demand-side electricity consumption has increased significantly and it has a substantial adjustable potential (Ying et al., 2016). The participation of demand-side resources in grid interaction can facilitate the transformation from a supply-side dominated grid to an interactive grid with demand-side participation, effectively improving the stability and economy of grid operation (Shan et al., 2015). Power retailers can guide the demand side to adjust their electricity consumption and participate in the grid interaction by releasing information about tariff concessions or incentives.
Electricity customers’ electricity consumption behavior is uncontrolled and can only be guided to participate in grid interactions using tariff offers or incentive messages. There have been many studies on guidance methods in the literature. For example, Muthuselvi and Saravanan (2021) proposed a time-of-use pricing dynamic pricing scheme to curb peak demand during peak periods by guiding customer load shifting through time-of-use pricing. Meanwhile, Yang et al. (2018) and Zhang et al. (2022) proposed price-based demand response mechanisms to direct customers to increase or decrease their loads in different scenarios through pricing. Lu et al. (2020) used points as an incentive and design a residential real-time point package mechanism to promote peak reduction and valley filling. In addition, En et al. (2020), Yun et al. (2021), and Zhi et al. (2021) used power sales packages as incentives, combined with a customer choice model, to guide customers to actively participate in grid interactions. Finally, Zhong et al. (2013), Xin et al. (2016), and Jun and Qi (2019) provided coupon incentives to retail customers through a near-real-time information network to induce demand response over time in the future.
However, in reality, customers’ electricity consumption behavior is not entirely rational. The degree of rationality of their electricity consumption decisions is limited by available information, cognitive limitations, and other factors with typically limited rationality characteristics (Song et al., 2022). In electricity consumption behavior, customers are satisfiers rather than maximizers (Liu et al., 2017; Alfaverh et al., 2020), which means that demand-side participation in grid interaction is more random and volatile. The accuracy of these methods (Zhong et al., 2013; Xin et al., 2016; Yang et al., 2018; Jun and Qi, 2019; En et al., 2020; Lu et al., 2020; Muthuselvi and Saravanan, 2021; Yun et al., 2021; Zhi et al., 2021; Zhang et al., 2022) for calculating the customer electricity consumption adjustment amount is low. To improve the accuracy of customer electricity consumption adjustment volume prediction, Yuan et al. (2021) constructed a short-term load forecasting model of RBF neural network considering demand response factor, which reflects the change of load curve due to the influence of demand response signal. Song et al. (2022) proposed a deep reinforcement learning-based demand response optimization method for electric water heaters. In addition, Alfaverh et al. (2020) proposed a residential demand response energy management system based on reinforcement learning and fuzzy inference. Liu et al. (2017) introduced demand response influencing factors in the traditional Elman neural network model to improve the short-term electric load forecasting accuracy. Finally, Yu et al. (2018) estimated consumers’ cost functions based on their noisy responses and used linear regression to train the cost functions, based on which a joint online learning demand response pricing algorithm was proposed.
From this analysis, it can be seen that most of the existing studies on the amount of electricity adjustment for consumers use the efficiency function to uniformly describe the electricity adjustment characteristics of consumers. However, there is a lack of studies with different adjustment characteristics for different consumers, as well as a lack of studies on the guidance strategies for different consumers. Based on this, this study first proposes a guidance mechanism combining time-of-use pricing and coupon, and considers the influence of social information, such as temperature, humidity, customers’ limited rationality and behavioral habits. It then establishes a prediction model that is based on Attention-LSTM with temperature, humidity, tariff and historical load as input and electricity load adjustment as output for predicting the adjustment of customers’ electricity consumption after time-of-use pricing and coupon. The model is then solved by a particle swarm algorithm to obtain the optimal guiding strategy and power purchase strategy for power retailers, and the feasibility and effectiveness of the proposed method are verified through case studies.
The impact of time-of-use pricing and coupons on demand side
Coupon design
There are two types of power purchases by power retailers: the first is a medium-to long-term bilateral physical contract with power producers, and the second is a purchase of power from the day-ahead market. Among them, the medium- and long-term bilateral contracts adopt load segmentation mode. The longer the load duration, the lower the unit tariff in peak and valley hours, and the medium- and long-term contract tariff is lower than the day-ahead market clearing price. Therefore, this study proposes a coupon strategy based on peak-valley time-sharing tariff. In particular, we aim to obtain lower generation costs and reduce power purchase costs by guiding customers to reduce their load during peak hours and increase their load during valley hours to consolidate customers’ load into load segments of longer duration.
The coupon design needs to consider the following aspects:
1) Different customers have different load regulation characteristics (i.e., different customers have different load regulations under the same amount of coupon incentive), so the coupon amount should be positively correlated with the customer’s load regulation.
2) Considering the fairness factor, different customers should have the same coupon coefficient.
3) The coupon amount should be adjusted within a reasonable range and should not be extremely large or extremely small.
In summary, this study selects the form of a segmented linear function to represent the relationship between the coupon amount and the amount of customer load regulation. The amount of load reduced by customers during peak hours is positive, and the amount of load increased by customers during valley hours is positive. The expression of coupon denomination is as follows:
where
According to Equation 1, the expression of the relationship between coupon denomination and customer load regulation is shown in Figure 1.
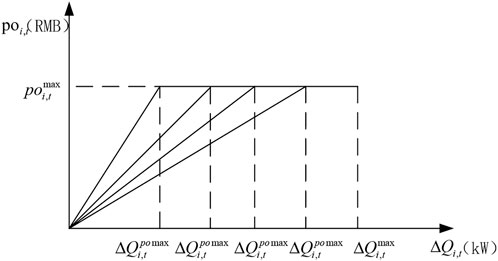
FIGURE 1. Coupon and customer load adjustment correspondence.
From Figure 1, it can be seen that the coupon amount will increase when the customer load adjustment amount increases positively, so that the coupon proposed in this study can make the actively adjusted customers get more benefits in each guidance mechanism implementation. At the same time, with different values of coupon coefficient
Analysis of the degree of influence of social information on the customer’s electricity load
Social information such as temperature, humidity, electricity price, and consumption habits can affect customer electricity load to some extent. To improve the accuracy of load adjustment volume forecasting, it is necessary to quantify the impact of each form of social information on the customer’s electricity load. The maximum information coefficient (MIC) can encapsulate the correlation between two variables by drawing a grid on the scatter plot of the two variables, and is independent of the distribution of the variable pairs and the type of correlation (Chowdhury et al., 2009). Therefore, in this study, the maximum information coefficient is used to quantify the degree of influence of social information on the customer’s electricity load, with the following expression:
where
In this study, we select the data from 1 January 2006 to 1 January 2011 in Australia, with a sampling time interval of 0.5 h, so the sample data volume is 87,648. The MIC of each social information and customer load are calculated separately, and the results are shown in Figure 2, so that the impact of different social information on the customer’s electricity load can be obtained. Because the historical electricity load reflects the characteristics of customer load according to the historical electricity price change, this study uses the historical load to represent the customer’s electricity consumption habit.
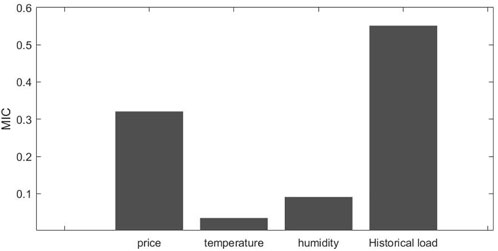
FIGURE 2. Customer base data and customer load correlation.
It can be seen that the degree of influence of each social information on the customer’s electricity load is different. Historical load has the greatest influence with MIC >0.5, while temperature and humidity have less influence on the customer’s electricity load with MIC <0.1. Electricity price has a greater influence on the customer’s electricity consumption, so this study expects to guide the customer for reasonable electricity consumption by issuing coupons.
To make the analysis more accurate, this study further divides the historical load into the previous moment load value Q (t-1), the previous two moments load value Q (t-2), the previous day same moment load value Q (t-24), the previous day previous moment load value Q (t-25), and calculates MIC to analyze the impact of historical load on customers’ electricity consumption load. The results are shown in Figure 3.
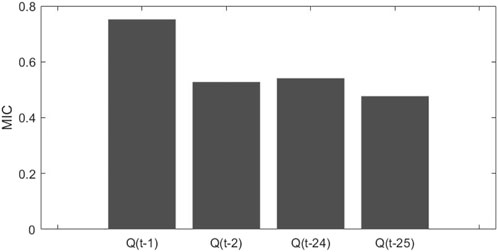
FIGURE 3. Impact of historical customer load on customer load.
From the results, we can see that the impact of electricity consumption habit (historical load) on its electricity consumption load is larger, MIC >0.4. The impact of load from the previous moment on its electricity consumption load is larger than the impact of load from the previous two moments on its electricity consumption load, which is larger than the impact of load from the previous moment the day before on its electricity consumption load. It can be seen that the further away from the current moment time, the smaller the impact on the current moment. The impact of load from the same moment the day before on its electricity consumption load is only second to the impact of the load of the previous moment on its electricity consumption load, and the impact of the same moment is also larger.
Attention-LSTM based load adjustment volume prediction
The results of the maximum information coefficient analysis show that different social information has different degrees of influence on the customer’s electricity consumption. Therefore, this study adopts the Attention mechanism to highlight the more critical influence data by assigning different weights to different social information (i.e., the input features of the model) and constructs the customer’s electricity consumption analysis function by Attention-LSTM (Cao et al., 2021), with inputs of forecast temperature at the prediction point moment
There is a functional relationship between the input vector x and the output adjustment load of electricity customers in Eq. 3, which is represented by the Attention-LSTM, and the input vector is the input feature vector of the Attention-LSTM model, and all the input feature vectors are represented in Eq. 4:
where
The structure of the Attention-LSTM model used in this study is shown in Figure 4. The Attention-LSTM model consists of two parts.
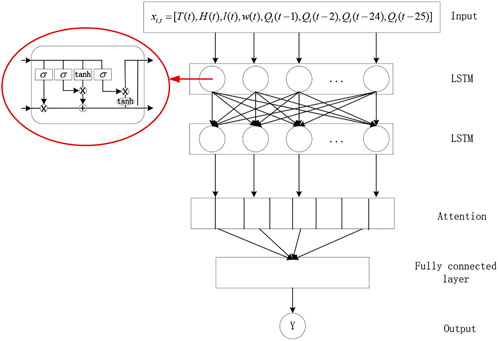
FIGURE 4. Attention-LSTM model.
The first part is a 2-layer LSTM, and the above social information is input into the first layer Pre-LSTM for pre-training, and the output
where
The second part is the Attention layer, which assigns the feature weights learned by the model to the input vectors in the next time step, highlighting the influence of key features on the predicted load. The final data are passed through the fully connected layer and adjusted to the output specified vector format. The final output layer is then obtained as the customer load adjustment at the prediction moment. The Attention is calculated as follows:
where
Power purchase-sale optimization decision model in multi-level electricity market
Purchase-sale structure of power retailers
At the present stage, the operation mode of electricity sellers is to participate in power market transactions to purchase electricity and sell it to downstream to customers to earn the difference in price. The price of electricity purchased by the electricity seller depends on the amount of load purchased. Costs can be reduced and revenue can be increased by guiding customers to make load adjustments. Therefore, this study establishes an optimization decision model to verify the effectiveness of the proposed steering method. The relevant electricity seller purchase and sale structure includes the electricity purchase and sale methods, as shown in Figure 5.
1) Purchase methods of power retailers
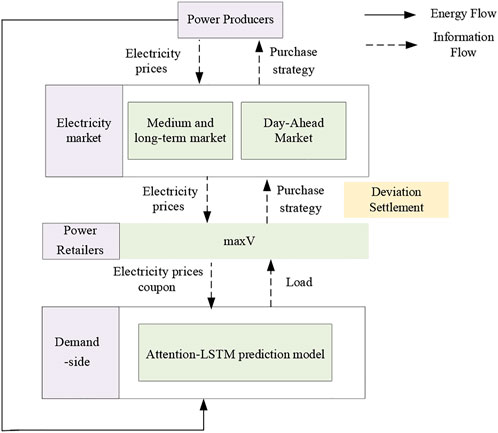
FIGURE 5. Purchase-sale structure of power retailers considering information guidance.
The electricity market is the primary way for power retailers to purchase electricity. The first type of physical contract is to purchase electricity from the medium- and long-term demand (Feng et al., 2018; Wang et al., 2020), where power retailers and power generators sign medium- and long-term bilateral physical contracts, and the bilateral physical contracts adopt the load segmentation model, taking into account the characteristic that the cost of power generation decreases with the increase of continuous production time and the opportunity cost of units participating in auxiliary service transactions, such as pre-listing balancing at different times, and the bilateral physical contracts are carried out according to the load duration. The second type of physical contract is to purchase power from the day-ahead market, so that the power seller can purchase power from the day-ahead market for power adjustment when the deviation of power is caused by uncertainties between the medium- and long-term market purchases and the actual required load, thus reducing the risk of power purchase. This reduces the risk of power purchase. Therefore, the power purchase strategy of the power seller can be equated with the optimal allocation of the contracted power and the purchased power in the day-ahead market for each load segment of the power seller.
2) Sale methods of power retailers
To solve the problem that the peak and valley tariff is not strong enough to guide customers to reach the ideal load adjustment amount, a coupon strategy is proposed, in which the coupon amount received by customers is positively correlated with the load adjustment amount to motivate customers to actively adjust their load, thus guiding them to reach the target load.
Multi-level market power purchase cost
1) Cost of power purchase for medium- and long-term bilateral physical contracts
The current widely used time-sharing contract has the same price with time and the same price at the same point of time, this contract ignores the physical characteristics of continuous production of electricity, and the time-varying price method cannot accurately reflect the production cost of electricity (Wen et al., 2019). Therefore, this study uses segmented contracts (i.e., the load is divided into different durations according to the characteristics of continuous production of electricity) and each duration is divided into different contracts. Therefore, the electricity seller enters into a medium- and long-term contract to purchase electricity with the expression:
where R is the number of medium- and long-term contracts signed by the electricity seller;
2) Cost of electricity purchased in the market before
Because there are deviations between the contracted electricity and the actual electricity consumption of customers in the medium- and long-term contracts signed by the power seller, to reduce the deviation power penalty, the power seller needs to make a short-term load forecast before the day. They then purchase electricity in the day-ahead market to minimize the deviation power penalty and reduce the risk of electricity purchase according to the deviation between the contracted electricity and the forecasted electricity. The cost of electricity purchase by the power seller in the day-ahead market can be expressed as follows:
where
A statistical analysis based on actual data from the U.S. PJM day-ahead market reveals an approximately linear relationship between the day-ahead market and load levels within a specific load range (Zhaoxia and Bin, 2006):
where a and b are linear correlation parameters.
Power purchase-sale optimization decision model
The revenue of the electricity seller is influenced by the customers’ actual electricity consumption and the cost of electricity purchase. The revenue of electricity sales is determined by the load of customers, and the cost of electricity purchase is determined by the method of electricity purchase and the amount of electricity purchased. The revenue model of the electricity seller is as follows:
where V is the total revenue from the sale of e-commerce;
The revenue from electricity sales
where I is a collection of customers;
The expression for the power purchase expense
The expression for the deviated power settlement tariff paid by the power seller to the power producer
where
The coupon cost
For electricity sellers, purchased and sold electricity should satisfy the power balance constraint:
where
The customer’s load adjustment should be between zero and the maximum adjustable load:
The customer should receive a coupon value between zero and the maximum value:
Solving power purchase-sale optimization decision model
This study solves the above electricity seller purchase and sale optimization decision model based on particle swarm algorithm and CPLEX solver. For customers, the Attention-LSTM model is used to predict the customer load adjustment for a given coupon factor, and feeds back to the electricity seller’s electricity purchase and sale decision model. For the electricity seller, the particle swarm algorithm is used to solve the optimal coupon coefficient in the iterative process with the interest of the electricity seller as the fitness function, and the CPLEX is used to solve the optimal electricity purchase for each market of the electricity seller according to the customer load adjustment amount to maximize the revenue of the electricity purchase and sale of the electricity seller.
The model solving process is shown in Figure 6 and is described as follows:
1) First, the number of particles and the maximum number of iterations are set, and the coupon parameter particles are randomly initialized.
2) Call the customer electricity consumption behavior analysis program to solve the electricity consumption of each customer at each time based on Attention-LSTM.
3) Call the electricity seller optimization subroutine to solve the electricity purchase strategy of the electricity seller based on the CPLEX solver with the maximum benefit as the objective function.
4) Then calculate the fitness value of each particle, update the velocity and position of the particle-based on the updated learning factor and inertia weight, update the coupon coefficient and the fitness function of the particle, and update the local optimum of each particle and the global optimum of the particle population.
5) Determine whether the iteration termination condition is satisfied (i.e., whether the maximum number of iterations is reached).
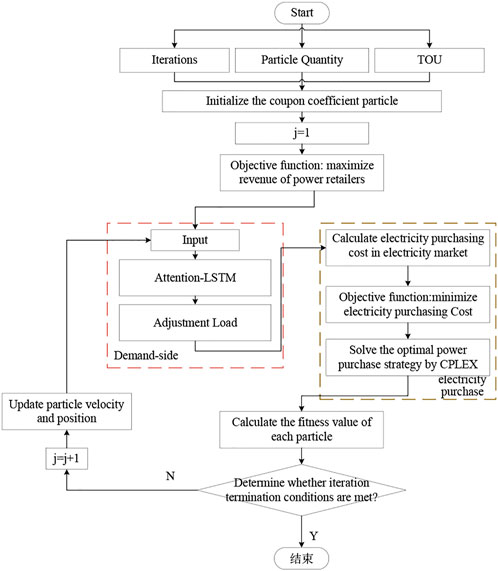
FIGURE 6. Solution flow of power purchase-sale optimization decision model.
Case study
In this study, simulation analysis is performed with real data from Australia in 2006. The required data include input data: temperature, humidity, coupon coefficient, historical load and electricity price, and the corresponding output data load adjustment volume. The first 80% of the data is used to train the Attention-LSTM model, and the second 20% is used for testing, and the peak and valley tariffs are shown in Table 1, and the maximum adjustable electricity consumption in both peak and valley periods is taken as 20% of the historical average electricity consumption in the corresponding period. The linear correlation coefficients between the standard market clearing tariff and the load level were taken as a = 0.4 and b = 235. The load was divided into three contract periods of 4, 8, and 24 h, with six contract periods of 4 h, three contract periods of 8 h and one contract period of 24 h, and each contract tariff is shown in Table 2.

TABLE 1. Time-of-use pricing.
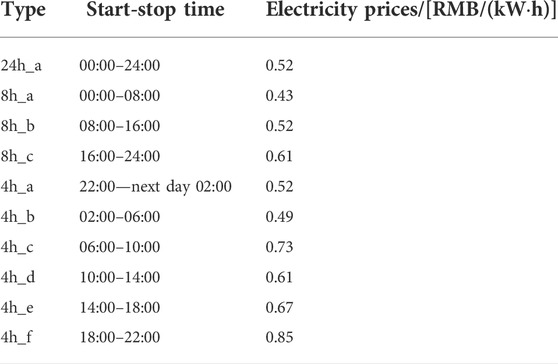
TABLE 2. Medium- and long-term bilateral contracts.
Based on these data, this study carries out simulation programming in MATLAB environment. Taking 1h as a period, 00:00–01:00 will be taken as period 1, 01:00–02:00 will be taken as period 2, and so on, we can get a total of 24 periods in a day. As we can see from the mid- and long-term market contract tariffs and the day-ahead market tariffs, the mid- and long-term market contract tariffs are lower than the day-ahead market tariffs, and the 24-h contract tariffs are the lowest. In this study, assuming that the customer load reduction is positive and the increase is negative, the optimal coupon coefficients developed by the electricity seller and the guided customer load change are shown in Figure 7.
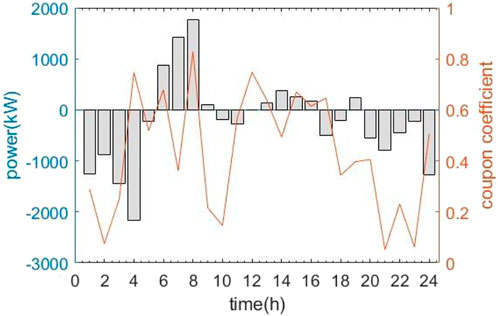
FIGURE 7. Optimal coupon coefficient and customer load adjustment.
It can be seen from Figure 7 that the change in customer load is also more significant in time periods 2 and 21, when the coupon coefficient is smaller, while in time periods 12, 14, and 15, when the coupon coefficient is larger, the customer load this variable is also smaller and less than the change in time periods 2 and 21. This happens because customer load is affected not only by coupons but also by environmental factors such as historical load, temperature, and humidity, resulting in a positive correlation between this variable of customer load and coupon coefficient. In addition, the customer load decreases in the valley moments and increases in the peak moments, which is consistent with the expected results.
As can be seen from Figure 8, the power seller mainly signs contract 1 (i.e., 24-h) load, and the load that is less than 24 h is made up by other contracts, so other hourly contracts also have a small amount of purchasing power, and the part of the load that is not long enough for 4 h is purchased from the day-ahead market, thus ensuring the balance of supply and demand to maximize the revenue of the power seller, and the balance of supply and demand is shown in Figure 9.
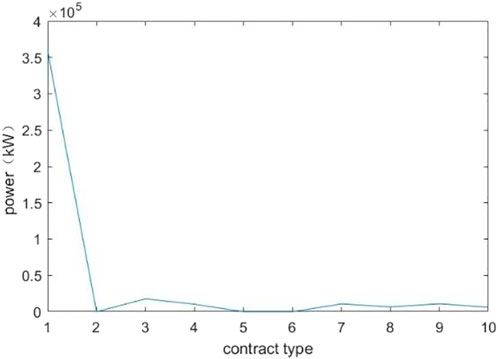
FIGURE 8. Electricity purchased by power retailers through various contracts in mid- and long-term markets.

FIGURE 9. Analysis of load balance after time-of-use pricing and coupon guidance.
As can be seen from Figure 9, the power purchased in the medium- and long-term market can meet the demand of customers’ electricity load by decomposing the power of each contract into various time periods and the power purchased in the day-ahead market. The power purchased in time periods 2 and 3 is greater than the customer load, which is due to the fact that the power purchased in the medium- and long-term market is the shortest 4h, so there will be excess power purchased in these two time periods when the power demand of other time periods is met. However, the discount obtained from purchasing contracted power than the power purchased in the day-ahead market is greater than the deviation penalty cost, so the results are in line with expectations.
From Figure 10, it can be seen that after using the coupon strategy, electricity sellers can increase their revenue by 1.33% per day. It can be seen from Figure 11 that the customer load curve is flatter after the coupon information is released by the electricity seller, among which the coupon is more effective in increasing the electricity consumption of customers during the valley hours, and the coupon guidance is relatively less effective because the customers habitually use more electricity during the peak hours. In summary, the demand-side resource participation method based on time-of-use pricing and coupon guidance that is proposed in this study can effectively guide customers to adjust electricity consumption, reduce electricity consumption during peak hours, and increase electricity consumption during valley hours, which not only reduces the electricity purchase cost of electricity sellers but also achieves the effect of peak reduction and valley filling, and improves grid security.
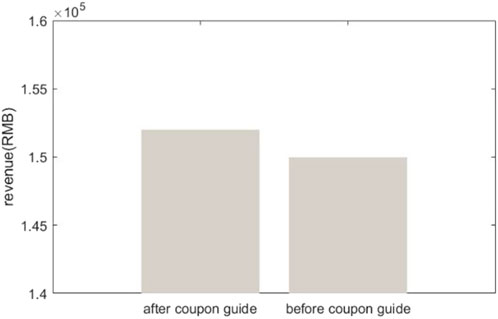
FIGURE 10. Comparison of the revenue of power retailers before and after guidance strategy.
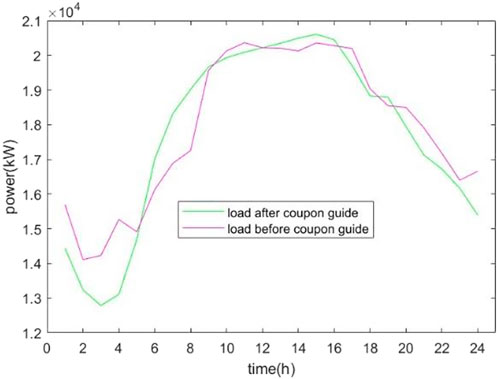
FIGURE 11. Load before and after guidance strategy.
Conclusion
In response to the problem of high proportion of renewable energy generation and increasing peak load on the load side, this study proposes a demand-side resource participation grid interaction method based on time-of-use pricing and coupon guidance. It also introduces coupons as guidance information on the basis of time-of-use pricing and uses Attention-LSTM model to predict the adjustment amount of customer electricity load after the implementation of different coupon strategies, which overcomes the problem of lack of historical customer load data before and after the coupon effect. This study also fully explores the influence of social information such as coupons on customer electricity load. The problem of lack of historical load data before and after the coupon effect is overcome, and the impact of coupons and other social information on customer load is fully explored. On this basis, this study establishes a multi-level market power purchase and sale model for electricity sellers based on the influence of social information, combined the prediction algorithm with the optimization problem, and it obtains the optimal coupon strategy and multi-level market power purchase allocation strategy using particle swarm algorithm and CPLEX solver.
It is verified that the demand-side resource participation method based on time-of-use pricing and coupons can effectively guide customers to reduce electricity consumption in peak hours and increase electricity consumption in valley hours, and increase electricity consumption in the 24 h load section, thus reducing the cost of electricity purchase, increasing the interest of electricity sellers, and reducing peaks and filling valleys. This study also analyzes and verifies that the bootstrap method is realistic and feasible, using coupons and time-of-use pricing as examples, combined with the electricity purchase model of electricity sellers. In future research, the bootstrap method can also be applied to other areas outside of electricity sales.
Data availability statement
The raw data supporting the conclusion of this article will be made available by the authors, without undue reservation.
Author contributions
AY has published two articles as follows: AY, JL, ZL, and LY. Target detection and tracking in big surveillance video data. Lecture Notes in Computer Science[C]. BigCom 2016, 2016: 275-284. (EI: 20163002644773). 2. AY, JL, SJ, ZL. A Level Crossing ADC with Variable System Hysteresis [C]. 2019 Chinese Control and Decision Conference (CCDC), 2019:1038-42 (EI: 20194207533525).
Funding
This work was partially supported by the Fundamental Research Funds for the Central Universities (Nos. N2104018 and N2204006) and Natural Science Foundation of Science and Technology Department of Liaoning Province (No. 2021-BS-054).
Acknowledgments
I would like to extend my sincere gratitude to my supervisor, Shuowei Jin, for his instructive advice and useful suggestions on my thesis. I am deeply grateful for his help in the completion of this thesis.
Conflict of interest
The authors declare that the research was conducted in the absence of any commercial or financial relationships that could be construed as a potential conflict of interest.
Publisher’s note
All claims expressed in this article are solely those of the authors and do not necessarily represent those of their affiliated organizations, or those of the publisher, the editors, and the reviewers. Any product that may be evaluated in this article, or claim that may be made by its manufacturer, is not guaranteed or endorsed by the publisher.
References
Alfaverh, F., Denaï, M., and Sun, Y. (2020). Demand response strategy based on reinforcement learning and fuzzy reasoning for home energy management. IEEE Access 8, 39310–39321. doi:10.1109/access.2020.2974286
Cao, D., Chen, Y., Zhang, H., and Yuan, Z. (2021). An improved algorithm for the maximal information coefficient and its application. R. Soc. open Sci. 8 (2), 201424. doi:10.1098/rsos.201424
Chowdhury, T. G., Ratneshwar, S., and Mohanty, P. (2009). The time-harried shopper: Exploring the differences between maximizers and satisficers. Mark. Lett. 20 (2), 155–167. doi:10.1007/s11002-008-9063-0
En, L., Pei, B., and Hao, W. H. (2020). Pricing strategy design of electricity retail pricing package considering self-selectivity of customers. Automation Electr. Power Syst. 44 (19), 177–184. doi:10.7500/AEPS20191206003
Feng, X., Lu, S., Lin, G., Que, H., Lu, B., and Sun, H. (2018). “Research on the medium term market decision of electricity retailer considering risk,” in 2018 International Conference on Power System Technology (POWERCON), 06-08 Nov. 2018, Guangzhou, China, 721–728.
Jun, W., and Qi, H. (2019). Coupon incentives based customers voluntary demand response program via bilevel optimization mechanism. Power Syst. Prot. Control 47 (01), 108–114. doi:10.7667/PSPC171826
Liu, Z. J., Xiao, N., Wang, X., and Xu, H. (2017). “Elman neural network model for short term load forecasting based on improved demand response factor,” in Power Electronics Systems and Applications (PESA), 12-14 December 2017, Hong Kong, China, 1–5.
Lu, C., Shan, X. Q., and Biao, Y. Y., (2020). Optimization design of residents’real-time score plan for promoting peak-load shifting. Electr. Power Autom. Equip. 40 (07), 134–142. doi:10.16081/j.epae.202005006
Muthuselvi, G., and Saravanan, B. (2021). “Priority-based residential demand side management in smart grid using ToU pricing,” in 2021 Innovations in Power and Advanced Computing Technologies (i-PACT), 27-29 Nov. 2021, Kuala Lumpur, Malaysia, 1–6.
Shan, Z. H., Ying, W. Y., and Song, C. (2015). Impact of demand response on distribution system reliability. Automation Electr. Power Syst. 39 (17), 49–55. in Chinese. doi:10.7500/AEPS20150205007
Song, C., Han, G., and Zeng, P. (2022). Cloud computing based demand response management using deep reinforcement learning. IEEE Trans. Cloud Comput. 10 (1), 72–81. doi:10.1109/TCC.2021.3117604
Wang, M., Xu, X., Huang, Y., Yan, Z., and Yu, T. (2020). “Electricity purchase strategy and cost allocation for electricity retailers,” in 2020 12th IEEE PES Asia-Pacific Power and Energy Engineering Conference (APPEEC), 20-23 Sep. 2020, Nanjing, China, 1–5.
Wen, P., Jinrui, W., and Jun, Z. (2019). Short-term load forecasting model based on attention-LSTM in electricity market. Power Syst. Technol. 43 (05), 1745–1751. doi:10.13335/j.1000-3673.pst.2018.1554
Xin, F., Ran, H. Q., Xing, L. F., Wang, B., and Li, Y. (2016). Coupon-based de-mand response considering wind power uncertainty: A strategic bidding model for load serving entities. IEEE Trans. Power Syst. 31 (2), 1025–1037. doi:10.1109/tpwrs.2015.2431271
Yang, H., Zhang, J., Qiu, J., Zhang, S., Lai, M., Dong, Z. Y., et al. (2018). A practical pricing approach to smart grid demand response based on load classification. IEEE Trans. Smart Grid 9 (1), 179–190. doi:10.1109/tsg.2016.2547883
Ying, Y. X., Ming, Z., and Yin, L. G. (2016). Survey on demand response mechanism and modeling in smart grid. Power Syst. Technol. 40 (1), 220–226. doi:10.13335/j.1000-3673.pst.2016.01.030
Yu, M., Hong, S. H., Ding, Y. M., and Ye, X. (2018). An incentive-based demand response (DR) model considering composited dr resources. IEEE Trans. Ind. Electron. 66 (2), 1488–1498. doi:10.1109/tie.2018.2826454
Yuan, L., Ying, C., Fu, S. Y., Nan, Z. X., Cai, L. Y., and Yang, L. (2021). “Research on short-term load forecasting under demand response of multi-type power grid connection based on dynamic electricity price,” in 2021 IEEE International Conference on Power, Intelligent Computing and Systems (ICPICS), 29-31 July 2021, Shenyang, China, 141–144. doi:10.1109/ICPICS52425.2021.9524096
Yun, F. Z., Liang, Q. Y., Xin, H. W., and Tian, C. K. (2021). “Electricity price package design strategy considering customer's independent choice behavior,” in 2021 6th International Conference on Power and Renewable Energy (ICPRE), 892–897. doi:10.1109/ICPRE52634.2021.9635515
Zhang, D., Zhu, H., Zhang, H., Goh, H. H., Liu, H., and Wu, T. (2022). Multi-objective optimization for smart integrated energy system considering demand responses and dynamic prices. IEEE Trans. Smart Grid 13 (2), 1100–1112. doi:10.1109/tsg.2021.3128547
Zhaoxia, Z., and Bin, Z. (2006). Statistical analysis of day-ahead prices in PJM market. Automation Electr. Power Syst. 30(23), 53–57. doi:10.3321/j.issn:1000-1026.2006.23.011
Zhi, Z., Feng, L., and Zhi, L. Z., (2021). peak-valley combination electricity package design for electricity retailers considering bounded rationality of consumers. Automation Electr. Power Syst. 45 (16), 114–123. doi:10.7500/AEPS20201028002
Keywords: demand-side, coupon guidance, flexible interaction, time-of-use pricing, grid interaction
Citation: Wang X, Yan A, Li Z and Zhao Y (2022) Research on method of demand-side participating in grid interaction based on time-of-use pricing and coupon guidance. Front. Energy Res. 10:968567. doi: 10.3389/fenrg.2022.968567
Received: 14 June 2022; Accepted: 06 July 2022;
Published: 17 August 2022.
Edited by:
Ning Zhang, University of Windsor, CanadaReviewed by:
Nantian Huang, Northeast Electric Power University, ChinaTao Yang, Fuzhou University, China
Copyright © 2022 Wang, Yan, Li and Zhao. This is an open-access article distributed under the terms of the Creative Commons Attribution License (CC BY). The use, distribution or reproduction in other forums is permitted, provided the original author(s) and the copyright owner(s) are credited and that the original publication in this journal is cited, in accordance with accepted academic practice. No use, distribution or reproduction is permitted which does not comply with these terms.
*Correspondence: Aiyun Yan, eWFuYWl5dW5AaXNlLm5ldS5lZHUuY24=