 YiFan Liang
 QianChao Liang
 JianFeng Zhao
- Naval University of Engineering, Wuhan, China
In high-powered application scenarios, a multi-stack fuel cell system (MFCS) could have advantages such as higher robustness, lifetime, and reliability than a single-stack fuel cell system. In particular, MFCS could maintain a high efficiency and increase system redundancy by power configuration between subsystems. In order to reduce the operational expenses for systems, a reasonable power management strategy is necessary to minimize the hydrogen consumption of MFCS. First, the power-hydrogen consumption curve of the single-stack fuel cell system is discretized from experimental measurements. Next, the discrete data are reassembled by the inverse derivation of the dynamic programming method to produce a minimum solution for the hydrogen consumption in the output power range. It is found that the strategy varies depending on activated state On or Off. Finally, two power allocation strategies are developed and modeled in a lookup-table block considering the activated state. The optimal stack output power strategy is analyzed with four stacks. The results indicate that the hydrogen consumption is smaller and more efficient than the other allocation strategies. It can respond to the load demand with a high efficiency sooner than the average strategy.
1 Introduction
Hydrogen fuel cell systems are an attractive long-term option for the environment because of their zero-emission and high efficiency. As the electricity demand has increased, fuel cells have gradually tended to be high-powered and large-sized. However, this also means that fuel cells require higher power compressors and other auxiliary facilities, leading to higher fuel cell costs. Moreover, with the current technology development, it is challenging to realize high-power single-stack fuel cells for large load structures such as trams and microgrids. With this background, multi-stack fuel cell structures are gradually coming into view (Marx et al., 2014).
The optimal efficiency range of single stack fuel cells is 40–45%, but it is difficult to maintain due to load power fluctuation. To keep the system in the high-efficiency region, increasing the number of fuel cell systems and fitting with a power allocation strategy improve Proton exchange membrane fuel cell (PEMFC) degree of freedom (Garcia et al., 2014). Under the same working condition and fuel utilization rate, the PEMFC system with a multi-stack structure can improve fuel utilization and the system efficiency (Pirasaci, 2019).
After research, the parallel structure is more suitable for multi-stack fuel cell systems. Benefiting from the parallel structure, a degradation operation can exclude the faulty stack from the multi-fuel cell system (MFC system). The stack is replaced when a stack fails (Becherif et al., 2015). The multi-stack association appears as a natural and necessary alternative for developing high-power fuel cell systems. Bernardinis (De Bernardinis et al., 2008) proposed a solution for the parallel structure of two (or more) fuel cell stacks: parallel and series electrical coupling through power converters for fuel cell systems. Numerical simulations of the assembled dual-stack PEMFC demonstrate exemplary performance. Both research and experimental validation prove the technical feasibility of the dual-stack PEMFC parallel architecture.
The power allocation for the MFC system focuses on performance consistency, efficiency, hydrogen consumption, and costs. In particular, the cost will focus on determining the efficiency of MSFC solutions. The industry will welcome MFC systems if the expenses are solved (Marx et al., 2014).
Wang (Wang et al., 2020) believe that the degradation rate of poor-performance stacks is faster and affects the performance of MFCS systems. The degree of performance degradation (DOPD) adopts a semi-empirical model to evaluate the effect of aging on stacks. Subsequently, an adaptive current distribution method is proposed considering FC performance consistency implemented with instantaneous virtual resistance calculation and the virtual sag technique of
Zhang (Zhang et al., 2021) proposed an improved overall efficiency maximization strategy (I-OEMS), which predicts the load variation and controls the output power of the subsystem in a gentle loading manner, ensures that the system efficiency is close to optimal and reduces hydrogen consumption, and improves loading conditions to protect the stack. Francisco (Lopes et al., 2016) used NARX and NOE neural network modeling to predict stack performance. The controller is designed with efficiency maximization for the power allocation strategy. The model still performs better against lower currents with nonlinear ranges and peaks. Marx (Marx et al., 2018) analyzed the nonlinear programming by the KKT (Karush–Kuhn–Tucker) approach, which obtained an analytic solution to MFC system efficiency. Also, it provides a simple and effective solution to power allocation. Compared with average and daisy-chain strategies, better results than the existing strategies are obtained. Zhou (Zhou et al., 2022a) investigates a two-stack optimization problem with an efficiency and remaining useful life (RUL) factor-based power allocation. A heavy vehicle with a full load of 40t has experimented with the results of optimal configuration with three to five stacks. Compared with single FCS, MFCS has more efficiency and longer RUL as the number of MFCS stacks increases. Fernandez (Fernandez et al., 2019) updated the real-time ME (maximum efficiency) and MP (maximum power) of each sub-stack through a multi-physics model integrated with a semi-empirical model using as few sub-stacks as possible to satisfy loading power. Three scenarios measure the method, and it was found to be more efficient and less hydrogen-consuming than the average and daisy-chain strategy. Han (Han et al., 2017) separated the MFC system into main and sub-stacks, controlling the auxiliary stack On and Off by determining the threshold value after an efficiency optimization allocation strategy. The proposed efficiency and transient optimization strategies can significantly reduce fuel consumption and keep the output power of both stacks in the high-efficiency operating region. Bouisalmane (Bouisalmane et al., 2021) developed a power allocation strategy utilizing a particle swarm intelligence algorithm (PSO). Experiments were conducted with two output powers in 25–280W and 25–320W, and the results showed that the proposed method has the best performance in reducing hydrogen consumption. Macias (Macias et al., 2018) used a semi-empirical model combined with the ARLS algorithm, introduced adaptive parameters to realize online control of the MFC system, and solved online the maximum power and optimal efficiency of each fuel cell. The required power, MP, and ME points of each PEMFC are used as input to determine the output power of each PEMFC. Wang (Wang et al., 2019b) utilizes forgetting factor recursive least squares (FFRLS) to control minimum hydrogen consumption in a dual-stack system online. Reducing the effect of initial data on recursion by adding forgetting factors is validated by building a two-stack fuel cell system.
Calderon (Calderón et al., 2020) proposes a generalized state space model for MFC systems, where the power allocation is based on the degree of stack degradation, combined with an MPC controller for reducing the system degradation. Jian (Jian and Wang, 2022) presents a fuel cell electric vehicle (FCEV) power system model to MFC systems to increase system redundancy. A rule-based energy management strategy (REMS) is proposed to enable the MFC system to operate in an efficient region. Li (Li et al., 2021) proposed that an increment-oriented power distribution strategy to achieve the online collaborative performance enhancement between fuel economy and durability for the parallel multi-stack architecture. Andujar’s (Andújar et al., 2022) MFCS-based solution built with an air-cooled multi-stack fuel cell (ACFC) provides greater flexibility, robustness, and resilience to hydrogen systems at a lower cost and also allows the power to be adjusted to the power required by the microgrid. Zhou (Zhou et al., 2022b) made a decision model of MFCS stack allocation, and the related power management for the application of heavy-duty commercial vehicles is established with an integrated optimization index of efficiency and RUL and co-solved by iterative and heuristic algorithms.
In summary, most of the existing algorithms have the following disadvantages: 1) strategies based on metaheuristic algorithms may fall into local optimal, 2) most power allocation strategies have not considered the differences in power stack characteristics within a multi-stack system, and 3) most power allocation strategies were comparable with average and Daisy chain, but without comparison between optimization strategies. In this article, we aim to find the optimal solution under minimum hydrogen consumption conditions.
Many scholars have adopted the DP algorithm to solve the discrete problem of energy management (Cardozo, 2015; Cheng et al., 2015; Zhang and Xiong, 2015; Liu et al., 2017), which finds the optimal one after comparing all possible suboptimal solutions by traversal. In this study, the single-stack fuel cell power-hydrogen consumption curve is discretized. The final model is a lookup table of power-single stack power, computed by the DP algorithm to find the power strategy for the minimum hydrogen consumption. The resulting power allocation strategy is expressed as starting with a few power stacks to satisfy the power demand, consistent with (Marx et al., 2017). This strategy avoids excessive auxiliary losses and delays the stacks’ degradation. MFCS allocation is through online interpolation and search.
2 Multi-stack fuel cell system model
In this article, the MFC system was designed based on the T-1000 PEMFC system from Troowin company, which has a cooling system and anode oxygen consisting of an airflow generated by a fan to the side of the stack. The FC-related parameters are shown in Table 1.
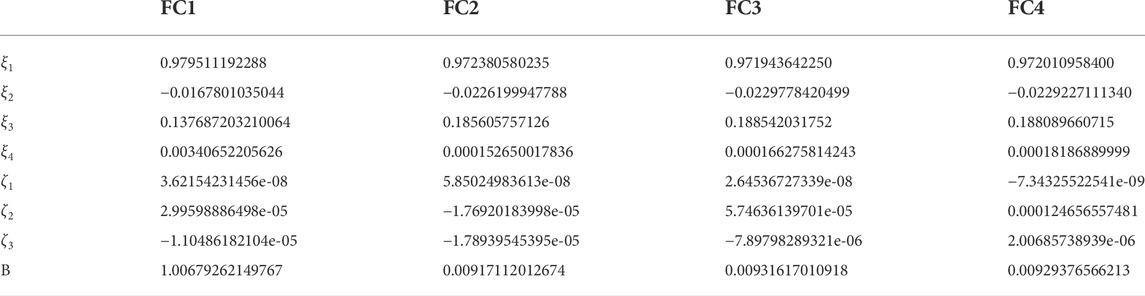
TABLE 1. Parameters for model calibration.
Figure 1 shows four stacks’ experimental values. FCs have different peak powers due to different degradations, as shown in Figure 1A. The hydrogen consumption curve of each stack is fundamental to search for the optimal power combination under minimum hydrogen consumption, as shown in Figure 1B.
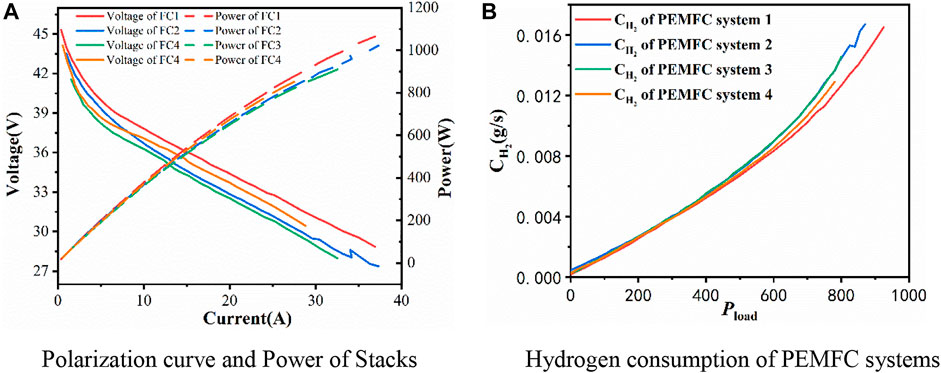
FIGURE 1. PEMFC characteristic curve on experiment data. (A) Polarization curve and power of stacks. (B) Hydrogen consumption of PEMFC systems.
The MFC system’s conception is parallel. Fuel cells connect to the bus through a DC/DC converter, which then connects to the load. The MFC system power allocation strategy regulates the output power of each subsystem through the DC/DC converter.
2.1 PEMFC system model
Under the normal operating conditions, the output voltage of the fuel cell is less than the theoretical Nernst voltage
where N is the number of cells,
where
2.2 Polarization loss
2.2.1 Activation loss
Activation loss indicates the slowness of the electrochemical reactions on the electrode surface, which is the function of temperature and current. Also, it is divided into temperature-dependent activation loss (Vacc1) and current and temperature-dependent activation loss (Vacc2) based on (Cheng et al., 2015).
where
2.2.2 Ohmic loss
Ohmic loss includes the resistance of the film resistance, the conductive resistance between the film and electrode, and the electrode resistance (Kristianda, 2018). The Ohmic loss is expressed by
where
2.2.3 Concentration loss
Concentration loss
The differential concentration among main gas and reactant concentrations on the electrode catalytic active surface (Musio et al., 2011b; Kristianda, 2018), expressed by
where B is empirical, J indicates the current density (
where
2.3 DC/DC convert
The fuel cell output characteristic is soft, which shows that the voltage decreases gradually when the output power increases. A DC/DC convert is adopted to fix the voltage. The fuel cell output power indirectly controls the output voltage and current of the DC/DC converter. The control strategy is based on De Bernardinis et al., 2008; Becherif et al., 2015; Abuzant et al., 2017.
This study uses DC/DC converters in parallel architecture as power converters, as shown in Figure 2. This architecture makes the overall system more flexible and enables individual control of each fuel cell stack for energy management. In power calculations, the boost DC/DC converter is treated as a constant efficiency expression, as follows:
where
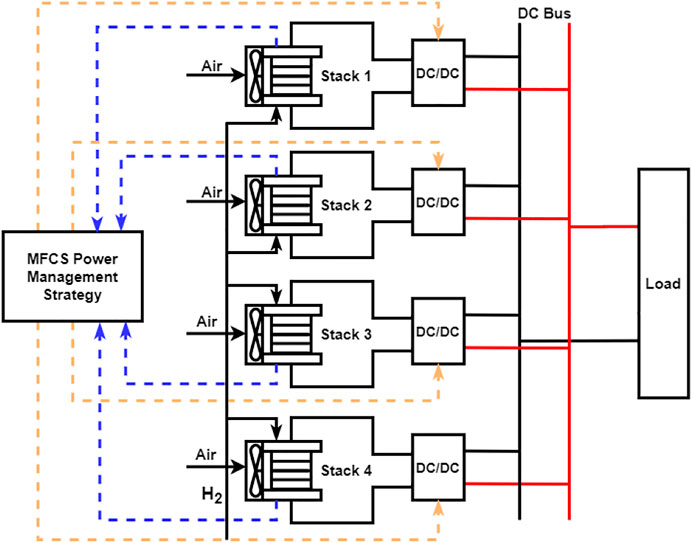
FIGURE 2. MSFCS architecture.
3 MFC system characterization
3.1 Single-stack system characterization
The efficiency of the PEMFC stack is given by Eq. 12:
3.2 MFC system hydrogen consumption and efficiency
Eq. 14 extends to a multi-stack with the following expression:
The efficiency of the dual-stack fuel cell system is shown in Eq. 15
4 Discrete optimal strategy
After discretizing all fuel cell subsystems of load-hydrogen consumption, the DP algorithm is applied to get the power allocation matrix under the same load conditions, consisting of each subsystem’s power and the hydrogen consumption. The DP algorithm avoids being trapped in the optimal local solution and is combined with the lookup table in Simulink to implement online interpolation for strategies. For the MFC system power allocation strategy, the hydrogen consumption of the MFC system, which is taken as a state variable, the hydrogen consumption–power curve is divided into steps of 0.5W, as shown in Figure 3.
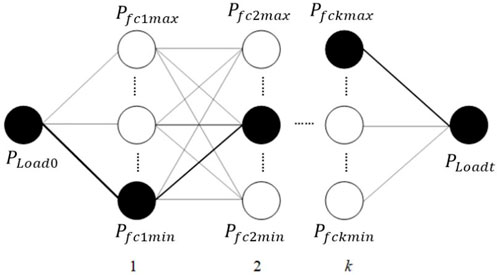
FIGURE 3. Dynamic programming algorithm.
The subproblem after splitting cannot form a square array similar to Yan et al., 2020 due to different degradation degrees in fuel cells. The constraints for the power and hydrogen consumption shown below should be satisfied.
where
Subsystems have two states: On and Off. The state On represents that the stack is activated, and the hydrogen consumption at power output and the auxiliary consumption is also considered, especially at
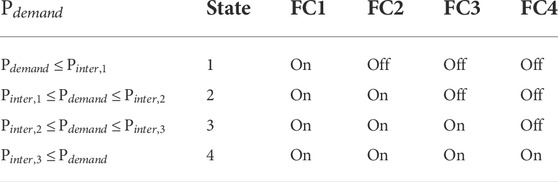
TABLE 2. State machine control strategy.
There exist critical points
Finally, the power allocation strategy is shown in Figure 4. The MFC system consists of four fuel cells with 1 kW rated power. However, the maximum power presented is not the same due to individual stacks’ degradation. The load power starts at 0W in steps of 10W and gradually increases to the peak (3470W).
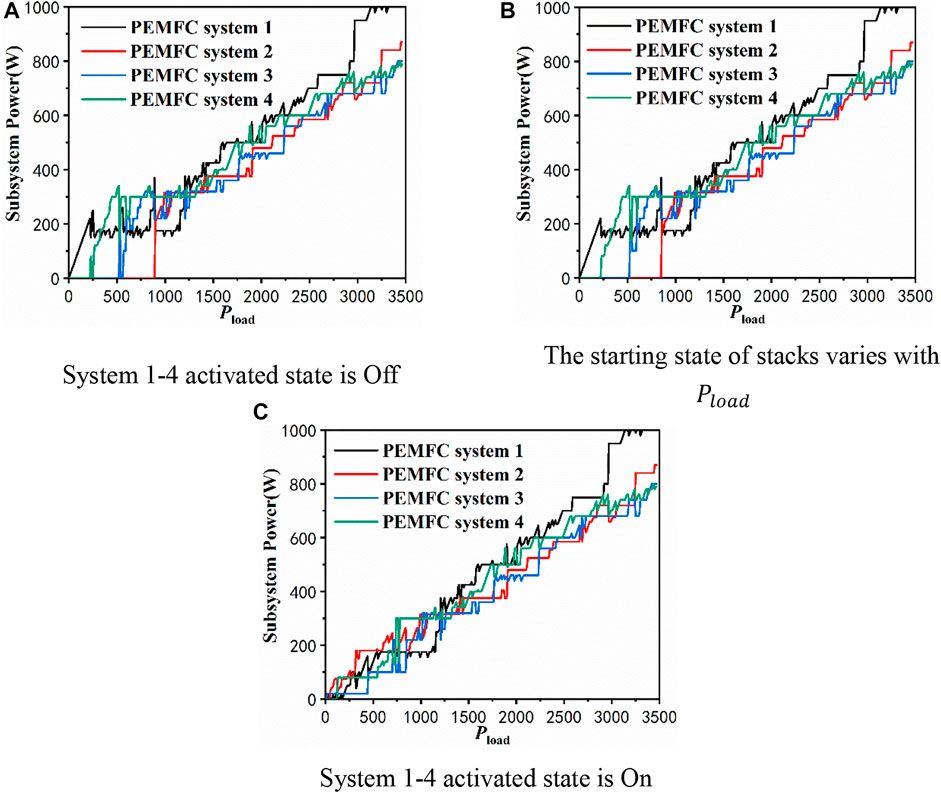
FIGURE 4. MFCS power allocation strategy. (A) Activated state of systems 1–4 is Off. (B) Starting state of stacks varies with
Figure 4A shows that for all subsystems, the activated state is Off. The power allocation strategy reallocates power with the start of the subsystem at 10W, 860W, 230W, and 530W, as shown in Figure 4B. Although the peak power of FC2 is higher than that of FC3 and FC4, characteristics are better for FC3 and FC4 in the low output range than for FC2. The activation loss transforms to concentration loss, and the output power of FC2 gradually exceeds that of FC3 and FC4, with the load increasing. Figure 4C shows that all subsystems start in the standby state after one start-up. Contrary to other essays, the MFC power distribution curve is not smooth by DP programming. It is attributed to the inverse derivation process of dynamic programming considering hydrogen consumption combinations for the optimal value.
5 The fault state
This approach also allows searching for the optimal power allocation solution when the power stack is faulty, enumerating all the situations with fault and reperforming power allocation of the MFC system with degradation. Stack No.4 is assumed to fail, as shown in Figure 5.
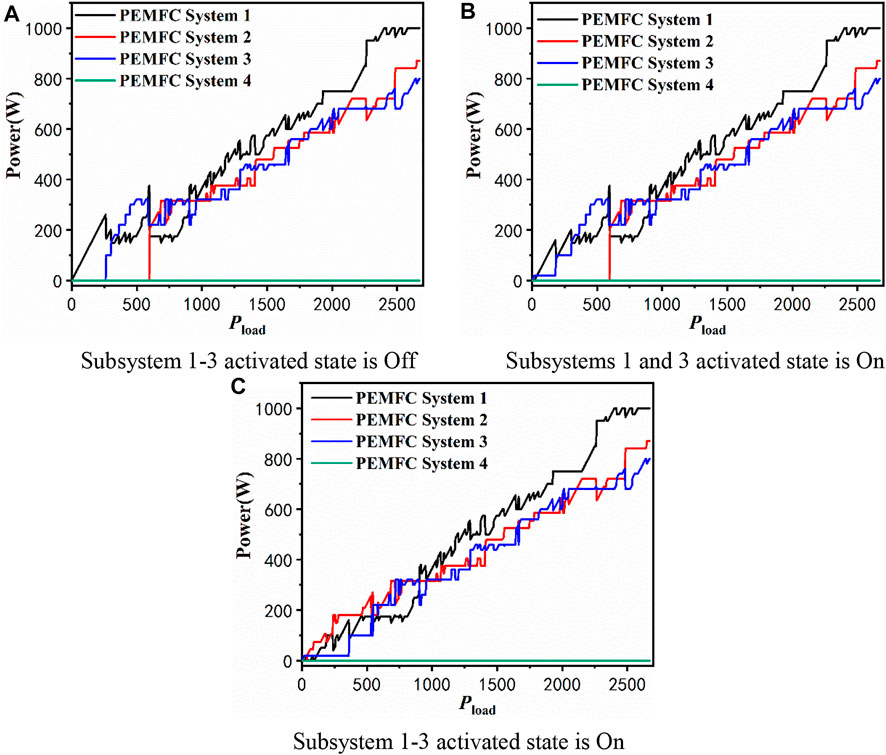
FIGURE 5. Power allocation strategy with FC4 fault. (A) Activated state of subsystems 1–3 is Off. (B) Activated state of subsystems 1 and 3 is On. (C) Activated state of subsystems 1–3 is On.
Figure 5 represents the degradation strategy with FC No.4 faults. The peak power decreases from 3470w to 2670w. The parameters of output power and hydrogen consumption are set to 0 for stack 4. Finally, the solution procedure in Section 4 is repeated for the three stack optimal power allocation strategies.
6 Simulation result and discussion
In this section, the proposed strategy is compared with the average and Daisy-chain strategies for hydrogen consumption and system efficiency and applied to the two load cycles for the three strategies to investigate the effect of activated state on power management. Finally, a shift in strategies for the MFC system occurs when one of the power stacks fails.
6.1 Power allocation strategy introduction
6.1.1 Average strategy
The distribution strategy is characterized by the same output power from subsystem fuel cells. It is expressed explicitly as
where k is the count of the FC subsystem and
6.1.2 Daisy chain
The distribution strategy is characterized when the maximum output power is reached in the first fuel cell subsystem, and the following stack will be activated until the entire system meets the output requirement.
6.1.3 Performance of different strategies
The MFC system has the lowest hydrogen consumption compared to the other two algorithms (average and Daisy chain) as shown in Figure 6A. Interestingly, the strategy mentioned in this study will achieve the maximum efficiency point earlier than the average and has the same maximum efficiency as the Daisy chain. It is not necessary to activate all stacks when degraded MFCS can satisfy the load power and reduce the additional loss of electronic auxiliaries the same as the Daisy chain. Second, this feature can facilitate the development of hybrid energy power allocation.
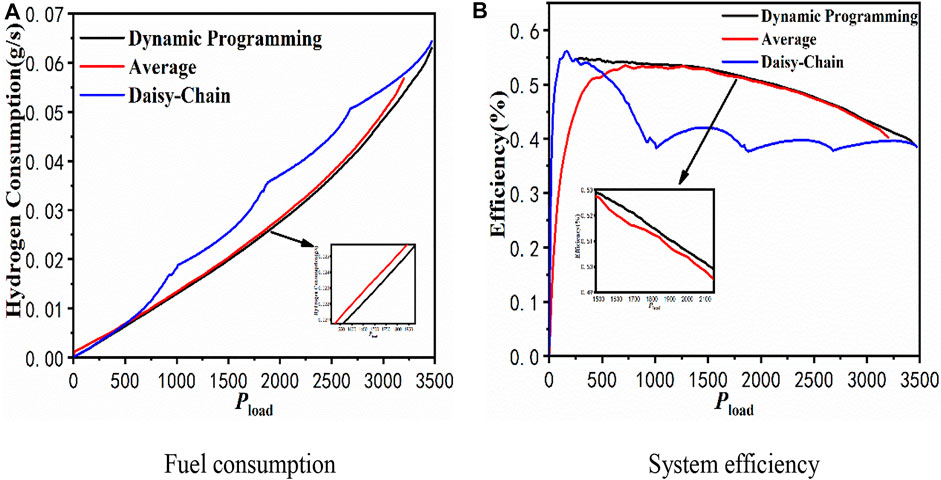
FIGURE 6. Comparision of different strategies. (A) Fuel consumption. (B) System efficiency.
6.2 Power distribution comparison
In this section, the load is running for 1,020 s in 10-s steps. The load is cycled twice to verify the effect of activated state for power allocation, as shown in Figure 7.
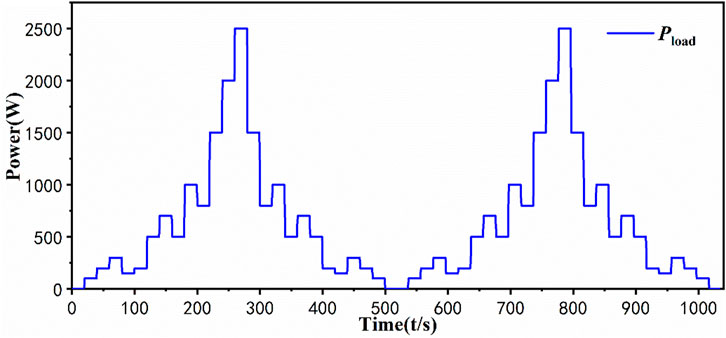
FIGURE 7. Demand power of the whole FCS.
Four sub-systems have the same power values everywhere in average strategy, as shown in Figure 8A. Notably, the average distribution strategy determines the peak power of the worst-performing stack. Therefore, the MFC system must change the maximum power from 3470 to 3200W in this paper. The power lost is not tolerated in the actual system. In the Daisy-chain strategy, the No.4 stack is static. The peak power of 2500W is less than the activation power of the fourth stack. However, FC1 and FC2 have reached their maximum capacity during this load response, as shown in Figure 8B.
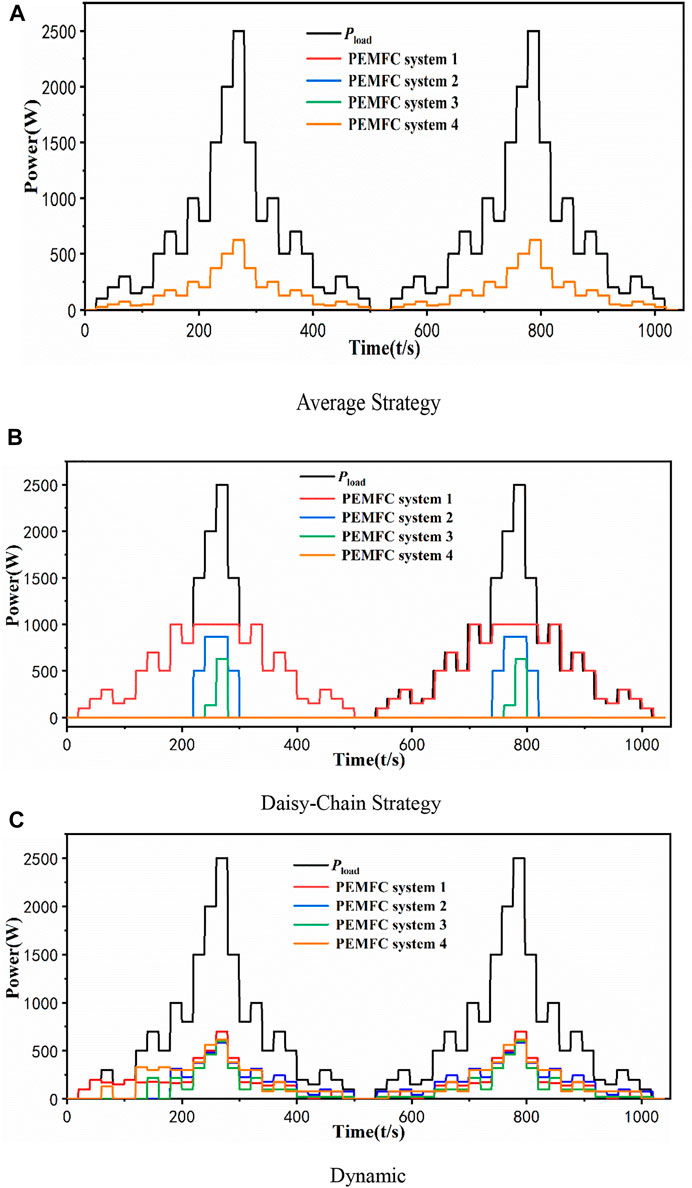
FIGURE 8. Power strategy Comparison. (A) Average strategy. (B) Daisy-chain strategy. (C) Dynamic.
The power allocation results for stages 1 and 2 are different, as shown in Figure 8C. Stacks 1–4 are activated at 22s, 181s, 60s, and 141s when the subsystem transforms to state On, followed by results in Section 3. During the transition from stage 1 to stage 2, the MFC system fuel consumption is not 0 when
A comparison of hydrogen consumption versus efficiency for the three strategies in the MFC system is shown in Figure 9. Interestingly, the Daisy-chain strategy has the fewest activated stacks, but its system hydrogen consumption is the most. Power consumption of the fan, controller, and other auxiliary components increases with increased
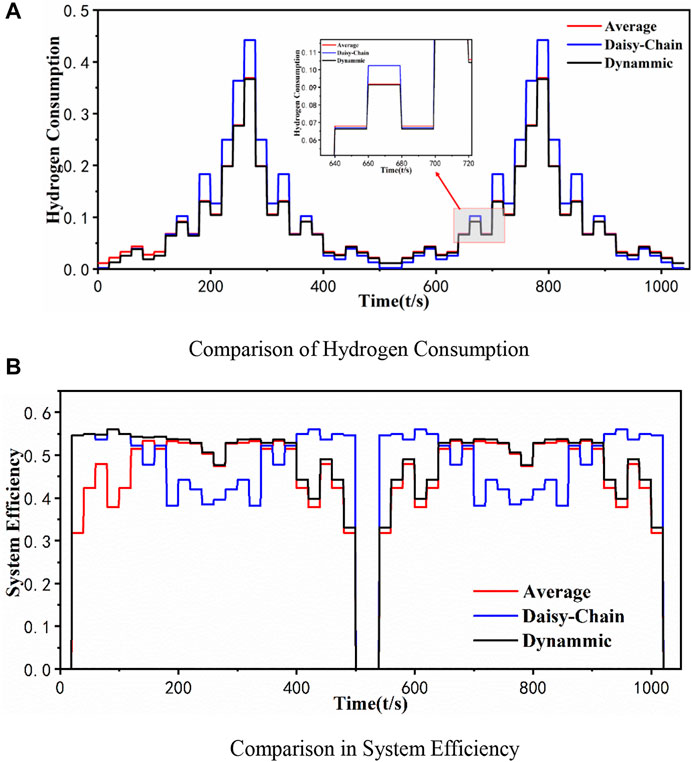
FIGURE 9. Comparison of different strategies. (A) Comparison of hydrogen consumption. (B) Comparison in system efficiency.
The hydrogen consumption and efficiency of the MFC system with strategies are shown in Table 3. The discrete optimization strategy has the best performance, saving 2.35% in hydrogen consumption, increasing the average efficiency by 2.3169% compared to the average strategy, reducing 12.4% in hydrogen consumption, and increasing the average efficiency by 0.51% compared to the Daisy-chain strategy. The Daisy chain has the same maximum efficiency as the discrete seeking strategy because the system corresponding to that point activates one stack with operational efficiency, which shows that the discrete seeking strategy adopts advantages of the Daisy-chain method.
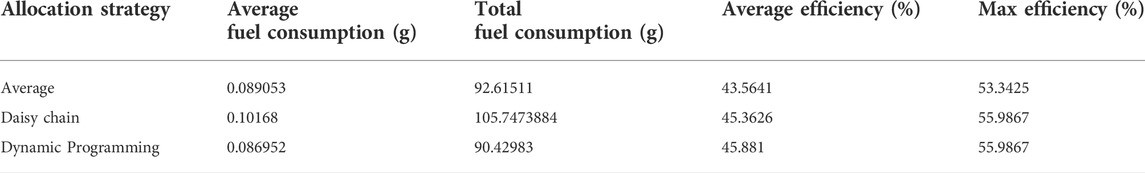
TABLE 3. Performance of different strategies.
6.3 Stack failure response analysis
It is assumed that the controller disconnects the failed stack and switches the power allocation strategy from four-stack to three-stack when one stack fails. This is represented in Simulink as a switchover for lookup-table modules.
The strategy proposed has a positive performance effect on system failure. According to the approach in Yan et al., 2020, assumed No.4 stack failed. The outcome of power allocation is a failure of the No.4 stack at various times, as shown in Figures 9, 10. In case 1, stack No.4 fails at MFC system start and has no operation, so
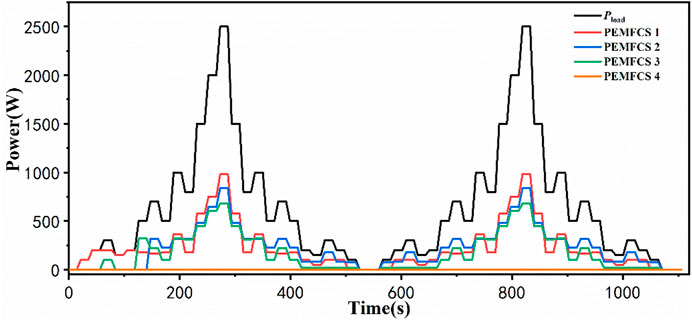
FIGURE 10. Stack No.4 with fails at the MFC system start.
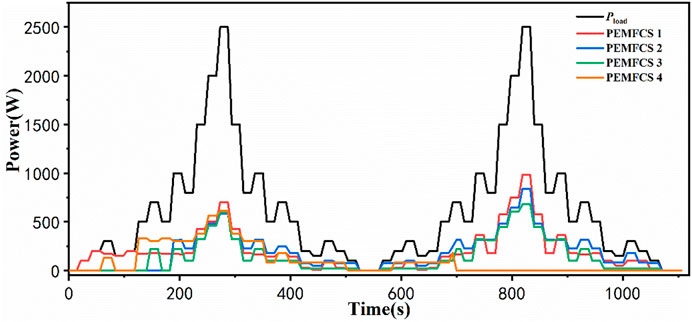
FIGURE 11. Stack No.4 with fails at the 200th second.
7 Conclusion
This study discretizes the load-hydrogen consumption curves of the single stack. It adopts the DP algorithm to obtain the power allocation strategy of MFCS with hydrogen consumption as the target in a backward derivation. It is found that the activated state of the single-stack system impacts the power allocation strategy because stacks do not respond to the load power when it starts up but still consume power when it has to maintain the controller and the fan operation, notably existing in water-cooled stacks. Therefore, two types of strategies are formed when the stack start-up state is considered in the study . Finally, the controller disconnects the failed fuel cell subsystem and then switches the power allocation strategy when one FC fails.
All the abovementioned operation processes are done in Simulink, and this MFC system is composed of four fuel cell subsystems, and the FC parameters are experimentally measured. The simulation results show that the power allocation strategy proposed in this paper has less hydrogen consumption than others, which is only 90.42983g, and the average efficiency is 45.881% and is the highest. The same maximum efficiency as the Daisy chain is available due to the avoidance of additional auxiliary losses by starting fewer fuel cell subsystems in the low power range.
However, this strategy cannot control MFCS online because FC decreases continuously with the operating time and frequent start-ups. This means that the FC’s maximum power and load–hydrogen consumption curve constantly evolve. Nevertheless, the power allocation strategy with the DP algorithm provides a reference for other methods as an optimal power allocation strategy.
Data availability statement
The datasets presented in this article are not readily available because the data are provided by the cooperative manufacturer and they are not convenient to upload. Requests to access the datasets should be directed to YL, YFanliang@yeah.net.
Author contributions
YL: methodology, software, validation, formal analysis, and writing the original draft. QL: review and supervision. JZ: conceptualization, resources, and writing–review and editing. JH: software, validation, and visualization.
Conflict of interest
The authors declare that the research was conducted in the absence of any commercial or financial relationships that could be construed as a potential conflict of interest.
Publisher’s note
All claims expressed in this article are solely those of the authors and do not necessarily represent those of their affiliated organizations or those of the publisher, the editors, and the reviewers. Any product that may be evaluated in this article or claim that may be made by its manufacturer is not guaranteed or endorsed by the publisher.
References
Abuzant, Sondos, Jemei, S., Hissel, D., Boulon, L., Agbossou, K., Gustin, F., et al. (2017). A review of multi-stack PEM fuel cell systems: Advantages, challenges and on-going applications in the industrial market. IEEE Veh. Power Propuls. Conf. (VPPC) 2017, 1–6. doi:10.1109/VPPC.2017.8330971
Andújar, J. M., Vivas, F. J., Segura, F., and Calderon, A. (2022). Integration of air-cooled multi-stack polymer electrolyte fuel cell systems into renewable microgrids. Int. J. Electr. Power & Energy Syst. 142, 108305. doi:10.1016/j.ijepes.2022.108305
Becherif, Mohamed, Claude, F., Hervier, T., and Boulon, L. (2015). Multi-stack fuel cells powering a vehicle. Energy procedia. 74, 308–319. doi:10.1016/j.egypro.2015.07.613
Bouisalmane, Noureddine, Gao, Fei, Levy, Michael, Paire, Damien, Doubabi, Saïd, Breaz, Elena, et al. (2021). Hydrogen consumption minimization with optimal power allocation of multi-stack fuel cell system using particle swarm optimization. IEEE Transp. Electrification Conf. Expo (ITEC) 2021, 154–160. doi:10.1109/ITEC51675.2021.9490111
Calderón, A. J., Vivas, F. J., Segura, F., and Andujar, J. M. (2020). Integration of a multi-stack fuel cell system in microgrids: A solution based on model predictive control. Energies 13 (18), 4924. doi:10.3390/en13184924
Cardozo, John (2015). “Comparison of multi-stack fuel cell system architectures for residential power generation applications including electrical vehicle charging,” in IEEE Vehicle Power and Propulsion Conference (VPPC), Montreal, QC, Canada, 19-22 October 2015 (IEEE).2015
Cheng, G., Hao, L., Chen, X., and Shaoming, Q. (2015). “Parameter design of the powertrain of fuel cell electric vehicle and the energy management strategy,” in 34th Chinese Control Conference (CCC), Hangzhou, China, 28-30 July 2015 (IEEE), 8027–8032.2015
De Bernardinis, A., Marion-Péra, M.-C., Garnier, J., and Hissel, D. (2008). Fuel cells multi-stack power architectures and experimental validation of 1 kW parallel twin stack PEFC generator based on high frequency magnetic coupling dedicated to on board power unit. Energy Convers. Manag. 49 (8), 2367–2383. doi:10.1016/j.enconman.2008.01.022
Fernandez, Alvaro Macias, Kandidayeni, M., Boulon, L., and Chaoui, H. (2019). An adaptive state machine based energy management strategy for a multi-stack fuel cell hybrid electric vehicle. IEEE Trans. Veh. Technol. 69 (1), 220–234. doi:10.1109/tvt.2019.2950558
Garcia, Jorge E., Sicard, P., Boulon, L., Vega, D. H., et al. (2014). Power sharing for efficiency optimisation into a multi fuel cell system. IEEE 23rd Int. Symposium Industrial Electron. (ISIE) 2014, 218–223. doi:10.1109/ISIE.2014.6864614
Han, Xu, Li, F., Zhang, T., Zhang, T., and Song, K. (2017). Economic energy management strategy design and simulation for a dual-stack fuel cell electric vehicle. Int. J. Hydrogen Energy 42 (16), 11584–11595. doi:10.1016/j.ijhydene.2017.01.085
Jian, B., and Wang, H. (2022). Hardware-in-the-loop real-time validation of fuel cell electric vehicle power system based on multi-stack fuel cell construction. J. Clean. Prod. 331, 129807. doi:10.1016/j.jclepro.2021.129807
Kristianda, Febrian (2018). Estimation of vector autoregressive model’s parameter using genetic algorithm. Int. Symposium Adv. Intelligent Inf. (SAIN) 2018, 72–77. doi:10.1109/SAIN.2018.8673382
Li, X., Shang, Z., Peng, F., Li, L., Zhao, Y., and Liu, Z. (2021). Increment-oriented online power distribution strategy for multi-stack proton exchange membrane fuel cell systems aimed at collaborative performance enhancement. J. Power Sources 512, 230512. doi:10.1016/j.jpowsour.2021.230512
Liu, Jichao, Chen, Y., Li, W., Shang, F., and Zhan, J. (2017). Hybrid-trip-model-based energy management of a PHEV with computation-optimized dynamic programming. IEEE Trans. Veh. Technol. 67 (1), 338–353. doi:10.1109/tvt.2017.2777852
Lopes, Da Costa, Boulon, Loic, Kelouwani, S., Agbossou, K., Marx, Neigel, Ettihir, Khalid, et al. (2016). Neural network modeling strategy applied to a multi-stack PEM fuel cell system. IEEE Transp. Electrification Conf. Expo (ITEC) 2016, 1–7. doi:10.1109/ITEC.2016.7520294
Macias, A., Kandidayeni, M., Boulon, L., and Chaoui, H. (2018). “A novel online energy management strategy for multi fuel cell systems,” in IEEE International Conference on Industrial Technology (ICIT), Lyon, France, 20-22 February 2018 (IEEE).2018
Marx, N., Cárdenas, D. C. T., Boulon, L., Gustin, F., and Hissel, D. (2014). “Degraded mode operation of multi-stack fuel cell systems,” in IEEE Vehicle Power and Propulsion Conference (VPPC), Coimbra, Portugal, 27-30 October 2014 (IEEE), 1–6. doi:10.1109/VPPC.2014.70070412014
Marx, Neigel, Boulon, L., Gustin, F., Hissel, D., and Agbossou, K. (2014). A review of multi-stack and modular fuel cell systems: Interests, application areas and on-going research activities. Int. J. Hydrogen Energy 39 (23), 12101–12111. doi:10.1016/j.ijhydene.2014.05.187
Marx, N., Hissel, D., Gustin, F., Boulon, L., and Agbossou, K. (2017). On the sizing and energy management of an hybrid multistack fuel cell – battery system for automotive applications[J]. Int. J. Hydrogen Energy 42, 1518–1526. doi:10.1016/j.ijhydene.2016.06.111
Marx, N., Hissel, D., Gustin, F., and Boulon, L. (2018). “On maximizing the steady-state efficiency of a multi-stack fuel cell system,” in IEEE Vehicle Power and Propulsion Conference (VPPC), Chicago, IL, USA, 27-30 August 2018 (IEEE), 1–6. doi:10.1109/VPPC.2018.8605036
Meng, Xiang, Li, Q., Huang, T., Wang, X., Zhang, G., and Chen, W. (2020). A distributed performance consensus control strategy of multistack PEMFC generation system for hydrogen EMU trains. IEEE Trans. Ind. Electron. 68 (9), 8207–8218. doi:10.1109/tie.2020.3016243
Musio, Fabio, Tacchi, F., Omati, L., Gallo Stampino, P., Dotelli, G., Limonta, S., et al. (2011). PEMFC system simulation in MATLAB-Simulink® environment. Int. J. Hydrogen Energy 36 (13), 8045–8052. doi:10.1016/j.ijhydene.2011.01.093
Musio, Fabio, Tacchi, F., Omati, L., Gallo Stampino, P., Dotelli, G., Limonta, S., et al. (2011). PEMFC system simulation in MATLAB-Simulink® environment. Int. J. Hydrogen Energy 36 (13), 8045–8052. doi:10.1016/j.ijhydene.2011.01.093
Pirasaci, Tolga (2019). Non-uniform, multi-stack solid oxide fuel cell (SOFC) system design for small system size and high efficiency. J. Power Sources 426, 135–142. doi:10.1016/j.jpowsour.2019.04.037
Salim, Reem, Nabag, M., Noura, H., and Fardoun, A. (2015). The parameter identification of the Nexa 1.2 kW PEMFC's model using particle swarm optimization. Renew. Energy 82, 26–34. doi:10.1016/j.renene.2014.10.012
Wang, T., Li, Q., Yin, L., and Chen, W. (2019). Hydrogen consumption minimization method based on the online identification for multi-stack PEMFCs system. Int. J. hydrogen energy 44 (11), 5074–5081. doi:10.1016/j.ijhydene.2018.09.181
Wang, Tianhong, Li, Q., Wang, X., Chen, W., Breaz, E., and Gao, F. (2020). A power allocation method for multistack PEMFC system considering fuel cell performance consistency. IEEE Trans. Ind. Appl. 56 (5), 5340–5351. doi:10.1109/tia.2020.3001254
Wang, Tianhong, Li, Q., Yang, H., Yin, L., Wang, X., Qiu, Y., et al. (2019). Adaptive current distribution method for parallel-connected PEMFC generation system considering performance consistency. Energy Convers. Manag. 196, 866–877. doi:10.1016/j.enconman.2019.06.048
Yan, Yu, Li, Q., Chen, W., Huang, W., Liu, J., and Liu, J. (2020). Online control and power coordination method for multistack fuel cells system based on optimal power allocation. IEEE Trans. Ind. Electron. 68 (9), 8158–8168. doi:10.1109/tie.2020.3016240
Zhang, Caizhi, Zeng, T., Wu, Q., Deng, C., Chan, S. H., and Liu, Z. (2021). Improved efficiency maximization strategy for vehicular dual-stack fuel cell system considering load state of sub-stacks through predictive soft-loading. Renew. Energy 179, 929–944. doi:10.1016/j.renene.2021.07.090
Zhang, Shuo, and Xiong, Rui (2015). Adaptive energy management of a plug-in hybrid electric vehicle based on driving pattern recognition and dynamic programming. Appl. Energy 155, 68–78. doi:10.1016/j.apenergy.2015.06.003
Zhou, S., Zhang, G., Fan, L., Gao, J., and Pei, F. (2022). Scenario-oriented stacks allocation optimization for multi-stack fuel cell systems. Appl. Energy 308, 118328. doi:10.1016/j.apenergy.2021.118328
Keywords: MFC system, dynamic programming, discrete, minimum hydrogen consumption, power allocation
Citation: Liang Y, Liang Q, Zhao J and He J (2022) Minimum hydrogen consumption power allocation strategy for the multi-stack fuel cell (MFC) system based on a discrete approach. Front. Energy Res. 10:966852. doi: 10.3389/fenrg.2022.966852
Received: 11 June 2022; Accepted: 04 August 2022;
Published: 07 September 2022.
Edited by:
Jinliang Yuan, Ningbo University, ChinaReviewed by:
Linfei Yin, Guangxi University, ChinaJingbo Wang, Kunming University of Science and Technology, China
Copyright © 2022 Liang, Liang, Zhao and He. This is an open-access article distributed under the terms of the Creative Commons Attribution License (CC BY). The use, distribution or reproduction in other forums is permitted, provided the original author(s) and the copyright owner(s) are credited and that the original publication in this journal is cited, in accordance with accepted academic practice. No use, distribution or reproduction is permitted which does not comply with these terms.
*Correspondence: JianFeng Zhao, amlhbmZlbmc2MjMwMF96aGFvQDE2My5jb20=