 Jiwon Mun
 Hyeong-Jin Kim
 Ho Jin Ryu
94% of researchers rate our articles as excellent or good
Learn more about the work of our research integrity team to safeguard the quality of each article we publish.
Find out more
ORIGINAL RESEARCH article
Front. Energy Res., 30 September 2022
Sec. Nuclear Energy
Volume 10 - 2022 | https://doi.org/10.3389/fenrg.2022.965319
This article is part of the Research TopicExperimental and Numerical Studies on Liquid Metal Cooled Fast ReactorsView all 17 articles
An innovative ultra-long-life lead-bismuth eutectic (LBE)-cooled fast reactor called MicroURANUS has been designed to prevent severe accidents. It utilizes the remarkable natural circulation capability of the LBE coolant. Furthermore, it can be operated at 60 MWth without refueling for 30 effective full-power years (EFPY). In this study, the thermal and mechanical performance of the highest linear power rod of MicroURANUS was evaluated by modifying the fuel performance code FRAPCON-4.0, which is the normal operation fuel performance code for light water reactors (LWRs). A plutonium generation model was added to consider changes in the physical properties of the UO2 fuel. Furthermore, mechanical and oxidation models of 15–15Ti were added, and the coolant models were modified for liquid metal. According to the unique design of MicroURANUS, a maximum low linear power density of 12.5 kW/m ensures that the highest linear power rod can operate below the safety limit. A low fuel temperature provides a large safety margin for fuel melting, as well as low-pressure build-up fission gas release. In addition, low inlet and outlet coolant temperatures of 250 and 350°C cause the cladding to display a low degree of swelling (a maximum diametral strain of 1.5%) while maintaining high mechanical integrity with negligible cumulative damage fraction (CDF). The modified fuel performance code for lead-cooled fast reactors exhibited the capability to be utilized for fuel performance evaluation and design feedback of MicroURANUS.
The importance of the northern sea route (NSR) for international trade and energy supply stability is increasing. For ships to navigate through the NSR, it is necessary to construct an icebreaker capable of crushing ice thicker than 5 m. Diesel icebreakers have difficulty breaking the ice with a thickness of over 2 m. In addition, these generate fine dust, which causes air pollution. The ships registered with International Maritime Organization (IMO) are required to reduce the sulfur content of diesel fuel to less than 0.5% by 2020 and to reduce CO2 by 40 and 50% by 2030 and 2050, respectively, compared with 2008 (IMO, 2018). Although LNG-propelled ships have lower sulfide emissions than diesel ships, the problem of high methane emissions exists (Stern, 2020). Therefore, nuclear-propelled ships are a good alternative to fossil-fueled marine ships because they have high energy density and no greenhouse gas emissions. Furthermore, the industry has considerable experience in operating nuclear-powered submarines and aircraft carriers worldwide. Icebreakers that utilize propellant systems such as KLT-40s light water reactors (LWRs) are being developed and operated in Russia. In the case of a pressurized water reactor (PWR) that uses low enriched uranium (LEU), fuel replacement is essential after a maximum of 2.3 years (Afrikantov OKB Mechanical Engineering, 2013). This short refueling period requires a nuclear-only port facility and significantly increases the total life cycle cost of nuclear reactors. These, in turn, result in disadvantages in terms of ship economy and disposal of spent nuclear fuel.
To compensate for these shortcomings of LWR, research is being conducted to use fast reactors with remarkable fuel utilization as propulsion reactors. Among these, the lead-cooled fast reactor (LFR) is considered the most potential Generation-Ⅳ (GenⅣ) innovative reactor concept. A non-refueling ultra-long-life LFR called MicroURANUS is presently being developed in Korea as a nuclear propellant system for marine ships or icebreakers (Nguyen et al., 2021). MicroURANUS is a micro-reactor of 20 MWe. It can be operated for 30 effective full power years (EFPY), which is the full life of the nuclear reactor. This substantially reduces the risk of radioactive leakage in the event of an accident scenario and the problem of spent nuclear fuel. The fuel power density of MicroURANUS is four times lower than that of KLT-40s. In addition, the amount of heavy metal loaded initially is approximately 10 times higher. However, the fuel utilization is superior owing to the characteristic of the fast spectrum reactor. The average conversion ratio is 0.8. In addition, MicroURANUS is designed to operate for 30 EFPY, whereas KLT-40s can be operated for 2.3 years.
Three reference systems were adopted by LFR-provisional System Steering Committee (pSSC): ELFR, ALFRED (EU), BREST-OD-300 (Russia), and SSTAR (United States) (Alemberti et al., 2014). SCK-CEN (Belgium) developed FEMALE for evaluating the fuel performance of mixed oil fuel (MOX), particularly for LFR and ITU (Germany). In addition, they developed and validated the TRANSURANUS code for an application to the ALFRED reactor (Rozzia et al., 2012; Luzzi et al., 2014).
As a preliminary result of accident frequency evaluation through Probabilistic Safety Assessment (PSA), design base events such as Loss of Flow (LOF), Transient Over Power (TOP), Loss of Offsite Power (LOOP), and Loss of Heat Sink (LOHS) are considered Design Bases Accident (DBA), not Anticipated Operational Occurrences (AOOs). Therefore, in this reactor, the failure of minor equipment inside the reactor is defined as AOO, and it is expected that the transient thermal hydraulic phenomenon expected from AOO will have little negligible compared to the transient phenomenon caused by the described DBA and Beyond Design Bases Accident (BDBA). Therefore, the purpose of this study was to analyze the thermal and mechanical behavior of nuclear fuel during its full-life normal operation and evaluate its stability. For this purpose, the steady-state fuel performance code FRAPCON-4.0 was modified for a lead-bismuth-cooled reactor. The LFR fuel performance code was developed by altering the properties of the fuel, cladding, and coolant in the MicroURANUS reactor design. The thermal and mechanical performance of the nuclear fuel during steady-state operation for 30 years (the full life of the reactor) was evaluated using the developed LFR fuel performance code.
The normal operation fuel performance code for an LWR was modified through correlation alterations using FRAPCON-4.0. The objective was to develop an LFR fuel performance code applicable to the present fast reactor conditions. Fuel performance models such as the gap conductance model (GAPCON-2) and mechanical analysis model subroutine (FRACAS-1) are applied the same as FRAPCON-4.0 with some module changes to adapt to the conditions of MicroURANUS lead-cooled fast reactor (Beyer et al., 1975; Bohn, 1977). The modified material and material properties of LFR fuel performance code are summarized in Table 1. In addition, the correlations of the fuel and the cladding used in this study is summarized in Tables 2, 3, respectively. In this sector, a detailed explanation of updated modules was described.

TABLE 1. Material property correlation of 15-15Ti.
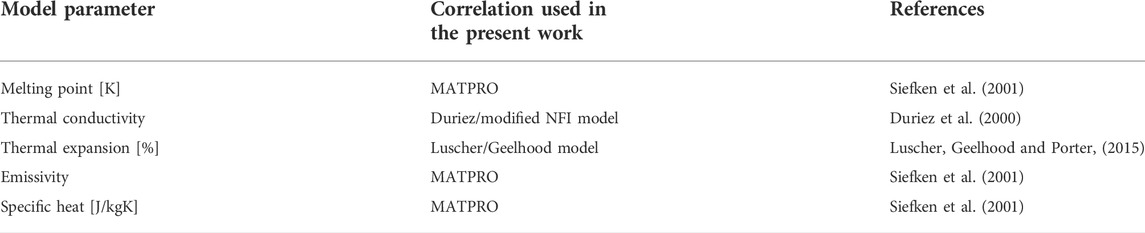
TABLE 2. Correlations adopted in fuel modeling.
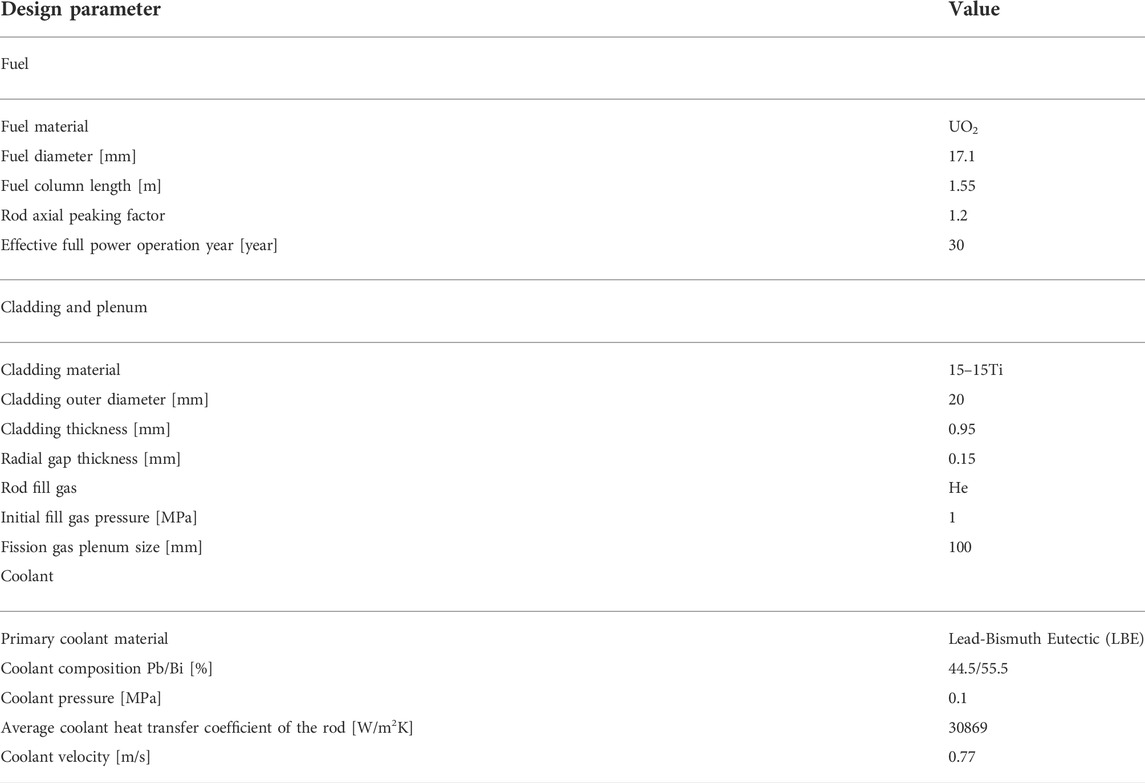
TABLE 3. Operation conditions of MicroURANUS.
The fission gas release (FGR) was calculated using the modified Forsberg–Massih model in FRAPCON-4.0 (Forsberg and Massih, 1985). Fission gas is released with a fraction F if the calculated surface gas area density N (atoms/m2) is larger than the saturation concentration Ns.
Equation 1 Forsberg–Massih fission gas release model
Ns = saturation concentration (atoms/m2)θ = dihedral half-angle = 50°KB = Boltzmann constant.γ = surface tension = 0.6 (J/m2)Vc = critical area coverage fraction = 0.25r = bubble radius = 0.5 (µm)F(θ) = 1–1.5 cos (θ) + 0.5 cos3 (θ)Pext = external pressure on bubbles = gas pressure (Pa)
In the case of the Forsberg–Massih model, when the temperature of the nuclear fuel is sufficiently high to allow interconnection among intergranular bubbles, it simulates the release when the opening pathway to release is created. Thus, this is a general thermal release process that assumes that fission gas is released from a high-temperature fuel. However, at a low temperature, athermal fission gas release which is owing to the recoil and knock-out of fission gas atoms is the dominant mechanism, and the Forsberg–Massih model predicts a release of less than 1–2%, whereas 4–5% FGR values have been measured at burn-ups of 60 GWd/MTU (Killeen, Turnbull and Sartori, 2007). Therefore, an empirical athermal release model was suggested that can predict fission gas release at relatively low temperatures (as stated in Equation 2) (Turnbull, 1996). If the temperature of the nuclear fuel is sufficiently low, the higher FLT value from the low-temperature model will be calculated than F from Forsberg–Massih model. In this case, the code was set to use the FLT value instead of the F.
Equation 2 Low-temperature fission gas release model
FLT = fission gas release fraction by low temperature model.BU = local burnup (GWd/tU)C = 0; for BU ≤ 40 GWd/tU.= 0.01(BU - 40)/10; (BU > 40 GWd/tU and F ≤ 0.05)
The amount of plutonium produced by breeding is larger than that produced by the LWR owing to the characteristic of the fast reactor fuel. The major fissile isotope is Pu-239. Furthermore, in the case of MicroURANUS, the production of approximately 465 kg during 30 EFPY was calculated in the core design process (as shown in Figure 1A) (Nguyen et al., 2021). Variations in the thermal conductivity, heat capacity, and thermal expansion of the fuel caused by plutonium generation were considered as variations during operation through the weight fraction and composition of Pu-239, Pu-240, and Pu-241. The properties that vary during operation owing to Pu generation include density, heat capacity, thermal expansion, enthalpy, modulus, and thermal conductivity.
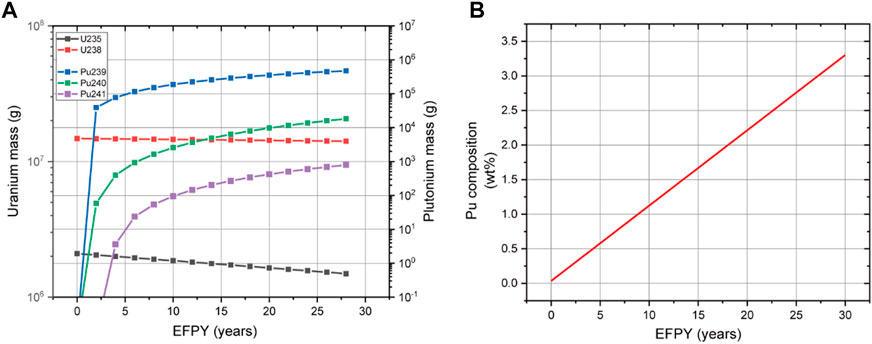
FIGURE 1. (A) Mass variation profiles of U and Pu isotopes and (B) composition profile of plutonium (Nguyen et al., 2021).
In addition to the fuel material properties, the influence of the variations in fuel irradiation behavior caused by plutonium generation was investigated. It is reported that a fission gas release enhancement effect occurs in the case of a MOX with 20 wt% plutonium (which is operated in a fast reactor) it is reported that there is a fission gas release enhancement effect owing to inhomogeneity caused by the segregation of PuO2 (Walker, Goll, and Matsumura, 1996). However, in the case of nuclear fuel operating at low power and temperature, the fission gas release enhancement effects owing to plutonium segregation are negligible, and the plutonium composition at the end of life of the current nuclear fuel is approximately 3 wt% (as shown in Figure 1B) (White et al., 2001). This is significantly low to be considered in the MicroURANUS case.
Plutonium generation also affects the radial flux inside the pellet because of the generation of the local fissile element Pu-239. In the LWR, owing to the self-shielding effect by resonance capture of the thermal neutron, it has a higher burnup and neutron flux at the edge part of the pellet. However, radial flux depression can be disregarded in fast reactors because of the low-resonance capture of neutrons (Guerin, 2012; Medvedev et al., 2018). A few studies were conducted to develop a new burn-up module for fast-reactor MOX fuel that considers the generation of minor actinide elements (MA) and helium from the decay of MA (Cechet et al., 2021). The plutonium generation is considerably marginal in the present design (a maximum of 3 wt%). Furthermore, the initial fuel form is UO2 rather than MOX. Therefore, a flat power profile was applied to the present code.
The most important life-limiting factor of cladding in the case of the fast reactor is irradiation-induced void swelling. Meanwhile, ferritic/martensitic stainless steel has been used widely in SFR because of the superior resistance to irradiation void swelling. However, when it is irradiated at a relatively low temperature (below approximately 400°C), it considerably affects the decrease in fracture resistance owing to irradiation embrittlement (Chen, 2013; Cabet et al., 2019). In addition, the ductile-to-brittle transition temperature (DBTT) of ferritic/martensitic stainless steel increases with irradiation at a low irradiation temperature. This could induce brittle fracture of cladding. Therefore, austenitic stainless steel cladding is used in the case of the present MicroURANUS core design because the inlet/outlet temperature is 250°C/350°C. This temperature is lower than the irradiation temperature of the existing fast reactor (approximately 500°C).
Conventional 304 and 316 grades were mainly used for austenitic stainless steel cladding, which is mainly used in SFR in the early stage of development. In addition, 304LN and 316 L(N) grades were applied gradually (these are low-carbon and nitrogen-controlled austenitic stainless steels) (Dai, Zheng, and Ding, 2021). This could suppress the decrease in corrosion resistance owing to grain boundary carbon precipitation and improve the mechanical strength owing to the high nitrogen content (Mathew, 2010; Ravi et al., 2012). In addition, swelling of cladding is the most crucial life-limiting factor in high burn-up and high neutron energy environments. Ti-stabilized austenitic stainless steels such as 316Ti and 15-15Ti have been developed to solve this problem (Maillard et al., 1994). These are swelling-resistant alloys. 15-15Ti shows a remarkable void swelling resistance of up to 130 dpa (Courcelle et al., 2016). Therefore, 15-15Ti steel was adopted as the cladding material because the peak cladding radiation damage attained approximately 120 dpa under the present reactor operating conditions. Luzzi et al. developed a “generalized 15-15Ti” model to fit the swelling data of several 15-15Ti steel groups in a conservative manner, and this model was used in this work (Luzzi et al., 2014). The irradiation swelling data of 15–25% cold worked 15–15Ti steels were used to establish the model (Hübner, 2000; Bergmann et al., 2003; Cheon et al., 2009; Dubuisson, 2013). The cladding correlations show the swelling correlation of 15-15Ti applied to this code (see Table 1). It has a peak value at 450°C. Furthermore, it increases exponentially with the increase in temperature and increases by a factor of 2.75 for fast fluence on cladding.
The corrosion of cladding in an LBE flow environment is also one of the highly important degradation mechanisms. The approximate coolant limit temperature is acknowledged to be 550°C (Li et al., 2017). In general, austenitic steels in lead-bismuth eutectic systems between 450 and 500°C oxidize with the formation of dual-layer porous magnetite (Fe3O4)/compact inner spinel layer for short-term operation (Müller, Schumacher and Zimmermann, 2000). However, it was verified that a uniform and protective Fe-Cr spinel single layer is formed in austenitic steel SS316L and 15–15Ti during long-term operation at a temperature below 450°C (Tsisar et al., 2016; Lee et al., 2021) Therefore, the single layer oxidation parabolic law of 15-15Ti was applied, and the parabolic rate constant and activation energy were calculated by fitting the literature data on long-term oxidation at 400°C, 450°C, and 550°C in flowing LBE (2 m/s) with 10–7 mass% of dissolved oxygen. (Tsisar et al., 2016). In addition, the existing ZrO2 thermal conductivity model was modified to the thermal conductivity of Fe–Cr spinel obtained from first-principle calculations (Liu et al., 2016).
Equation 3 Parabolic law and constants for 15-15Ti
The operating conditions of MicroURANUS are summarized in Table 4. The linear power of the rod of the MicroURANUS core was calculated based on a reactor physics study (Nguyen et al., 2021). The performance of the peak power rod was evaluated to consider the safety margin of this core from the operation limit, through thermal and mechanical calculations of the nuclear fuel rod. Figure 2 shows the average and peak linear heat rates of the peak power rod and the average burn-up of the rod. These were calculated using the LFR fuel performance code. The MCS calculation in the reactor physics study revealed that the local peak linear heat rates of the hottest assembly were 9.91, 11.24, and 12.50 at 0, 15, and 30 EFPY, respectively. In the actual core design, the top and bottom 25 cm of the fuel rod have different enrichment designs, called onion zoning. However, simple cosine-shaped axial zoning is considered for the present calculations to evaluate nuclear fuel performance. An average-to-peak power ratio of 1.2 was applied. The rod average linear heat rate was calculated to be approximately 8.26, 9.37, and 10.42 at 0, 15, and 30 EFPY, respectively. The rod average discharged burn-up was approximately 46 GWd/tU when operated for 30 EFPY. Figure 3 shows the linear heat rate as a function of the axial elevation location of the fuel rod during operation.
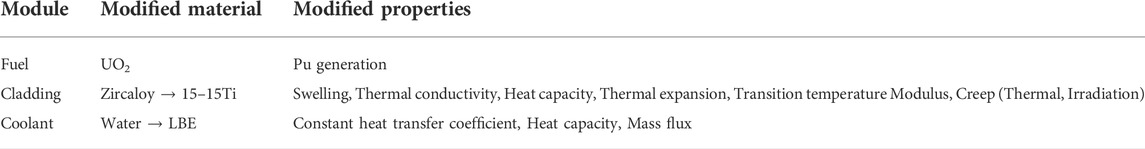
TABLE 4. Modified material and material properties in LFR fuel performance code.
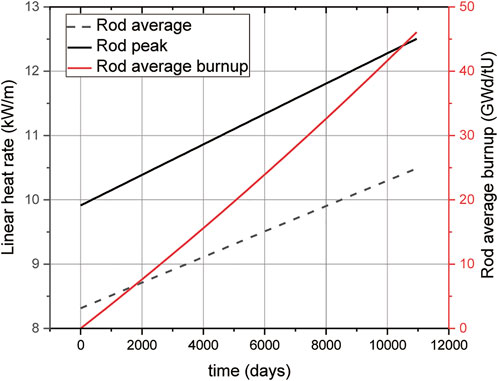
FIGURE 2. Average burn-up and linear heating rate profile of the rod.
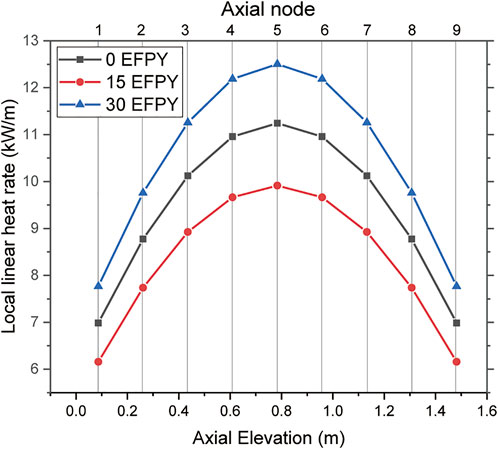
FIGURE 3. Axial peaking for fuel rod.
The flow velocity variation between assembly channels should be treated carefully for the hot channel analysis. However, in the case of the current reactor system called MicroURANUS, it is a conceptual design stage, and the reactor physics study was based on constant fluid velocity obtained from a one-dimensional thermal hydraulics code (Nguyen et al., 2021). Therefore, the preliminary fuel performance analysis was performed on the unit cell without considering detailed assembly and grid structure to consider the coolant assembly velocity variation. For this reason, the core averaged mass flow rate is used in the current stage which is the same value as the current study (see Table 4). In addition, the axial temperature distribution data was calculated based on an average bundle mass flow rate.
Figure 4 compares the temperature calculation results with the preliminary thermal-hydraulics analysis results obtained by MARS-LBE (Shin et al., 2017). Thermo-mechanical feedback of the material was not considered in the case of the RELAP5/MOD3 code and COBRA-TF used in the MARS code. The initial gap at cold zero power (CZP) was set to 150 μm in the MARS-LBE and LFR fuel performance codes in this study. However, in the case of the LFR fuel performance code, the thermo-mechanical response in both fuel and cladding owing to thermal expansion from CZP to hot zero power (HZP) was considered. The fuel surface and cladding inner radius displacements at the HZP were calculated to be approximately 60 and 110 μm, respectively. Consequently, the increase in the initial gap was approximately 200 μm at the beginning of life condition in the LFR fuel performance code. This is 50 μm larger than the initial inputted cold gap of 150 μm. Thereby, the LFR fuel performance code fuel rod temperature calculation result differed from the fuel centerline temperature (see Figure 4A). The fuel temperature was determined to be about 150 K higher in the case of the LFR fuel performance code. In the case of cladding and coolant temperatures, the MARS-LBE temperature was higher than the LFR fuel performance code results in Figures 4B,C. The differences among these codes exist mainly because of the 1) heat transfer coefficient models and the 2) calculation methods. 1) In MARS-LBE, convective heat transfer is obtained by calculating the convective heat transfer coefficient from Nu which is given by the function of Re and Pr. Seban-Shimazaki correlation is applied to obtain Nu in the MARS-LBE system (Seban and Shimazaki, 1949). Therefore, the heat transfer coefficient value is calculated and updated simultaneously according to the fuel rod axial position and temperature of the coolant using the Seban-Shimazaki correlation. Also, the MARS-LBE code considers mass, momentum, and flow condition change due to pressure loss by friction on the fluid flow model. However, in this work, the LFR fuel performance code was developed to verify that the reactor can be operated safely during steady-state operation from a nuclear fuel perspective through multiphysics modeling of fuel and cladding. Therefore, the characteristics of the fluid, which were considered in detail in the thermal-hydraulics code (MARS-LBE), were simplified in this work. In this work, the core-averaged constant heat transfer coefficient obtained by MARS-LBE was applied as stated in Table 4. In addition, the coolant temperature is calculated as an energy balance through a one-dimensional convection heat transfer coefficient without considering momentum change or friction. 2) In the MARS-LBE code, the temperature calculation proceeds from the initial geometry without considering the thermomechanical deformation of the fuel rod. On the other hand, in this work, heat flux emitted out of the rod due to the He gap size increase caused by the thermal expansion of the cladding. As mentioned, there is a slight difference in the temperature calculation results due to the heat exchange capability of coolant and the effect of the geometry difference caused by the difference in detailed calculation methods among these two codes. Therefore, although the inlet temperature was set to have the same value of 523 K, the coolant temperature was calculated to be relatively low to be a maximum of about 20 K in the LFR fuel performance code. Furthermore, a low coolant temperature causes the cladding temperature to be calculated low and the maximum difference was calculated to be about 40 K in the outlet region. If we consider the different characteristics between the two codes, the temperature results were slightly different. However, thermomechanical iterations and a series of interactions can provide a more realistic simulation to analyze fuel rod multiphysics behavior with acceptable coolant temperature difference with thermal-hydraulics code. In the case of fuel temperature, the maximum temperature of the fuel at a point slightly higher than the mid-region was identical in both code cases. In addition, it was confirmed that the cladding and coolant temperatures were well increased according to the axial elevation.
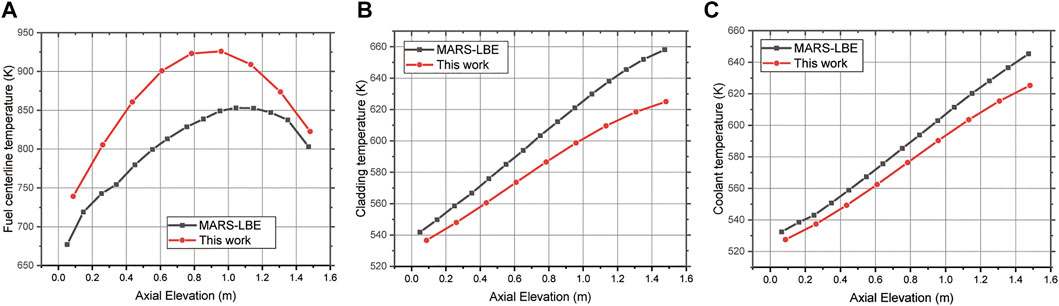
FIGURE 4. MARS-LBE code comparison results of (A) Fuel centerline temperature (B) Cladding average temperature (C) Coolant temperature.
Figure 5A illustrates in detail the calculation results for the axial profile of the variation in fuel centerline temperature during operation. Because cosine-shaped power peaking was applied axially, the highest temperatures were observed in axial regions 5 and 6. These were 0.8 and 1.0 m above the center of the nuclear fuel. The fuel temperature continued to increase from 0 EFPY to 15 EFPY and 30 EFPY at each axial region. Figure 5B shows the long-term behavior of nuclear fuel. It illustrates the evolution of the fuel centerline, surface temperature, and temperature of the inner and outer surfaces of the cladding in the fuel rod hottest region (i.e., axial region 6). The centerline temperature of nuclear fuel shows an increase of approximately 250 K during operation. This is because the linear heat rate continues to increase during operation (as shown in Figure 3) and because of the effect of the degradation of fuel thermal conductivity owing to irradiation. It was determined that these factors that increase the fuel temperature are more significant than the effect of the increase in gap conductance owing to the decrease in pellet cladding gap. The variations in gap width and the effect of gap conductance are analyzed in detail in a subsequent section.
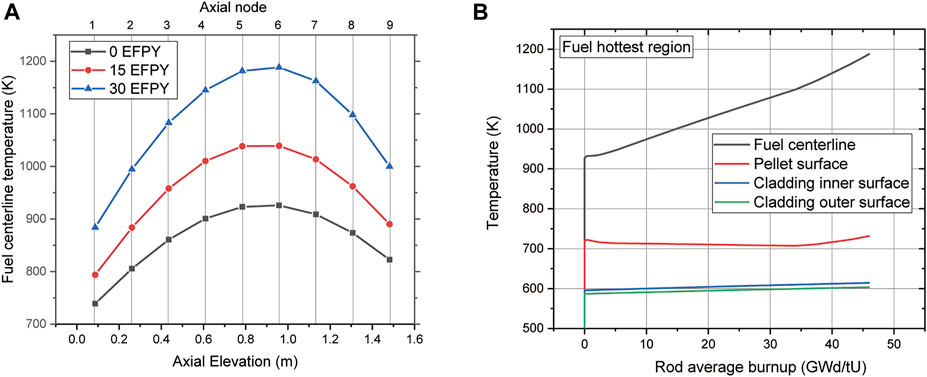
FIGURE 5. (A) Axial distribution of fuel centerline and (B) temperature evolution profile of the hottest axial region.
The calculated axial temperature distribution of the fuel rods at the end of life after the reactor was operated for 30 EFPY is shown in Figure 6. The temperature of the fuel was the highest at axial region 6 and was approximately 1200 K at 30 EFPY. Considering that the operating temperature of nuclear fuel in a conventional fast reactor is approximately 2000 K owing to the low linear power of the reactor in this study, the present calculation result is significantly low and ensures a thermal margin for fuel melting. In the case of the LBE coolant, the outlet temperature was approximately 623 K (an increase of 100 K) when the inlet temperature was set to 523 K. The maximum temperature of the cladding did not exceed 650 K. Therefore, it was operated at a lower temperature than that of the steel cladding of a conventional fast reactor, which is in the range of 700–800 K. Thus, stability can be secured by mechanisms that degrade material property, such as oxidation, creep, and swelling of cladding.
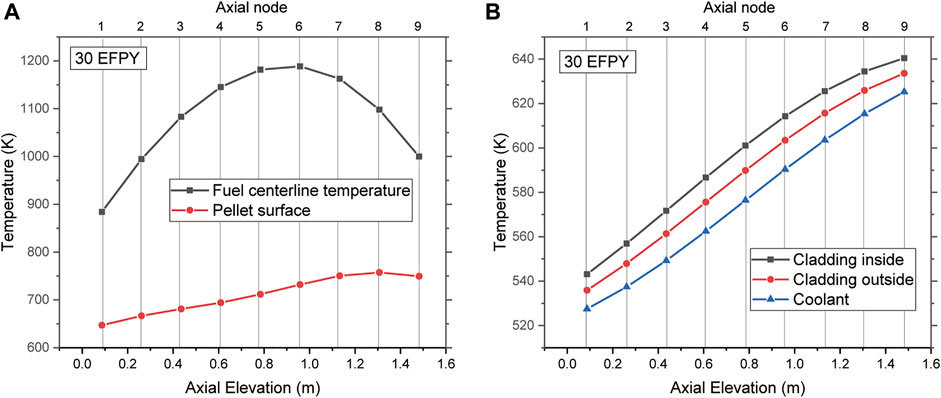
FIGURE 6. End-of-life Temperature of (A) fuel pellet and (B) cladding and coolant.
The fuel, cladding deformation, and gap size evolution are discussed in detail in this section. Figure 7A shows the fuel swelling at 30 EFPY. Because the axial peaking of the fuel rods was considered, the average rod burn-up at 30 EFPY operations was 46 GWd/tU, whereas the maximum nodal burnup was calculated to be approximately 55 GWd/tU at the center of the fuel rod. Therefore, because a linearly increasing fuel swelling model was used for burn-up (as stated in Equation 4), the deformation caused by swelling was observed with an identical tendency as the burn-up profile. The highest swelling at the center of the fuel rod was approximately 85 μm, and the volume fraction was determined to be a maximum of approximately 3.3 vol%. Figure 7B shows the fuel swelling at each axial node according to the average burn-up of the rod. At the early stage of operation, the fuel surface deformed inward owing to the densification effect (see Figure 8).
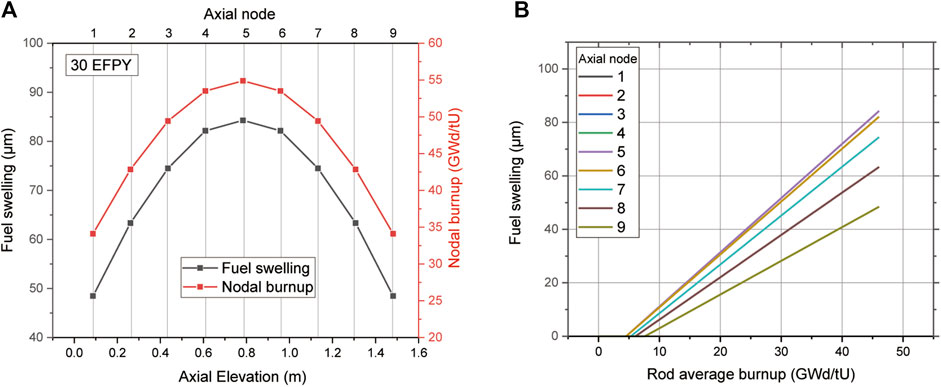
FIGURE 7. Fuel swelling (A) nodal burn-up relationship and (B) rod average burn-up profile.
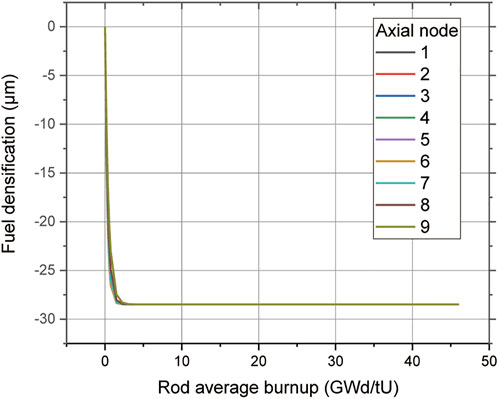
FIGURE 8. Fuel densification.
Equation 4 Fuel swelling model used in the present study (Luscher, Geelhood, and Porter, 2015)
solidswell = fractional volume fraction owing to solid fission product bus = fuel burn-up during time-step fdens = initial fuel density (kg/m3) bu, bul = burn-up at the end of the time-step, previous time-step (GWd/tU)
The hoop strain of the cladding increased during operation as explained in Figure 9A. Although the neutron damage was highest at the center of the fuel rod owing to the high fission rate, the cladding of the hottest region (which is axial region 9) was observed to have the largest hoop strain according to Figure 9B. Figure 10 describes the hoop strain components of the 15–15Ti cladding of the coldest and hottest axial regions. At zero power, the thermal strain component caused by thermal expansion from room temperature cold zero power to hot zero power in both the coldest and hottest cladding regions was calculated. Thereafter, a marginal increase in thermal strain was observed as the cladding temperature increased. The elastic mechanical strain components generated by the difference between rod inner pressure and coolant pressure were determined to be significantly low. In addition, because the temperature of the cladding was inadequate to induce creep deformation, the permanent deformation owing to creep was also determined to be insignificant. However, there was a significant difference in swelling strain between the coldest and hottest regions. As shown in Figure 10A, the temperature of the cladding in the coldest region was sufficiently low for the increase in swelling strain to be marginal. However, as can be observed in Figure 10B, the behavior of the hottest region was different from that of the coldest region. The swelling of 15–15Ti increases in proportion to the square of the temperature as it approaches 450°C. Therefore, the hottest cladding was determined to have a temperature sufficient for swelling to occur. Hence, the fast neutron fluence increment and temperature increment affect the swelling of the cladding during operation. The swelling deformation was the major component of the hottest cladding region. Furthermore, the hoop strain profile was consistent with the increasing tendency of swelling strain.
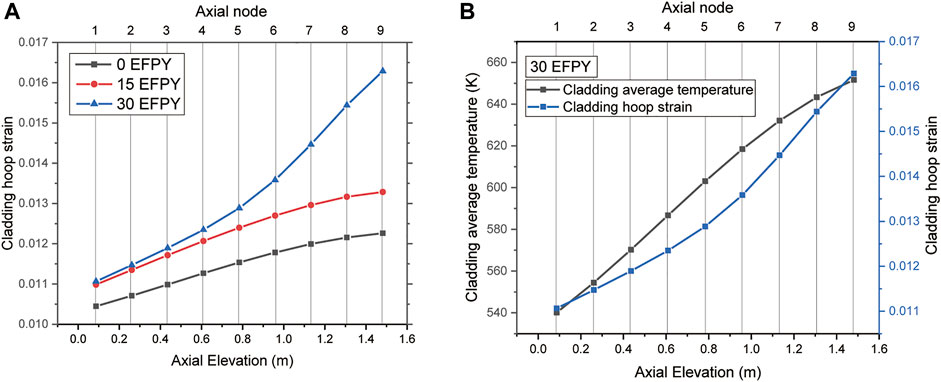
FIGURE 9. Cladding hoop strain (A) evolution profile and (B) temperature relationship at 30 EFPY.
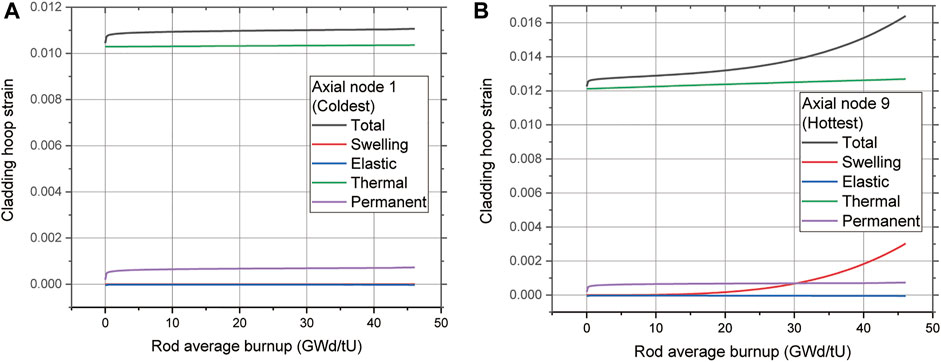
FIGURE 10. Cladding deformation mechanism of (A) coldest axial region and (B) hottest axial region.
Based on the calculated fuel and cladding deformations, the evolution of the gap size between fuel cladding during operation is shown in Figure 11. The initial gap size was calculated to be approximately 200–210 μm depending on the axial region owing to the zero-power initial thermal expansion. At the early stage of operation, the fuel-cladding gap increased temporarily owing to fuel densification. Thereafter, the fuel-cladding gap decreased gradually owing to fuel swelling (which increased linearly), although the cladding deformed outward. This calculation of gap size verified that MicroURANUS can mitigate the fuel cladding mechanical interaction (FCMI) caused by fuel-cladding contact with a cold gap of 150 μm (which is a key factor that causes fuel failure during its entire life). Thereby, it can ensure the safety of fuel rods.
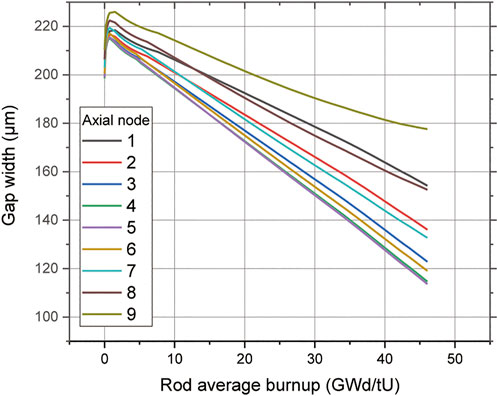
FIGURE 11. Profile of gap width evolution.
Figure 12A shows the fractional fission gas release of the peak power fuel rod of MicroURANUS and the corresponding plenum pressure calculated using the gap gas concentration and total void volume. The low-temperature fission gas release model was applied as described in Section 2.1. This was because the temperature of the fuel was low, wherefore the release fraction was evaluated as significantly low when the Forsberg–Massih model was used. Consequently, the release fraction increased linearly. In addition, the slope was determined to be steep when the local burnup exceeded 40 GWd/tU. It was determined that enhanced release was achieved when the rod average burn-up attained approximately 35 GWd/tU. This was because the nodal burn-up exceeded 40 GWd/tU in the mid-region of the highest rod. The fractional fission gas release at 30 EFPY was approximately 1.2%. This was maintained significantly low during the entire operation. Owing to the fission gas release, the plenum pressure attained approximately 2.5 MPa, and the cladding hoop stress showed a tendency identical to that of the plenum pressure build-up (see Figure 12B). This was because contact stress was absent owing to gap closure. Therefore, the gap conductance increased because the decrease in the fuel-cladding gap was dominant at the beginning of the operation. However, the gap conductance decreased abruptly owing to the release of fission gases such as Xe and Kr. These have low thermal conductivity after the average rod burn-up of approximately 35 GWd/tU (see Figure 13). The fuel temperature continued to increase owing to the thermal feedback phenomenon, wherein the decrease in gap conductance and degradation of fuel thermal conductivity occur simultaneously.
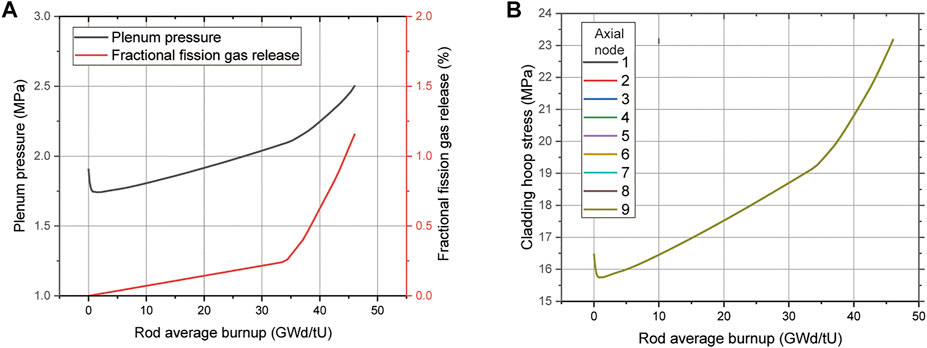
FIGURE 12. (A) Plenum pressure build-up and fission gas release and (B) Cladding hoop stress result.
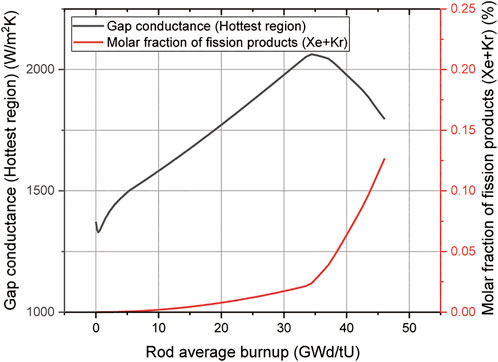
FIGURE 13. Gap conductance of peak power rod.
The oxide scale thickness was calculated using the parabolic law for 15-15Ti steel (Figure 14). It was calculated to be larger in the axial region where the cladding temperature was high. However, it was calculated to be approximately 40 μm at the end of the operation in axial region 9.
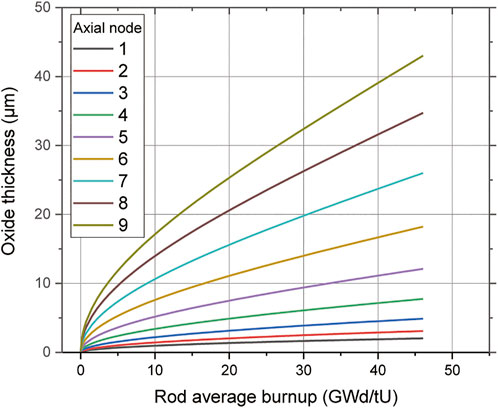
FIGURE 14. Calculated oxide thickness.
Table 5 summarizes the comparison results of the thermomechanical behavior of the peak power fuel rod of the MicroURANUS system and the design limit factors. First, the maximum fuel temperature was evaluated as 1200 K. A sufficiently low fuel temperature provided a large safety margin for fuel melting and low pressure build-up fission gas release. The cumulative damage fraction (CDF) was calculated to predict the probability of creep rupture failure using the Larson–Miller parameter (LMP) for 15-15Ti steel (Filacchioni et al., 1990). Because the cladding hoop stress showed an equal value at all the axial nodes, the CDF of the hottest part of the cladding (which is aixial region 9) was calculated as 9.08 × 10⁻¹³ using Equation 5. This result reveals a negligibly low failure probability when a limit of approximately 0.2 is considered to account for the safety margin for the mechanical integrity of cladding (International Atomic Energy Agency, 2012).
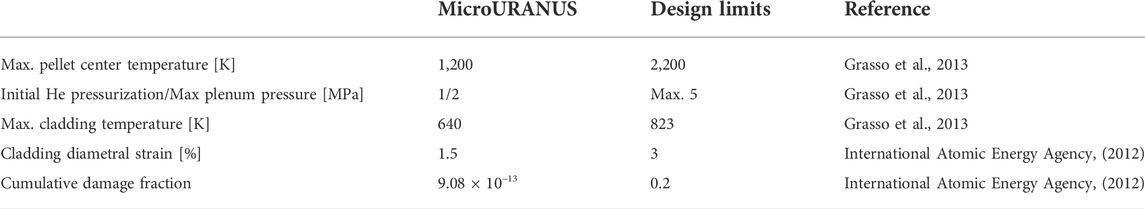
TABLE 5. Design limit analysis results of MicroURANUS.
Equation 5 Larson–Miller Parameter for 15-15Ti
This section describes the optimization of the fuel rod design of MicroURANUS by using the developed LFR fuel performance code. As explained in Figure 11, the cold gap of MicroURANUS is set to 150 μm. However, considering the cladding thermal expansion in the room-temperature reference, it has a gap of approximately 210 μm for hot zero power. This indicates that gap closure does not occur. In this case, FCMI can be prevented. However, if the gap is excessively large, the temperature of the fuel may increase owing to the low thermal conductivity of the gap. Therefore, the fuel rod design was optimized by adjusting the size of the initial gap to 150 μm, which is the reference case. The effects of initial gaps of 50 and 0 μm on the gap size, gap average temperature, and fuel centerline temperature were compared and analyzed.
In Figure 15A, the gap size evolution profile is compared by varying the size of the initial gap in axial region 5. This is the rod’s mid-region with the smallest gap size owing to the largest fuel swelling. The decreasing tendency obtained when the initial gap was set to 50 and 0 μm was similar to that at 150 μm. This was because the fuel swelling model described in Equation 4 is related only to the burn-up, and there was no significant difference in cladding deformation. It was determined that gap closure did not occur even when there was no initial gap. Thus, Figure 15B verifies that the gap conductance increased as the size of the gap decreased. It is also shown in Figures 15C,D that the gap gas temperature and fuel centerline temperature decreased as the gap size decreased and gap conductance increased. Thus, it was demonstrated that a reduction in the size of the initial gap reduces the temperature of the nuclear fuel and excludes the possibility of FCMI for MicroURANUS design using the developed LFR fuel performance code. Considering the manufacturability of the actual fuel rod, the initial gap could not be set to 0 μm. However, the fuel design could be optimized by reducing it to approximately 50 μm.
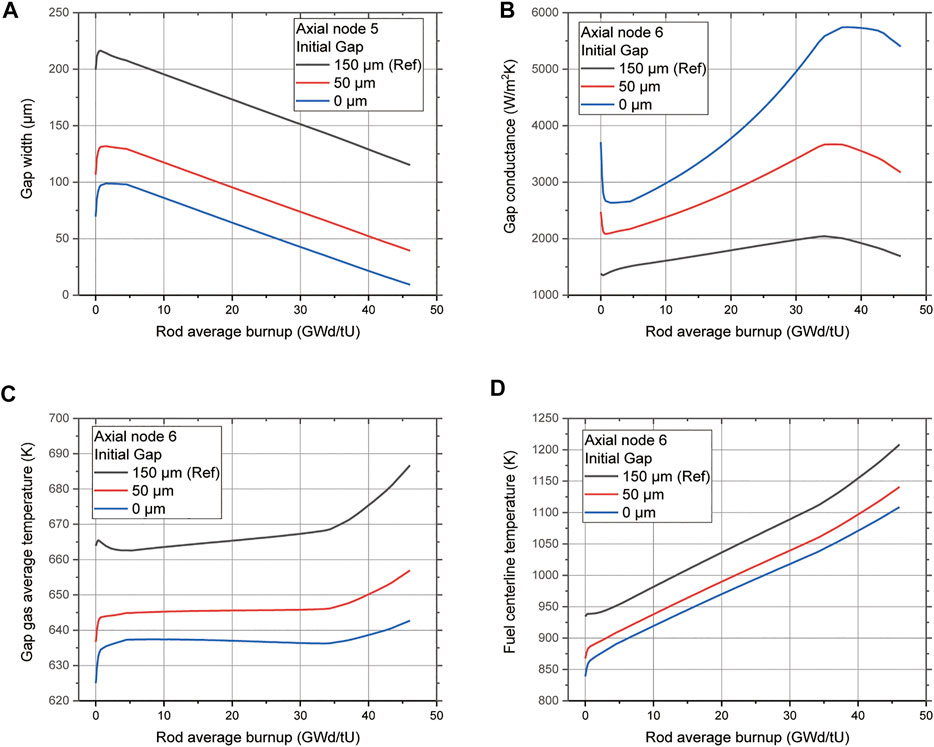
FIGURE 15. Initial gap size effects on (A) gap width, (B) gap conductance, (C) gap average temperature, and (D) fuel centerline temperature.
In this study, the LFR fuel performance code (which is a normal operation fuel performance code for the LBE coolant fast reactor) was developed based on the LWR normal operation fuel performance code FRAPCON-4.0. The material properties and mechanisms were modified to adopt the fast spectrum characteristics of the current reactor. The full core life fuel performance of MicroURANUS was analyzed using the modified code to evaluate safety in terms of thermal stability and mechanical integrity.
Owing to the low linear power of this reactor (MicroURANUS), the maximum fuel temperature was determined to be 1200 K. Consequently, a low fuel temperature provides a large safety margin for fuel melting, as well as low pressure build-up fission gas release. The maximum fractional fission gas release does not exceed 1.2%, which can reduce the internal pressure build-up of the rod and enable high initial He pressurization to effectively reduce the fuel temperature. In addition, the results show that the fuel temperature is sufficiently low to enable safe operation without gap closure during the entire core life. This can prevent mechanical interaction between fuel and cladding, which is a key mechanism of fuel pin failure in conventional reactors. The cladding shows low degrees of swelling while maintaining high mechanical integrity because of the low temperatures of the cladding and coolant.
The raw data supporting the conclusions of this article will be made available by the authors, without undue reservation.
JM: code development, performance calculation, H-JK: fuel and reactor design, HJR: conceptualization, manuscript review, project supervision.
This work was supported by the National Research Foundation of Korea (NRF, No. 2019M2D1A1067210 and 2022M2E9A304619011) grant funded by the Korea government (MSIT).
The authors declare that the research was conducted in the absence of any commercial or financial relationships that could be construed as a potential conflict of interest.
All claims expressed in this article are solely those of the authors and do not necessarily represent those of their affiliated organizations, or those of the publisher, the editors and the reviewers. Any product that may be evaluated in this article, or claim that may be made by its manufacturer, is not guaranteed or endorsed by the publisher.
Alemberti, A., Frogheri, M. L., Hermsmeyer, S., Ammirabile, L., Smirnov, V., Wu, Y., et al. (2014). Lead-cooled fast reactor (LFR) risk and safety assessment white paper. GENIV International Forum. Available at: https://www.gen-4.org/gif/upload/docs/application/pdf/2014-11/rswg_lfr_white_paper_final_8.0.pdf.
Banerjee, A., Raju, S., Divakar, R., and Mohandas, E. (2007). High temperature heat capacity of alloy D9 using drop calorimetry based enthalpy increment measurements. Int. J. Thermophys. 28, 97–108. doi:10.1007/s10765-006-0136-0
Bergmann, H., Dietz, W., Ehrlich, K., Muhling, G., and Schirra, M. (2003). Entwicklung des Werkstoffs X10CrNiMoTiB 15 15 als Strukturmaterial für Brennelemente. Available at: http://bibliothek.fzk.de/zb/berichte/FZKA6864.pdf.
Beyer, C. E., Geelhood, K. J., and Luscher, W. G. (1975). GAPCONTHERMAL-2: A computer program for calculating the thermal behavior of an oxide fuel rod. Richland, Wash. (USA): Battelle Northwest Laboratory.
Bohn, M. P. (1977). ‘FRACAS : A subcode for the analysis of fuel pellet-cladding mechanical interaction. Idaho Falls (USA): Idaho National Engineering Laboratory.
Cabet, C., Dalle, F., Gaganidze, E., Henry, J., and Tanigawa, H. (2019). Ferritic-martensitic steels for fission and fusion applications. J. Nucl. Mater. 523, 510–537. doi:10.1016/j.jnucmat.2019.05.058
Cechet, A., Barani, T., Cognini, L., Magni, A., Pizzocri, D., Altieri, S., et al. (2021). A new burn-up module for application in fuel performance calculations targeting the helium production rate in (U,Pu)O2 for fast reactors. Nucl. Eng. Technol. 53, 1893–1908. doi:10.1016/j.net.2020.12.001
Chen, Y. (2013). Irradiation effects of HT-9 martensitic steel. Nucl. Eng. Technol. 45, 311–322. doi:10.5516/NET.07.2013.706
Cheon, J. S., Lee, C. B., Lee, B. O., Raison, J. P., Mizuno, T., Delage, F., et al. (2009). Sodium fast reactor evaluation: Core materials. J. Nucl. Mater. 392 (2), 324–330. doi:10.1016/j.jnucmat.2009.03.021
Courcelle, A., Bisor, C., Piozin, E., Kountchou, M., Gavoille, P., Le Flem, M., et al. (2016). Evolution under irradiation of optimized austenitic steel for gen-IV reactors. Impact on fuel cladding properties and performances. EPJ Web Conf. 115, 47. doi:10.1051/epjconf/201611504003
Dai, Y., Zheng, X., and Ding, P. (2021). Review on sodium corrosion evolution of nuclear-grade 316 stainless steel for sodium-cooled fast reactor applications. Nucl. Eng. Technol. 113, 2327–2337. doi:10.1016/j.net.2021.05.021
Dubuisson, P. (2013). Core structural materials - feedback experience from phénix, design, manufacturing and irradiation behaviour of fast reactor. Fuel IAEA TECDOC 1689. Available at: https://www.iaea.org/publications/8881/design-manufacturing-and-irradiation-behaviour-of-fast-reactor-fuel.
Duriez, C., Alessandri, J. P., Gervais, T., and Philipponneau, Y. (2000). Thermal conductivity of hypostoichiometric low pu content (u, pu)o2-x mixed oxide. J. Nucl. Mater. 277, 143–158. doi:10.1016/S0022-3115(99)00205-6
Filacchioni, G., De Angelis, U., Ferrara, D., and Pilloni, L. (1990). Mechanical and structural behaviour of the second double stabilized stainless steels generation. Available at: https://www.icevirtuallibrary.com/doi/abs/10.1680/frcafsb.15661.0038.326
Forsberg, K., and Massih, A. R. (1985). Diffusion theory of fission gas migration in irradiated nuclear fuel UO2. J. Nucl. Mater. 135, 140–148. doi:10.1016/0022-3115(85)90071-6
Guerin, Y. (2012). Fuel performance of fast spectrum oxide fuel. Compr. Nucl. Mater. 5, 1–10. doi:10.1016/B978-0-08-056033-5.00043-4
Hübner, H. (2000). Das Bestrahlungsverhalten des austenitischen Stahls DIN 1.4970. Karlsruhe: Forschungszentrum Karlsruhe.
IMO (2018). MEPC.304(72) IMO Strategy on reduction of GHG emissions from shipsStrategy on reduction of GHG emissions from ships’. London: International Maritime Organization.
International Atomic Energy Agency (2012). Structural materials for liquid metal cooled fast reactor fuel assemblies — operational behaviour STI/PUB/1548. UK: IAEA Nuclear Energy Series, 103.
Killeen, J. C., Turnbull, J. A., and Sartori, E. (2007). Fuel modelling at extended burnup: IAEA coordinated research project FUMEX-II. Vienna: American Nuclear Society - 2007 LWR Fuel Performance/Top Fuel, 261–273.
Lee, S. G., Shin, Y. H., Park, J., and Hwang, I. S. (2021). High-temperature corrosion behaviors of structural materials for lead-alloy-cooled fast reactor application. Appl. Sci. Switz. 11 (5), 2349–2420. doi:10.3390/app11052349
Li, H., Bai, P., Lin, Z., Zhang, J., Tang, Q., and Pan, Y. (2017). Corrosion resistance in Pb-Bi alloy of 15-15Ti steel coated with Al2O3/SiC bilayer thin films by magnetron sputtering. Fusion Eng. Des. 125, 384–390. doi:10.1016/j.fusengdes.2017.04.089
Liu, Y., Xing, J., Li, Y., Tan, J., Sun, L., and Yan, J. (2016). Mechanical properties and anisotropy of thermal conductivity of Fe3–xCrxO4(x= 0–3). J. Mat. Res. 31 (23), 3805–3813. doi:10.1557/jmr.2016.425
Luscher, W. G., Geelhood, K. J., and Porter, I. E. (2015). Material property correlations : Comparisons between FRAPCON-4.0, FRAPTRAN-2.0 and MATPRO Richland, Washington: Pacific Northwest National Laboratory.
Luzzi, L., Cammi, A., De Marcello, V., Lorenzi, S., Pizzocri, D., Van Uffelen, P., et al. (2014). Application of the TRANSURANUS code for the fuel pin design process of the ALFRED reactor. Nucl. Eng. Des. 277, 173–187. doi:10.1016/j.nucengdes.2014.06.032
Maillard, A., Touron, H., Seran, J-L., and Chalony, A. (1994). Swelling and irradiation creep of neutron-irradiated 316Ti and 15-15Ti steels. ASTM Spec. Tech. Publ. 3, 824–837. doi:10.1520/stp23974s
Mathew, M. D. (2010). Evolution of creep resistant 316 stainless steel for sodium cooled fast reactor applications. Trans. Indian Inst. Metals 63, 153–158. doi:10.1007/s12666-010-0021-1
Medvedev, P., Hayes, S., Bays, S., Novascone, S., and Capriotti, L. (2018). Testing fast reactor fuels in a thermal reactor. Nucl. Eng. Des. 328, 154–160. doi:10.1016/j.nucengdes.2017.12.034
Müller, G., Schumacher, G., and Zimmermann, F. (2000). Investigation on oxygen controlled liquid lead corrosion of surface treated steels. J. Nucl. Mater. 278 (1), 85–95. doi:10.1016/S0022-3115(99)00211-1
Nguyen, T. D. C., Khandaq, M. F., Jeong, E., Choe, J., Lee, D., and Fynan, D. A. (2021). MicroURANUS: Core design for long-cycle lead-bismuth-cooled fast reactor for marine applications. Int. J. Energy Res. 45, 12426–12448. doi:10.1002/er.6661
Ravi, S., Laha, K., Mathew, M., Vijayaraghavan, S., Shanmugavel, M., Rajan, K., et al. (2012). Influence of flowing sodium on creep deformation and rupture behaviour of 316L(N) austenitic stainless steel. J. Nucl. Mater. 427, 174–180. doi:10.1016/j.jnucmat.2012.04.030
Rozzia, D., Del Nevo, A., Tarantino, M., and Forgione, N. (2012). Preliminary discussion on LFR fuel pin design: Current status, fuel modeling and open issues. Int. Conf. Nucl. Eng. Proc. ICONE 1, 467–473. doi:10.1115/ICONE20-POWER2012-54728
Schumann, U. (1970). MAPLIB, A program system for provision of material property data to computer programs.
Seban, R. A., and Shimazaki, T. (1949). Heat trasnfer to a fluid flowing turbulently in a smooth pipe with walls at constant temperature. Berkely (USA): California Univ.
Shin, Y. H., Cho, J., Lee, J., Ju, H., Sohn, S., Kim, Y., et al. (2017). Experimental studies and computational benchmark on heavy liquid metal natural circulation in a full height-scale test loop for small modular reactors. Nucl. Eng. Des. 316, 26–37. doi:10.1016/j.nucengdes.2017.03.001
Siefken, L. J., Coryell, E. W., Harvego, E. A., and Hohorst, J. K. (2001). SCDAP/RELAP5/MOD 3.3 code manual Rockville: U.S. Nuclear Regulatory Commission (NRC).
Stern, J. (2020). Methane emissions from natural gas and LNG imports : An increasingly urgent issue for the future of gas in europe. Oxford: Oxford Institute for Energy .
Többe, H. (1975). Das Brennstabrechenprogramm IAMBUS zur Auslegung von Schellbrüter–Brennstäben The Fuel Rod Calculation program IAMBUS for the Design of Fast Breeder Fuel Rods Bergisch Gladbach, Germany: Interatom GmbH.
Tsisar, V., Schroer, C., Wedemeyer, O., Skrypnik, A., and Konys, J. (2016). Long-term corrosion of austenitic steels in flowing LBE at 400 °c and 10-7 mass% dissolved oxygen in comparison with 450 and 550 °c. J. Nucl. Mater. 468, 305–312. doi:10.1016/j.jnucmat.2015.09.027
Turnbull, J. A. (1996). Presentation at the IAEA reserach coordination meeting on fuel modelling at extended burnup. Bombay, India: FUMEX.
Walker, C. T., Goll, W., and Matsumura, T. (1996). Effect of inhomogeneity on the level of fission gas and caesium release from OCOM MOX fuel during irradiation. J. Nucl. Mater. 228, 8–17. doi:10.1016/0022-3115(95)00191-3
Keywords: MicroURANUS, fast reactor, long-life, UO2, fuel performance, lead-bismuth
Citation: Mun J, Kim H-J and Ryu HJ (2022) Analysis of fuel performance under normal operation conditions of MicroURANUS: Micro long-life lead-bismuth-cooled fast reactor. Front. Energy Res. 10:965319. doi: 10.3389/fenrg.2022.965319
Received: 09 June 2022; Accepted: 08 September 2022;
Published: 30 September 2022.
Edited by:
Hidemasa Yamano, Japan Atomic Energy Agency, JapanReviewed by:
Takayuki Ozawa, Japan Atomic Energy Agency, JapanCopyright © 2022 Mun, Kim and Ryu. This is an open-access article distributed under the terms of the Creative Commons Attribution License (CC BY). The use, distribution or reproduction in other forums is permitted, provided the original author(s) and the copyright owner(s) are credited and that the original publication in this journal is cited, in accordance with accepted academic practice. No use, distribution or reproduction is permitted which does not comply with these terms.
*Correspondence: Ho Jin Ryu, aG9qaW5yeXVAa2Fpc3QuYWMua3I=
Disclaimer: All claims expressed in this article are solely those of the authors and do not necessarily represent those of their affiliated organizations, or those of the publisher, the editors and the reviewers. Any product that may be evaluated in this article or claim that may be made by its manufacturer is not guaranteed or endorsed by the publisher.
Research integrity at Frontiers
Learn more about the work of our research integrity team to safeguard the quality of each article we publish.