 Lei Wang1
 Lin Yang
- 1State Grid Hebei Electric Power Research Institute, Shijiazhuang, China
- 2State Grid Hebei Electric Power Company, Shijiazhuang, China
- 3The College of Electrical Engineering, Sichuan University, Chengdu, China
The fast and reliable detection of subsynchronous oscillations (SSOs) in wind farms is important for maintaining the stable operation of a power system. This paper presents a novel, SSO detection method for noisy synchrophasor data that considers the issue of detection as a binary classification (SSO and non-SSO) from the perspective of pattern recognition. The proposed algorithm easily implements cycle-based feature extraction from raw data by applying the strong period of the SSO signal, which is distinguished from noisy data. To mitigate the performance reduction of regular classifiers due to the imbalance issue caused by SSO data being substantially less than non-SSO data, a weighted kernel extreme learning machine is constructed as a classifier to implement SSO detection. Experimental studies are carried out on simulation and field data; the results show the effectiveness of the proposed algorithm for SSO detection in the case of a low SNR and of imbalance issues.
1 Introduction
With an increase in renewable energy power generation, the problem of subsynchronous oscillation (SSO) has become constantly prominent (Yang et al., 2020; Ma et al., 2022). The SSO phenomenon occurs in electrical power systems due to weak grids or the interaction between turbine-generators with low inertia and long-distance series compensated lines (Shair et al., 2019a), resulting in coupled oscillation between mechanical system and electrical system at frequencies lower than the system rated frequency (Xie et al., 2017; Wang et al., 2019). Unstable SSO threatens the safety of equipment and the stable operation of a power system. For suppressing the SSOs, some proper mitigation techniques, e.g., damping control methods for damping the oscillation(Shair et al., 2019b; Zhang et al., 2020), virtual inertia control methods for enhancing the stability of grids (Sun et al., 2020; Fu et al., 2022), are have been reported in the literature. To effectively take these mitigation measures, the SSO event firstly needs to be correctly detected.
Many methods for SSO detection have been presented in the literature, including the widely employed Prony (Hauer et al., 1990), matrix pencil (Hua and Sarkar, 1990; Wang et al., 2021), TLS-ESPRIT (Tripathy et al., 2011), interpolated DFT (Yang et al., 2020), Hilbert-Huang transform (Zhang et al., 2016), and synchrosqueezing transform (Ma et al., 2022). The mathematical nature of these methods is such that they always use relatively complex computation and give numerical results, e.g., frequency, damping, amplitude and phase of SSO, even if there are no SSOs present in a signal. Essentially, these methods are parameter identification methods. Long window data and certain parameters, e.g., number of mode orders and detection thresholds, need to be determined in advance, and incorrect parameter settings cause incorrect detection. Moreover, a power system mostly operates in a normal working state, and SSOs occur in only a few cases; thus, it is unnecessary to apply such heavy computations to detect SSOs. Only after SSO is detected are these parameter identification methods conducive to the suppression of SSO. From the view of artificial intelligence, the detection of SSO can be considered a problem of binary classification (i.e., SSO and non-SOS) in pattern recognition. Classification methods generally include feature extraction and classifier construction. For feature extraction, since the SSO signal, as one type of disturbance in a power system, is a nonstationary signal, certain statistical and other types of features are extracted from time-frequency transformation methods, such as the wavelet transform (Lin et al., 2002; Chen et al., 2020) and S-transform (Sarkar and Chilukuri, 2021). However, the high computational complexity of these transforms creates an immense obstacle to online SSO detection. Although deep learning (DL) methods (Miao et al., 2022; Satheesh et al., 2022) can automatically extract certain abstract features, large manually labeled data for SSOs and non-SSOs are required to train the network to achieve excellent performance, while SSO data are scarce in reality. When facing a new dataset, there are limitations for adaptively adjusting DL methods. In addition, measurement noise always exists in captured electric data, and distinct features with high effective extraction are needed to distinguish complex and variable SSO signals from noisy data, making the case for online SSO detection.
For classifier construction, certain machine learning (ML) and DL methods have been widely utilized in certain fields. DL methods, such as deep neural networks (Yadav et al., 2019) and recurrent neural networks (RNNs), also face performance degradation due to the shortage of SSO data. Conversely, ML methods, including k-nearest neighbors (KNN) (Khan et al., 2020), the support vector machine (SVM) (Zidi et al., 2018), the extreme learning machine (ELM) (Huang et al., 2006, 2012), the random forest (RF) (Phan et al., 2020), XGBoost, LightGBM (Li et al., 2020), etc., show good performance for small datasets. Refer (Abdelaziz et al., 2012) used an SVM to implement SSO detection from synchrophasor data collected in phasor measurement units (PMUs) since PMUs are feasible for wide-area oscillation monitoring. Although the SVM is the most popular classifier, the ELM tends to have a better scalability and generalization performance at faster speeds for classification than the SVM (Huang et al., 2006). Although the RF, XGBoost and LightGBM, as ensemble learning, can achieve high performance, they take a longer time to implement the detection task. In addition, when these regular ML methods are employed to detect SSO from PMU data, they face the issue of imbalanced data distribution. Since the number of collected PMU data in non-SSO operations is much larger than that in SSO events, the regular ML methods are biased towards the majority class (non-SSO) and misclassify the minority class (SSO) as the majority class. Although over-sampling methods, e.g., SMOTE, synthesize new samples into the minority class, the existence of noise samples generates more noise and even degrades the performance (Lu et al., 2020). Thus, it is desired to construct a classifier to conduct imbalanced data with satisfactory performance and faster detection speed.
Based on the above analysis, an effective method based on the weighted kernel ELM (WELM) with cycle-based feature extraction is proposed to detect SSO from noisy PMU data. First, strong periodicity of SSO data is applied to easily extract cycle-based features, distinct from noisy non-SOS data. Second, the WKELM classifier is constructed to implement SSO detection, considering that WKELM has the potential to handle the class imbalance learning problem and has fast detection with good generalization performance. Last, simulation and field data are employed in our experiments, and the obtained results demonstrate that the proposed method generally has good performance and faster detection speed.
Compared with existing methods, the innovation of our method is listed as follows: 1) novel cycle-based features, including amplitude, time-period and shape features, are easily extracted, which is more discriminative and objective to distinguish from noisy non-SSO data; 2) the WKELM classifier introduces the overall discriminative ability for imbalanced data and guarantees high efficiency for SSO detection even in the case of a low signal-to-noise ratio (SNR); 3) the proposed approach has less computational burden and potential for online applications;
The paper is organized as follows: The feature extraction method is proposed in Section 2. The design of the WKELM classifier is presented in Section 3. The simulation and application results are presented in Section 4.2. The conclusions are given in Section 5.
2 Feature extraction
One of the most important parts of SSO detection is to extract useful information from the amplitude of phasors. The purpose of feature extraction is to reduce the measured signals into discriminative features, which are useful for classifying SSO and non-SSO events. Since the oscillation is more visible in current phasors than voltage phasors, the following paper uses current phasors for SSO detection. The phasor signals received in the PMU are the continuous time-domain signals, which are split into equal-time sections, and the length of the window depends on the monitoring object. After segmentation, we extract easily computed cycle-based features in the time domain, including amplitude, time-period, and shape features, and then calculate the statistical distribution of these features for each segmentation as the input of the classifier.
2.1 Cycle-based feature extraction
We note that there is a strong periodicity in the amplitude sequences of phasors with SSO, whereas non-SSO data, even induced by noise, do not exhibit this periodicity, as shown in Figures 1A,B. To extract these important cycle-based features, the peaks and troughs are roughly identified as the local minima and maxima of the amplitude of the current phasors in the segmented data. In our experiments, different from the definition of the cycle in the power system, cycles are considered the start and end at consecutive troughs in the current magnitude phasors, as shown in Figure 1C. The amplitudes of the ith peak and its preceding trough are denoted as
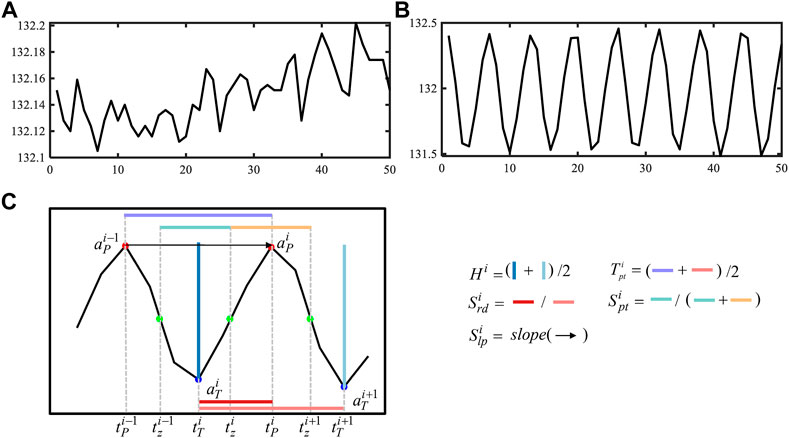
FIGURE 1. Feature Extraction from PMU data. (A) Noisy non-SSO PMU data; (B) noisy SSO PMU data; (C) cycle-based features.
• Amplitude feature
Theoretically, the amplitude sequence of non-SSO noise-free phasors demonstrates a steady tendency as a straight line under the condition of the steady operation of the wind-farm system. Due to the randomness of noise, the height, defined as the amplitude difference between the peak and trough in a cycle, between two adjacent cycles randomly increases or decreases. Moreover, the extent of the height change is irregular. In contrast, it is observed from the field PMU data that when SSO occurs in the wind-farm system, the change in height in the segmentation shows regularity, as shown in Figure 1. Even with the effect of noise, the trend also exists in PMU data.
Thus, we calculate the average height Hi from the ith trough to the ith peak and from the i + 1-th trough to the ith peak as
to be one of the features.
• Time-period feature
All measurement data and research reports demonstrate that the magnitudes of current phasors show oscillation with a certain frequency due to the SSO. Naturally, the time interval between two adjacent peaks is consistent with the interval between the other two adjacent peaks in the segmentation. Similarly, the time interval between two adjacent troughs has the same property. However, this property is apparent from the non-SSO noisy phasors.
Thus, we calculate the time interval between the ith peak and the (i − 1)th peak as
In addition, to indicate that the cycle in SSO data has approximately equal durations of rising and descending, we calculate the rise-descend symmetry as
Moreover, to indicate that the peak and trough have approximately equal durations, we calculate the peak-trough symmetry as
where
• shape feature
The shape feature is indicated by the slope of two adjacent peaks or the slope of two adjacent troughs. When the magnitudes of current phasors continuously rise or descend, corresponding to the positive damping ratio or negative damping ratio, respectively, the slopes from SSO data show more regularity than those from non-SSO noisy data. In our experiments, we empirically choose the slope of the (i − 1)th peak and ith peak as a feature and calculate the slope as
Thus far, we have extracted five cycle-based features, i.e.,
for each cycle.
2.2 Feature set acquisition
To comprehensively acquire the features of each PMU segmentation, the statistical distribution of the cycle-based features is extracted. Commonly, the variations in the distributions of these features can be used to distinguish non-SSO and SSO events, while the variation is sensitive to the mean. The uncertainty in the means of the amplitude, time period and slope feature depends on the different operation conditions of the wind farm when SSO occurs. Thus, the variations in these features are not suitable as discriminative features.
To avoid the effect of scale, we utilize the coefficient of variation (CV) to measure the dispersion of the cycle-based features. The CV is a unitless measure of variation, defined as the standard deviation divided by the mean, i.e.,
where μ is the mean and σ is the standard deviation. Eq. 7 denotes that the CV is a relative standard deviation independent from the mean.
Thus, we calculate the CV of the cycle-based features in Eq. 6 for each segmentation, denoted as
to serve as input of the following WKELM classifier.
3 Classifier based on weighted kernel extreme learning machine
To address the issues of the data imbalance between SSO phasors and non-SSO phasors and to improve the robustness and nonlinear processing capabilities for detecting SSOs, the WKELM is applied in our works while preserving the basic ELM’s advantages over other regular ML methods, such as inherently faster calcification speeds, lesser computational complexity, and better overall performance on classification.
3.1 Basic ELM
The basic ELM, proposed by Huang et al. (Huang et al., 2006, 2012), is a single-hidden layer feed-forward neural network (SLFM). Given N distinct training samples
where oj is the jth input data target vector, βi are the weights between the ith neuron in the hidden layer and the output layer, h(⋅) is an activation function, and wi and bi are the weight vector and bias vector between the ith hidden neuron and the input layer, respectively.
For the training set, there are (βi, wi, bi) to satisfy oj = yj. Further, Eq. 9 can be concisely rewritten in matrix form as
where H is the hidden layer output matrix, expressed as
and
where (⋅)T is a transpose operator.
The object of training the ELM is to estimate the parameters (βi, wi, bi) by solving the optimization problem, i.e., min ‖Hβ − Y‖2. Huang et al. (Huang et al., 2006) suggested that (wi, bi) do not need to be tuned but are randomly generated according to a uniform probability distribution. Thus, only β needs to be estimated by using the least squares algorithm, given by
where H† is the Moore-Penrose generalized inverse of H.
For a binary classification issue in this work, the predicted class label of x is obtained as
To achieve good accuracy, the basic ELM classifier usually needs a large number of hidden nodes, resulting in computational burden and longer training time. Moreover, randomly choosing wj and bj for more hidden nodes causes a large variation in the performance. In addition, similar to other classifiers for imbalanced data, the basic ELM classifier decreases the accuracy of detecting SSO data as a minority class.
3.2 Weighted kernel ELM
To solve the previously mentioned issues in the basic ELM classifier, the WKELM is selected in our work. First, for the problem of imbalanced data, the N × N diagonal matrix W associated with every training sample is introduced in the basic ELM to formulate the weighted ELM (WELM) (Zong et al., 2013). The main idea of the WELM is to assign a larger weight to the training errors of the minority class than to those of the majority class. According to this strategy, the diagonal elements in W are empirically given by (Zong et al., 2013)
or
where n(yi) is the number of training samples belonging to class yi and AVG(⋅) is the average number of samples for all classes. Intuitively, by using the weighted matrix W, the quantity of the minority class and majority class is roughly rebalanced. To minimize the weighted cumulative training errors for all samples and the norm of output weight ‖β‖2, the objective function of the WELM is mathematically formulated as
where λ is a penalty parameter, achieving a trade-off between the fitting error minimization and the model complexity. According to the Karush-Kuhn-Tucker theorem (Fletcher, 1984), the solutions of the WELM can be obtained as
Second, to improve the robustness and nonlinear processing capabilities of the WELM for SSO detection, the hidden layer random mapping h(xi) is replaced by the kernel function; then, the kernel mapping function for WELM can be written as (Wang et al., 2017)
where K(xi, xj) is the kernel function.
Further, using Eqs 18, 19, for the binary classification, the decision function of WKELM of x is given by
where K(x, xj) = exp( − γ‖x − xj‖2), i.e., RBF kernel function, is adopted in this work.
4 Experiments and results
To demonstrate the effectiveness of the proposed detection algorithm, we verify the validity of the extracted features and compare the detection performance of WKELM with that of other commonly employed machine learning methods, i.e., ELM, SVM, KNN, RF, XGBoost and LightGBM, since SSO detection is considered a classification issue in this paper. The settings of key parameters for seven classifiers are shown in Table 1. The algorithms are tested on simulated and measured field PMU data, where simulated PMU data are generated at 100 samples per second, while the real measured PMU data are sampled at 50 samples per second. All experiments are conducted on a PC computer with an i7-11700K 3.60 GHz CPU, and 32 GB RAM.

TABLE 1. Parameter settings of the used ML-based classifiers.
4.1 Evaluation indices
For a classification problem, we use precision, recall, accuracy and F1 score as evaluation indicators to evaluate the performance of the methods applied in this work. Precision, recall and accuracy are defined as
respectively, where TP (true positive) is the number of SSOs correctly detected as SSOs; TN (true negative) is the number of non-SSOs correctly detected as non-SSOs; FP (false positive) is the number of non-SSOs incorrectly detected as SSOs; and FN (false negative) is the number of non-SSOs incorrectly detected as SSOs. Additionally, the F1 score is defined as
where precision and recall are given in Eq. 21.
4.2 Results from simulation data
The simulation PMU data are generated by using the DFT-based PMU algorithm from the current waveform data in the wind power system, as shown in Figure 2. The system is modeled in the PSCAD/Simscape Power Systems software for electromagnetic transient simulations. The system contains five doubly fed induction generator(DFIG)-based wind farms, and series capacitor is installed on the line of bus 5-bus 6 to compensate for the wind power (Wang et al., 2020). The SSO occurs owing to the unstable interaction between DFIGs and series capacitors. The parameters of each DFIG are shown in Table 2.
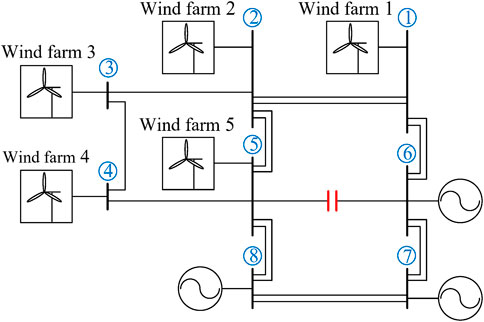
FIGURE 2. Single line diagram of test system.
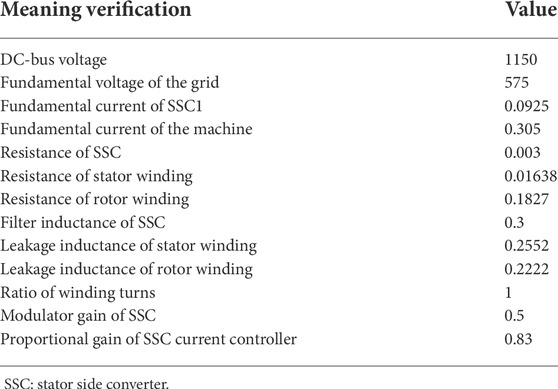
TABLE 2. Parameters of DFIG impedance model (Wang et al., 2020).
SSO is triggered by switching on the series capacitor at t = 9 s; varying the compensation level of the series capacitor causes different intensities of SSO waveforms; and nine types of current waveforms are recorded to conduct this experiment. Using the DFT-based PMU algorithm (Yang et al., 2020), we synthesize PMU data with a 100 Hz reporting ratio. To simulate the real operation condition, noise is superimposed onto PMU data. As an example, three types of current waveforms and the corresponding noisy PMU data are shown in Figure 3, where the signal-to-noise-ratio (SNR) = 40 dB. To highlight the effect of noise, noisy PMU data during the non-SSO time period are shown in a small window.
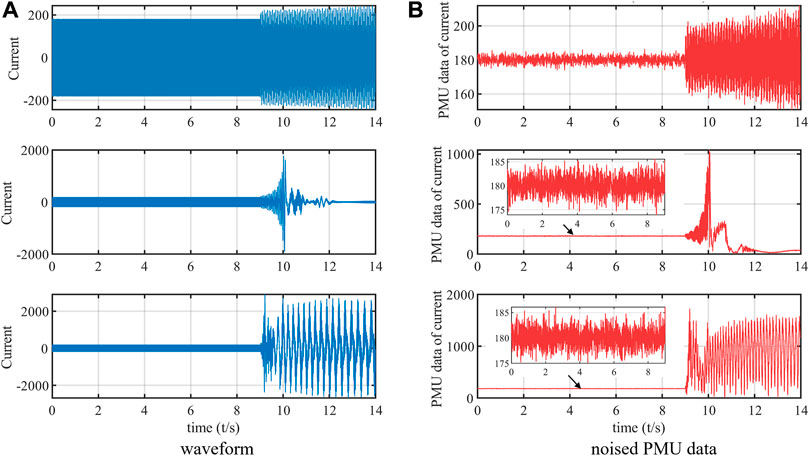
FIGURE 3. Three types of SSO waveform and the corresponding noisy PMU data (A) current waveform data; (B) noisy PMU data with SNR = 40 dB.
The simulation PMU data are generated by using the DFT-based PMU algorithm from the current waveform data in the wind power system, as shown in Figure 2. The system, which is modeled in the PSCAD/EMTDC platform, contains several DFIG-based wind farms, and a series capacitor is installed to compensate for the wind power. SSO is triggered by switching on the series capacitor at t = 9 s; varying the compensation level of the series capacitor causes different intensities of SSO waveforms; and nine types of current waveforms are recorded to conduct this experiment. Using the DFT-based PMU algorithm (Yang et al., 2020), we synthesize PMU data with a 100 Hz reporting ratio. To simulate the real operation condition, noise is superimposed onto PMU data. As an example, three types of current waveforms and the corresponding noisy PMU data are shown in Figure 3, where the signal-to-noise-ratio (SNR) = 40 dB. To highlight the effect of noise, noisy PMU data during the non-SSO time period are shown in a small window.
From the simulation PMU data, we obtain a total of 3160 sets of 0.5 s window data, including non-SSO and SSO data. Approximately 80% of data is used to train different classifiers, and the other 20% of data are used to test the performance of the trained classifiers. Among the sets of training and testing data, the ratios of non-SSO and SSO data are shown in Figure 4. Accordingly, there is data imbalance between non-SSO classes and SSO classes. The amount of data used in the training and testing procedure is shown in Table 3.
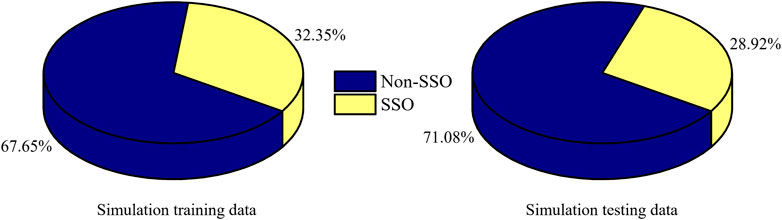
FIGURE 4. The number ratios of synthetic non-SSO and SSO data for training and testing.

TABLE 3. Number of data used in the training and testing.
4.2.1 The effectiveness of features
The five features in Eq. 8 are extracted from the noisy PMU data with SNR = 40 dB and a 0.5 s time window. To demonstrate the distribution of the extracted feature values of the SSO class and non-SSO class, two-dimensional (2D) scatter plots between any two features are shown in Figure 5, which shows that the feature distribution of the non-SSO class is more concentrated than that of the SSO for most features since different SSO cases with varied amplitudes, frequencies and envelope shapes, as shown in Figure 3A, are considered in this experiment. Even with noise and diverse SSO events, there is a different feature distribution for the non-SSO class and SSO class.
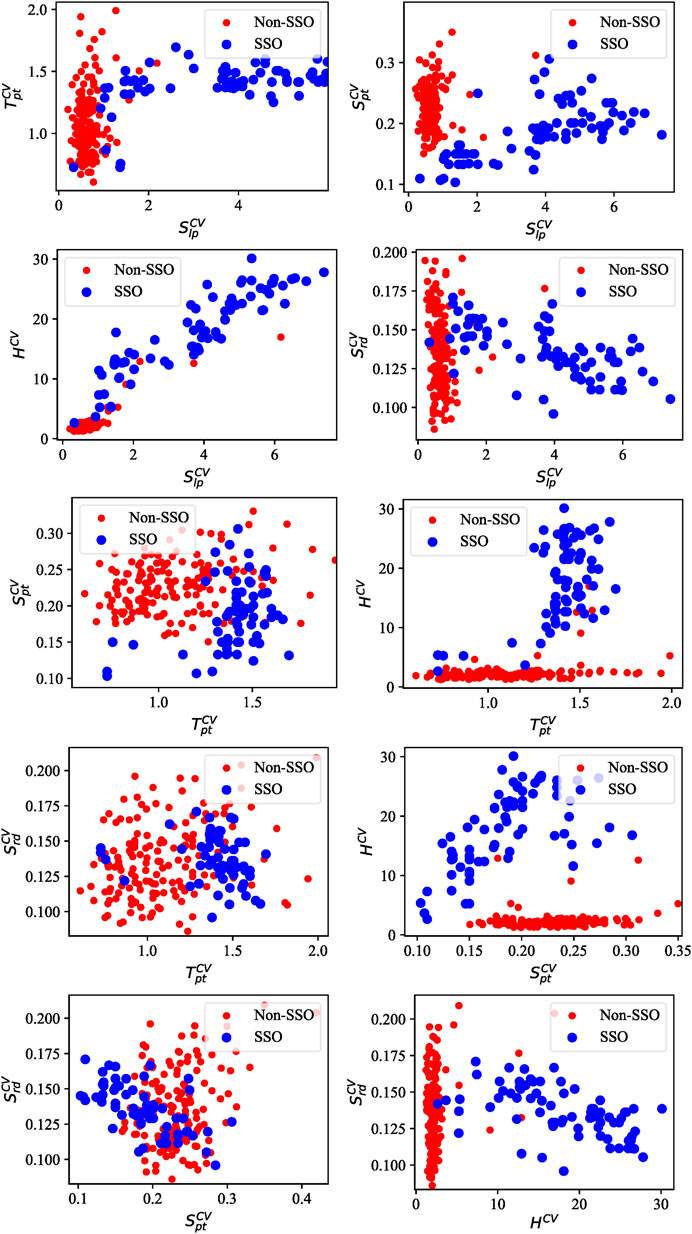
FIGURE 5. Scatter plots between two any features, when SNR = 40 dB.
To further show the effectiveness of the extracted five features, we disregard any one feature and adopt the remaining four features as inputs to train and test the performance of the WKELM classifier. The performance results are shown in Table 4. Compared with the results of adopting all five features, disregarding any one feature reduces the performance indices of the WKELM classifiers.
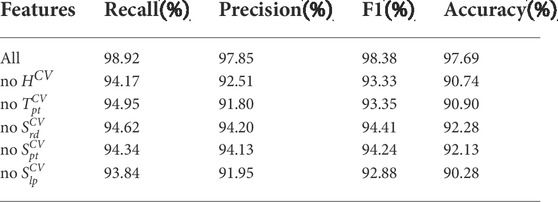
TABLE 4. Effect of features on the performance of WKELM classification, SNR = 40 dB.
4.2.2 Noise sensitivity
To test the noise sensitivity of the classifiers, PMU data are superimposed by not only noise with SNR = 40 dB but also noise with SNR = 30 dB and 50 dB. After the features extracted from the training data are utilized to train the used classifiers, the trained classifiers are applied to the testing data, and the performance indices are recorded in Table 5. Among all the classifiers employed, the WKELM classifier achieves the best performance for different SNRs. Taking accuracy results in Table 5 as examples, in the case of SNR = 50 dB, WKELM can achieves 98.15% detection accuracy with 2.47% higher than the lest accuracy from SVM. Even through SNR is decreased to be 30dB, the accuracy of WKELM maintains 96.48%, and WKELM is less affected than other classifiers. For example, WELM achieves 7.10% improvement over ELM having the lest accuracy, and 4.32% improvement over LightGBM having the second high accuracy. The above results indicate that WKELM classifier holds strong anti-noise ability over other classifiers.
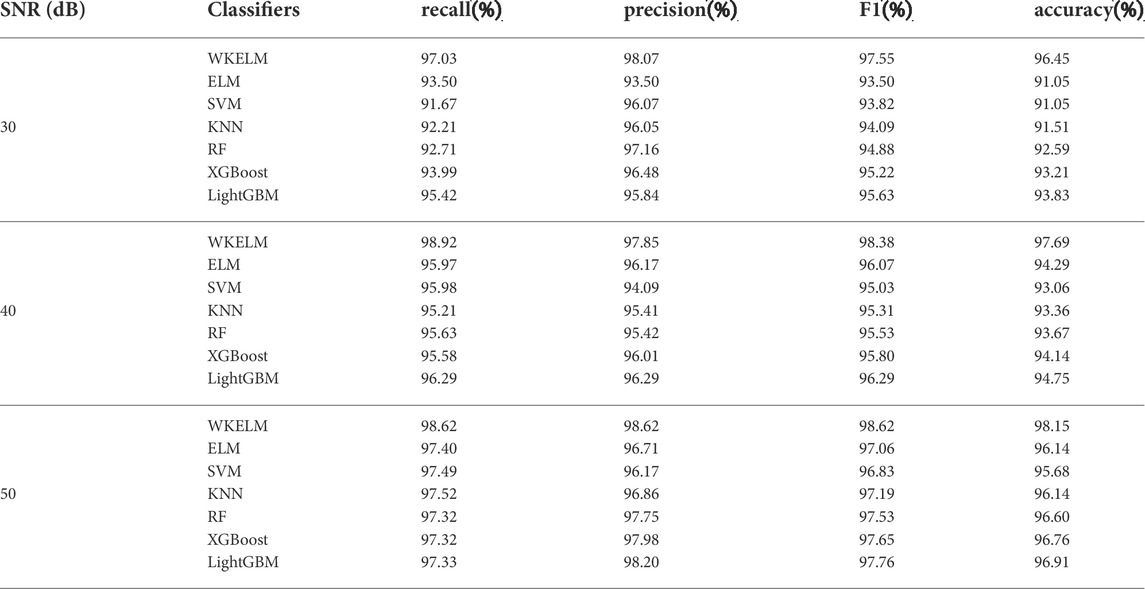
TABLE 5. Performance results of different classifiers under differen SNR.
4.2.3 Time of training and testing
Table 6 shows the training time and testing time for the number of corresponding data in Table 3. Since RF, XGBoost and LightGBM belong to the ensemble algorithm, they take longer to train and detect than nonensemble classifiers, e.g., SVM and KNN. To achieve satisfactory performance for ELM, we set 1024 nodes for the hidden layer in ELM, leading to a relatively longer training time, although the ELM has a faster testing time among all the classifiers. The reason for the shortest detection time is that the basic ELM is a single-hidden layer neural network. Since the WKELM uses the kernel function to replace the hidden layer of the ELM, the training time is obviously shortened compared with the ELM. Moreover, the WKELM achieves faster detection times than most classifiers. Thus, the WKELM obtains the tradeoff between training time and testing time.
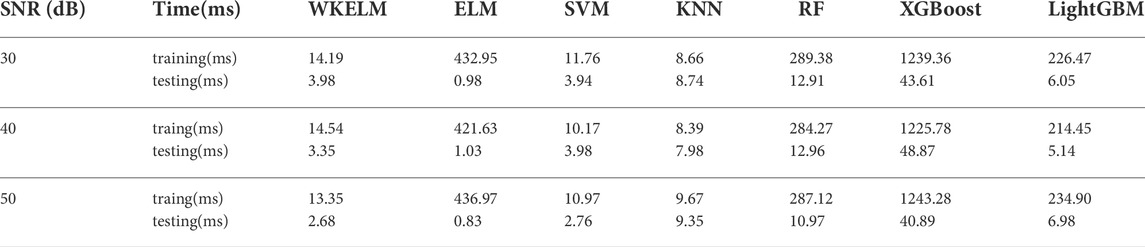
TABLE 6. The training and testing times of different algorithms.
4.3 Results from field data
The field PMU data from Guyuan wind farm, North China, are also selected to verify the SSO detection performance and efficiency of our proposed method. The system diagram with twenty-three wind farms in the Guyuan area is shown in Figure 6 (Xie et al., 2017). All these wind farms are radially connected by 220-kV transmission lines and connected to a 500-kV compensated network. Most of the wind generators are 1.5-MW DFIGs, and a few are permanent magnet synchronous generators. Figure 7A shows an example of field PMU data; non-SSO data within the blue box and SSO data within the red box are magnified and shown in Figures 7B,C. In this experiment, 5,835 window data are used for training, and 1168 window data are used for testing. Figure 8 shows the ratio of non-SSO class to SSO class utilized for training and testing. Similarly, an imbalance issue exists in the training and testing data. The class labels of the window data are determined by expert knowledge and spectrum analysis in advance.
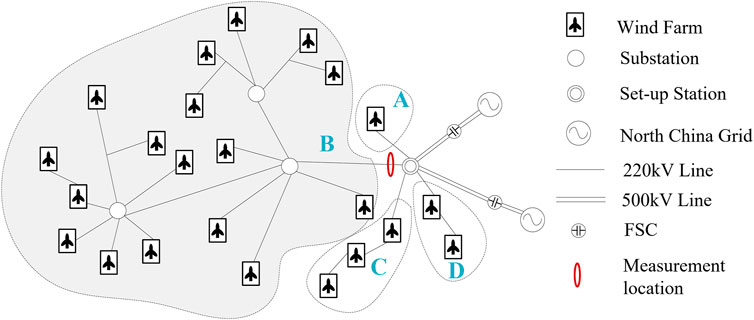
FIGURE 6. The system diagram of Guyuan wind farm.
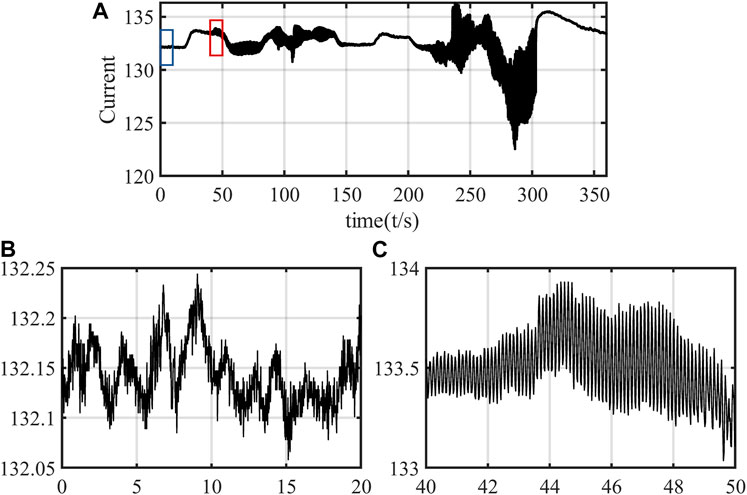
FIGURE 7. Field PMU data from Guyuan wind farm, China. (A) Field PMU data; (B) zoomed non-SSO window data within in blue box in (C); zoomed SSO window data within in red box in (A).
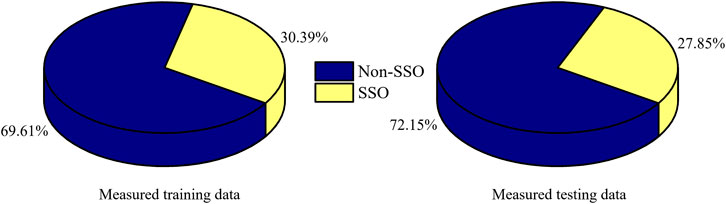
FIGURE 8. The number ratios of field non-SSO and SSO PMU data for training and testing.
Figure 9 shows the scatter plots between any two features after the features are extracted, as described in Section 2. Compared with the varied simulated SSO data in Figure 4, the feature distribution of the SSO is more concentrated since SSO events occur in a single wind farm. There is an obvious distribution difference between the non-SSO class and the SSO class.
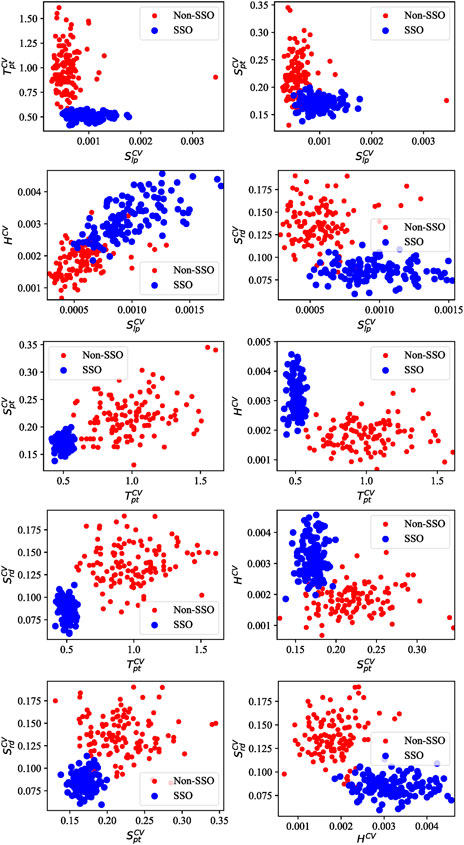
FIGURE 9. Scatter plots between two any features.
Tables 7, 8 show the performance results and times of training and testing, respectively, after the selected classifiers are trained from the extracted features and to execute SSO detection for testing data. Since the SNR in field data is not commonly lower than 40 dB, all classifiers can achieve satisfactory detection performance. In the case of imbalanced data for SSOs and non-SSOs, the KELM achieves approximately 1.5% and 5.1% improvements in accuracy compared with ELM and the widely employed SVM, respectively. Although RF, XGBoost and LightGBM can achieve performance comparable to that of the WKELM, they need longer training and testing times due to the heavy computational burden, making it difficult for them to satisfy the requirements of online detection. Thus, from the view of comprehensively considering the performance and speed of detection, the WKELM obtains the best results among the examined classifiers.
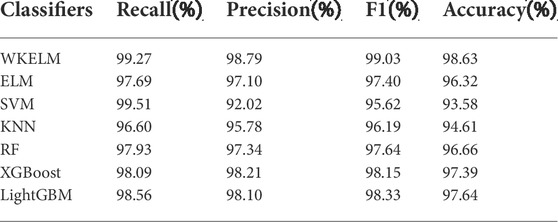
TABLE 7. Evaluation indices for detection performance of different algorithms.

TABLE 8. Training and testing time for different classifier algorithms on field PMU data.
4.4 Discussion
The proposed methods can achieve better performance for detecting SSO from noisy PMU data from the view of the balance of detection time and SSO detection accuracy, compared with other commonly used ML methods. whereas some aspects need to be improved in the future works.
First, the effectiveness of the proposed method needs to be further verified by more comprehensive data, since the field PMU data used in the paper are captured from one wind farm. Due to the different network structure and different operational condition among wind farms, the variation of SSO could generate the data previously untrained, it would make the proposed method ineffective for the unseen data.
Second, the features used for the WKELM classifier are manually extracted, mainly relied on the expert knowledge. Human intervention would limit the robustness and generalization ability of the SSO detection algorithm. While DL methods can automatically learn feature representations from complex data without human intervention and can cope with complex and variable SSO data. Thus, DL-based feature extraction methods with low time complexity will be considered in the future.
Thirdly, the WLELM classifier use the fixed weighting scheme, according to the number of samples in each category as shown in Eq. 20, the fixed weight is given for different samples of the same category. Whereas, recent studies show that this fixed weighing strategy would lead to decrease in the classification accuracy of the majority class, when facing the problem of data imbalance (Tong et al., 2021). Thus, to improve the performance of WLELM classifier, adaptive weighting strategy needs to be proposed to assign weights adaptive to different samples of the same category.
5 Conclusion
This paper presents a fast and reliable SSO detection algorithm for noisy PMU data. The algorithm enables the easy implementation of distinct feature extraction from raw PMU data without any signal transforming preprocessing and constructs the WKELM classifier to detect SSO data from non-SSO data. The proposed algorithm has been validated by experimental studies on simulation data and field data. Compared with other regular classifiers, the proposed method has higher accuracy with faster detection speed and has potential for online SSO detection.
In terms of further works, more comprehensive training data should be used, since this paper only applied the simulation data and field data from one wind farm, which can not fully represent the characteristics of SSO data due to the dynamics in the various wind farms. The generalization of the proposed method should be tested and improved by using new techniques or other machine learning algorithms. And then, DL-based feature extraction methods will be introduced to cope with complex and variable SSO data with less human intervention. Furthermore, it will be interesting to investigate adaptive methods to adaptively assign weights for the WELM classifier.
Data availability statement
The original contributions presented in the study are included in the article/Supplementary Material, further inquiries can be directed to the corresponding author.
Author contributions
Conceptualization,TL and LW; methodology, HF, XH and XY and LY; validation, XY and LY; formal analysis, TL and XH; data curation, LW and HF; writing—original draft preparation, LY and XH; writing—review and editing, TL and XY. All authors have read and agreed to the published version of the manuscript.
Funding
This work was supported by the China Key Technology Research on Risk Perception of Sub-Synchronous Oscillation of Grid with Large-Scale New Energy Access SGTYHT/21-JS-223.
Conflict of interest
Author HF was employed by the company State Grid Hebei Electric Power Company.
The remaining authors declare that the research was conducted in the absence of any commercial or financial relationships that could be construed as a potential conflict of interest.
Publisher’s note
All claims expressed in this article are solely those of the authors and do not necessarily represent those of their affiliated organizations, or those of the publisher, the editors and the reviewers. Any product that may be evaluated in this article, or claim that may be made by its manufacturer, is not guaranteed or endorsed by the publisher.
References
Abdelaziz, A., Mekhamer, S., Ezzat, M., and El-Saadany, E. (2012). “Line outage detection using support vector machine (svm) based on the phasor measurement units (pmus) technology,” in 2012 IEEE Power and Energy Society General Meeting, San Diego, California, July 22–26, 2012 (IEEE), 1–8.
Chen, J., Li, X., Mohamed, M. A., and Jin, T. (2020). An adaptive matrix pencil algorithm based-wavelet soft-threshold denoising for analysis of low frequency oscillation in power systems. IEEE access 8, 7244–7255. doi:10.1109/access.2020.2963953
Fu, S., Sun, Y., Liu, Z., Hou, X., Han, H., and Su, M. (2022). Power oscillation suppression in multi-VSG grid with adaptive virtual inertia. Int. J. Electr. Power Energy Syst. 135, 107472. doi:10.1016/j.ijepes.2021.107472
Hauer, J., Demeure, C., and Scharf, L. (1990). Initial results in prony analysis of power system response signals. IEEE Trans. Power Syst. 5, 80–89. doi:10.1109/59.49090
Hua, Y., and Sarkar, T. (1990). Matrix pencil method for estimating parameters of exponentially damped/undamped sinusoids in noise. IEEE Trans. Acoust. 38, 814–824. doi:10.1109/29.56027
Huang, G.-B., Zhu, Q.-Y., and Siew, C.-K. (2006). Extreme learning machine: theory and applications. Neurocomputing 70, 489–501. doi:10.1016/j.neucom.2005.12.126
Huang, G.-B., Zhou, H., Ding, X., and Zhang, R. (2012). Extreme learning machine for regression and multiclass classification. IEEE Trans. Syst. Man. Cybern. B 42, 513–529. doi:10.1109/TSMCB.2011.2168604
Khan, M. A. H., Thomson, B., Debnath, R., Motayed, A., and Rao, M. V. (2020). Nanowire-based sensor array for detection of cross-sensitive gases using pca and machine learning algorithms. IEEE Sens. J. 20, 6020–6028. doi:10.1109/JSEN.2020.2972542
Li, N., Li, B., and Gao, L. (2020). Transient stability assessment of power system based on xgboost and factorization machine. IEEE Access 8, 28403–28414. doi:10.1109/access.2020.2969446
Lin, X., Zhang, H., Liu, P., and Malik, O. (2002). Wavelet based scheme for detection of torsional oscillation. IEEE Trans. Power Syst. 17, 1096–1101. doi:10.1109/TPWRS.2002.804962
Lu, Y., Cheung, Y.-M., and Tang, Y. Y. (2020). Bayes imbalance impact index: A measure of class imbalanced data set for classification problem. IEEE Trans. Neural Netw. Learn. Syst. 31, 3525–3539. doi:10.1109/TNNLS.2019.2944962
Ma, Y., Huang, Q., Gooi, H., Zhang, Z., Yang, X., and Wang, Y. (2022). Subsynchronous oscillation analysis using multisynchrosqueezing transform and dissipating energy flow method. IEEE Trans. Ind. Appl. 58, 3134–3141. doi:10.1109/TIA.2022.3149684
Miao, M., Sun, Y., and Yu, J. (2022). Deep sparse representation network for feature learning of vibration signals and its application in gearbox fault diagnosis. Knowl. − Based Syst. 240, 108116. doi:10.1016/j.knosys.2022.108116
Phan, D., Nguyen, N., Pathirana, P. N., Horne, M., Power, L., and Szmulewicz, D. (2020). A random forest approach for quantifying gait ataxia with truncal and peripheral measurements using multiple wearable sensors. IEEE Sens. J. 20, 723–734. doi:10.1109/JSEN.2019.2943879
Sarkar, P., and Chilukuri, M. V. (2021). “Study of sub-synchronous oscillation using time-frequency analysis in wind energy systems,” in 2021 IEEE 12th Energy Conversion Congress Exposition - Asia (ECCE-Asia), 1157–1162. doi:10.1109/ECCE-Asia49820.2021.9479407
Satheesh, R., Chakkungal, N., Rajan, S., Madhavan, M., and Alhelou, H. H. (2022). Identification of oscillatory modes in power system using deep learning approach. IEEE Access 10, 16556–16565. doi:10.1109/access.2022.3149472
Shair, J., Xie, X., Wang, L., Liu, W., He, J., and Liu, H. (2019a). Overview of emerging subsynchronous oscillations in practical wind power systems. Renew. Sustain. Energy Rev. 99, 159–168. doi:10.1016/j.rser.2018.09.047
Shair, J., Xie, X., and Yan, G. (2019b). Mitigating subsynchronous control interaction in wind power systems: Existing techniques and open challenges. Renew. Sustain. Energy Rev. 108, 330–346. doi:10.1016/j.rser.2019.04.003
Sun, D., Liu, H., Gao, S., Wu, L., Song, P., and Wang, X. (2020). Comparison of different virtual inertia control methods for inverter-based generators. J. Mod. Power Syst. Clean Energy 8, 768–777. doi:10.35833/mpce.2019.000330
Tong, R., Li, P., Lang, X., Liang, J., and Cao, M. (2021). A novel adaptive weighted kernel extreme learning machine algorithm and its application in wind turbine blade icing fault detection. Measurement 185, 110009. doi:10.1016/j.measurement.2021.110009
Tripathy, P., Srivastava, S. C., and Singh, S. N. (2011). A modified tls-esprit-based method for low-frequency mode identification in power systems utilizing synchrophasor measurements. IEEE Trans. Power Syst. 26, 719–727. doi:10.1109/tpwrs.2010.2055901
Wang, M., Chen, H., Yang, B., Zhao, X., Hu, L., Cai, Z., et al. (2017). Toward an optimal kernel extreme learning machine using a chaotic moth-flame optimization strategy with applications in medical diagnoses. Neurocomputing 267, 69–84. doi:10.1016/j.neucom.2017.04.060
Wang, S., Xu, Z., and Xing, F. (2019). Application of bypass damping filter in suppressing subsynchronous resonance of multi-generator series-compensated systems. Electr. Power Syst. Res. 168, 117–126. doi:10.1016/j.epsr.2018.11.010
Wang, Y., Wu, X., Li, Z., Xiao, X., Xie, X., and Wang, Y. (2020). Vector-fitting-based quantitative ssci analysis for series-compensated wind power systems. IET Renew. Power Gener. 14, 3023–3034. doi:10.1049/iet-rpg.2020.0064
Wang, Y., Jiang, X., Xie, X., Yang, X., and Xiao, X. (2021). Identifying sources of subsynchronous resonance using wide-area phasor measurements. IEEE Trans. Power Deliv. 36, 3242–3254. doi:10.1109/TPWRD.2020.3037289
Xie, X., Zhang, X., Liu, H., Liu, H., Li, Y., and Zhang, C. (2017). Characteristic analysis of subsynchronous resonance in practical wind farms connected to series-compensated transmissions. IEEE Trans. Energy Convers. 32, 1117–1126. doi:10.1109/tec.2017.2676024
Yadav, R., Raj, S., and Pradhan, A. K. (2019). Real-time event classification in power system with renewables using kernel density estimation and deep neural network. IEEE Trans. Smart Grid 10, 6849–6859. doi:10.1109/TSG.2019.2912350
Yang, X., Zhang, J., Xie, X., Xiao, X., Gao, B., and Wang, Y. (2020). Interpolated dft-based identification of sub-synchronous oscillation parameters using synchrophasor data. IEEE Trans. Smart Grid 11, 2662–2675. doi:10.1109/TSG.2019.2959811
Zhang, Y., Tang, B., and Xiao, X. (2016). Timefrequency interpretation of multifrequency signal from rotating machinery using an improved hilberthuang transform. Measurement 82, 221–239. doi:10.1016/j.measurement.2016.01.001
Zhang, X., Xie, X., Shair, J., Liu, H., Li, Y., and Li, Y. (2020). A grid-side subsynchronous damping controller to mitigate unstable SSCI and its hardware-in-the-loop tests. IEEE Trans. Sustain. Energy 11, 1548–1558. doi:10.1109/tste.2019.2930289
Zidi, S., Moulahi, T., and Alaya, B. (2018). Fault detection in wireless sensor networks through svm classifier. IEEE Sens. J. 18, 340–347. doi:10.1109/JSEN.2017.2771226
Keywords: subsynchronous oscillations, detection, cycle, feature extraction, weighted kernel extreme learning machine
Citation: Wang L, Li T, Fan H, Hu X, Yang L and Yang X (2022) Subsynchronous oscillation detection via cycle-based feature extraction and weighted kernel extreme learning machine. Front. Energy Res. 10:964811. doi: 10.3389/fenrg.2022.964811
Received: 09 June 2022; Accepted: 29 August 2022;
Published: 20 September 2022.
Edited by:
Haris M. Khalid, Higher Colleges of Technology, United Arab EmiratesCopyright © 2022 Wang, Li, Fan, Hu, Yang and Yang. This is an open-access article distributed under the terms of the Creative Commons Attribution License (CC BY). The use, distribution or reproduction in other forums is permitted, provided the original author(s) and the copyright owner(s) are credited and that the original publication in this journal is cited, in accordance with accepted academic practice. No use, distribution or reproduction is permitted which does not comply with these terms.
*Correspondence: Xiaomei Yang, eWFuZ3hpYW9tZWlAc2N1LmVkdS5jbg==