 Ali Burhan Khan
 Arshian Sharif
 Muhammad Saif Ul Islam
 Anis Ali
 Muhammad Fareed
 Maria Zulfaqar
95% of researchers rate our articles as excellent or good
Learn more about the work of our research integrity team to safeguard the quality of each article we publish.
Find out more
ORIGINAL RESEARCH article
Front. Energy Res. , 26 September 2022
Sec. Sustainable Energy Systems
Volume 10 - 2022 | https://doi.org/10.3389/fenrg.2022.962017
The motivation behind conducting this research is to study the association between oil prices and Islamic and conventional stock indexes’ performance in the Malaysian market during COVID-19 using the wavelet analysis technique. The daily data on selected variables were collected from 1 January 2020, to 10 June 2021. Empirical investigation was made with wavelet analysis along with the Toda-Yamamoto test. The results revealed the significant response of both indexes to the oil price. Such response was negative for the short- and medium terms; however, it became positive in the long run. Our research has several important implications and recommendations for asset managers and policymakers. Policymakers and regulators should promote awareness and adopt effective action plans to minimize the risk of change in oil prices during the COVID-19 period. This research will enable investors, scholars, and policymakers to improve their current structure and prepare them for any potential future crisis.
Petroleum is considered a vital energy source (Gao et al., 2014). Substantial evidence regarding oil price and stock price relationships has attracted academic researchers, investors, and policymakers (Mishra et al., 2019). Such evidence also has empirical support in the existing literature (Pal & Mitra, 2017; Kumar, 2019; Ehouman, 2020; Hashmi et al., 2021; Jiang & Liu, 2021; Tiwari et al., 2021). The economic justification of finance practitioners and researchers related to the stock prices and oil connection depends on the argument that changes in the prices of oil impact stock prices through corporate gains and cash flows. In addition, the underlying economic theory argues that changes in prices of oil effects stock prices via production cost. The theory of equity valuation supports this argument. This theory states that current stock prices represent the present value of projected future cash flows. (Jouini, 2013).
Previous studies claim that the prices of oil influence economic situations such as interest rates (Apergis & Miller, 2009), inflation (Sadorsky, 1999; Park & Ratti, 2008), the exchange rate (Olayeni et al., 2020), and global economic activity (Olayeni et al., 2020; Dong et al., 2019). These findings allow us to speculate on the favorable impact of oil prices on stock prices via corporate cash flows, discount rate (Jouini, 2013), and production cost (Mishra et al., 2019). The existing literature divides countries based on whether they import or export oil when analyzing the connection between oil prices and stock performance (Wang et al., 2013; Arshad, 2017). Furthermore, in Park and Ratti’s (2008) study, the influence of oil prices on stock prices in oil-importing European countries was found to be low.
Although there are studies (Sadorsky, 1999; Ciner, 2001; Basher & Sadorsky, 2006; Elyasiani, Mansur & Odusami, 2011; Cunado and de Gracia, 2014; Diaz et al., 2016; Diaz and deGracia, 2017; Wei & Guo, 2017; Tiwari et al., 2018) which analyzed the association of oil prices and stock prices, their findings are not unanimous. The most recent work also includes several studies (Bildirici & Badur, 2019; Lv, Lien & Yu, 2020; Alamgir & Amin, 2021; Ivanovski & Hailemariam, 2021; Kang, Gracia & Ratti, 2021; Wang, Umar, Afshan & Haouas, 2021), which analyzed the dynamics of oil-stock price association. On one side, both could have a negative correlation (Ghouri, 2006; Miller and Ratti, 2009) due to the adverse influence of oil prices on real output (Jouini, 2013). In contrast, an increase in the prices of oil can increase stock prices (Zhu, Li & Yu, 2011; Li, Zhu & Yu, 2012) due to its positive correlation with global (Dong et al., 2019) and domestic economic activities (Raza et al., 2018). The negative or positive stimulus of prices of oil on stock prices also depends on country-specific characteristics (Cong, Wei, Jiao & Fan, 2008; Park & Ratti, 2008). Such characteristics include a country’s own firm circumstances that reflect stock prices. These characteristics can be the behavior of a specific sector’s stock return. Another part of the existing literature also claims that stock returns do not respond to changes in oil prices (Apergis & Miller, 2009).
The articles on the link between oil and stock prices were engrossed in both emerging (Gupta & Modise, 2013) and developed markets (Cunado and Gracia, 2003; Ghouri, 2006; Sadorsky, 2008). Ghouri (2006) postulated an adverse effect of prices of oil on the stock returns of oil organizations in the US in the context of advanced countries. Studies have also led to explain stock returns and oil price links in the context of other areas such as Europe (Cunado and Gracia, 2003) and GCC countries (Hammoudeh & Choi, 2007).
In addition to conventional stocks, Islamic stocks are now becoming the focus of the literature due to their innovative features (Mishra, Sharif, Khuntia, Meo & Khan, 2019). In Malaysia, Hussin et al. (2012) revealed a significant co-integrating connection between prices of oil and Islamic stock prices. Mishra et al. (2019) reported cointegration between the performance of the Dow Jones Islamic Stock Index and global crude oil prices from 1 January 1996 to 13 April 2018. Arshad (2017), having a sample of top 10 oil-importing countries, found the co-movement between the volatility in the prices of oil and volatility in the Islamic stock market. The Islamic stock market’s significant reliance on the real economy caused such co-movement. In addition, higher volatility and lower efficiency in the merging market’s Islamic stock markets were noticed than in developed countries’ Islamic markets.
In the Malaysian context, Abdullah, Saiti & Masih (2016) argued that Malaysia has the largest and most stable Islamic capital market. At the sectoral level, Badeeb and Lean (2018) study, by applying the nonlinear ARDL methodology, found the frail linkage between the prices of oil and the performance of Islamic stocks. However, the reaction and nature of sensitivity of prices of stock toward oil differed, regarding different sectors. Narayan et al. (2019) collected the monthly data on 2,178 Islamic stocks and reported that 32% of these stocks react significantly to changes in oil prices. At the index level, Ftiti and Hadhri (2019) selected nine Dow-Jones Islamic Market indexes. With the help of a nonlinear non-parametric approach, they revealed that oil prices could be used to forecast Islamic stock returns. Similarly, in the case of BRICS countries, Hassan et al. (2019) analyzed the correlation between prices of oil and Islamic index’s performance. They reported a high correlation among these two variables for China and India during the period of the global financial crisis. However, Hassan et al. (2019) found no such association in the Brazilian and Russian markets. They advised investors to choose lower weights for oil and BRIC Islamic indexes for optimal minimum-variance portfolios than the conventional indexes. In the African context, Abdulkarim et al. (2020) analyzed the connection between the prices of oil and Islamic stock indexes. They established a long-term cointegrating association between oil and certain African Islamic indices. Adekoya et al. (2021) observed that Islamic stocks exhibited greater immunity against COVID-19 than conventional stocks.
After the emergence of COVID-19 in China (Abuzayed & Al-Fayoumi, 2021), within 1 month, it caused almost one million infections and 60,000 deaths in China alone (Worldometer, 2021). On 25th January, the first case of COVID-19 was reported in Malaysia (see, for instance, Elengoe, 2020; Tang, 2020). On 20 February 2020, the “World Health Organization” (WHO) declared COVID-19 a global emergency and then a global pandemic on 11 March 2020, based on the extent and trajectory of the spread (Ali et al., 2020). COVID-19 quickly transformed into a global meltdown from a provincial health scare.
COVID-19 created a negative impact on the global financial market. It reduced almost a quarter of global wealth within a month. S&P 500 witnessed a 30 percent decline in 16 days of trading (Ali et al., 2020). In the case of developed markets, the US faced a 32 percent decline in stock prices, UK 27.9 percent, and Italy bared 39.3 downfalls. In this scenario, emerging markets are not exceptions (Salisu et al., 2020). There was a 40.5 percent decline in Brazilian stock, in Russia 24.2 percent, and in China it was 10.1 percent. Globally, stock markets have become highly volatile since the COVID-19 outbreak and have suffered a loss of more than USD 9 trillion. Such volatility in the stock market is also due to panic sold out by investors (World Economic Forum, 2020).
As the pandemic of COVID-19 raged on, oil prices plummeted by 30%, the steepest decrease compared to the Gulf War held in 1991 (Schneider & Domonoske, 2020). The decline in oil prices was due to the failure of negotiation between OPEC and Russia in the context of declining oil demand (Abuzayed & Al-Fayoumi, 2021). In April 2020, however, OPEC and Russia agreed to restrict the petroleum output on the basis of per day by around 9.7 million barrels. However, such a bargain is not sufficient to counteract the COVID-19 destruction of demand (Reuters, 2020).
Financial markets suffered a much faster and more dramatic impact from COVID-19 (Abuzayed & Al-Fayoumi, 2021). The COVID-19 financial impacts have been compared in the literature to the global financial crisis of 2008 (ArshianSharif et al., 2020), which have been widely discussed in the existing literature in the context of spillover effect (Yarovaya et al., 2016), contagion (Kenourgios et al., 2011; Dimitriou et al., 2013), integration (Srivastava et al., 2015), and decoupling (Bekiros, 2014). In GCC countries, one study applied the DCC- GARCH model (see e.g., Abuzayed and Al-Fayomi, 2021) and found that oil price systematic risk on GCC countries’ stock market was greater during the COVID-19 time than that before COVID-19.
Studies addressing the interconnection between stock and oil prices are dedicated to oil and conventional stock compared to oil and Islamic stocks. However, Islamic stocks, due to their distinct features, rapid expansion, and innovation, prove themselves a better candidate for investment diversification. Fundamentally, Islamic stock is different from conventional stocks. Similar to this, Islamic stocks must pass a tight screening process. Islamic stock issuing firms cannot involve in businesses related to gambling and in production of tobacco and alcohol. In addition, Islamic stock should fulfill the conditions of Islamic finance, which is asset-based. In contrast, conventional finance is interest-based (Mishra et al., 2019).
Most of the previous studies adopted simple linear models or empirical approaches to address the association between oil prices and stock prices (for instance, Hashmi et al., 2022; Saha 2022). Time-series econometric models that are commonly used provide information about time but disregard the critical dimension of frequency (Gao et al., 2014). Hidden frequency information also causes the nonlinear relationship among variables and complicates the time-series analysis. Therefore, concealed information in a common time-frequency domain is crucial to locate. Such a domain can enable us to follow time information to track changes linked to distinct frequency components of the original time series (Huang et al., 2016). So, to incorporate the impact of time and frequency, we applied the wavelet method. According to Power and Turvey (2010), the wavelet approach incorporates the impact of both time and frequency. It can also detect short-term regimes or high-frequency components (Ivanov et al., 1996).
Previous research applied VAR (Cong et al., 2008; Dagher & El Hariri, 2013), GARCH, exponential GARCH (EGARCH) models (Narayan et al., 2008), and seemingly unrelated regression (Arouri & Rault, 2012), which are based on linear regression. These methods apply a holistic perspective by only focusing on the time perspective (Huang et al., 2016). In addition to analyzing the linear connections among oil and stock prices, studies also examined the combination of linear and nonlinear or asymmetric relationships (Arouri & Nguyen, 2010; Arouri, 2011). All these studies, which have been conducted with traditional linear and nonlinear models, have no consensus on the oil and stock price relationship. Salisu et al. (2020) proposed that the oil–stock relationship should be investigated separately. It is because oil prices followed the trend of COVID-19, and stock prices faced a major downfall due to the COVID-19 pandemic. Therefore, this study aims to analyze the connection of oil with Islamic and conventional stock indexes of Malaysia, which is ignored in the previous literature. This attempt is made with an advanced and robust technique named the wavelet approach.
In the following respects, this work contributes to the literature. First, this study aims to explore the effect of oil prices on the Islamic and conventional stock index performance. Second, this research ponders the COVID-19 pandemic time period to further examine the major downfall of oil and stock prices during COVID-19. Lastly, previous studies adopted simple linear models or empirical approach to address the connection between oil and stock prices. However, this study used an advanced and robust technique named the wavelet approach.
The oil price is selected as an independent variable in this research, whereas the Islamic and conventional stock indexes are selected as dependent variables. West Texas Intermediate (WTI) crude oil prices are used to measure oil prices. The FTSE Bursa Malaysia Hijrah Shariah Index is taken as a proxy of Islamic stock indexed. Conventional index performance is proxied through the FTSE Malaysia KLCI Index. The data period selected in this study is from 1 January 2020 to 10 June 2021. The empirical analysis is carried out using the continuous wavelet transformation (CWT) method, which has been used in earlier studies (Raza et al., 2018; Dong et al., 2019; Sharrif et al., 2020). The data on selected variables are collected from the Macrotrends official website. To make the findings of this study robust, we converted the data into logarithmic difference series to obtain return series.
The wavelet analysis technique, which is a widely used approach for detecting relationships at various frequencies, was introduced in the mid-1980s as a substitute analysis for Fourier. The fundamental problem of the analysis of Fourier is it ignores the time-localized information, making it impossible to locate structural breaks or detect transitory connections (Aguiar-Conraria & Soares, 2011). On the other hand, the wavelet transforms the time series into basic wavelets that are extended and translated copies of a certain mother wavelet located both in the time and frequency domains. As a result, the series widens into a time-frequency domain, which enables researchers to intuitively detect the series’ oscillations. Wavelet analysis is also useful for stationary or non-stationary series, whereas analysis of Fourier is only appropriate for stationary series (Rouef and Von Sachs, 2011).
There are two distinct kinds of wavelet transforms: “discrete wavelet transforms” (DWT) and “continuous wavelet transforms” (CWT). To break down the series in question into wavelets, we use the CWT developed by Aguiar-Conraria et al. (2012) and Aguiar-Conraria and Soares (2011). The reason behind the selection of continuous wavelet transforms is it can extract features that simplify the resources necessary to deliver relevant information. In addition, it delivers relevant information and executes the desired job. On the other hand, DWT only decreases the noise and compresses the data. Therefore, CWT is more convenient than full-sized sample data since it uses a simplified version of the data (Chang et al., 2013).
As discussed in the introduction, the earlier literature studied oil–stock price nexuses using traditional econometrics approaches. The findings of the previous literature (Cong et al., 2008; Narayan et al., 2008; Dagher & El Hariri, 2013) are contradictory because of the absence of frequency information in existing time-series research. Therefore, the CWT is best suited to handle information hidden in the time and frequency domains since it can split a dataset into discrete holding periods and give the real dynamics and co-movements of the variables in question. The key benefit of the CWT is that it accounts for heterogeneity in investment horizons by taking into account the data’s temporal and frequency domain features (Rahim & Masih, 2016; Haque et al., 2018). The CWT
Here, u refers to the time domain, and s refers to its position in the frequency domain. According to Torrence and Webster (1999), “the wavelet coherence of two time series u and s could be described as follows:
where S is a smoothing operator, s indicates wavelet scale, W
The basic characteristics of the data series and correlation results are displayed in Table 1.
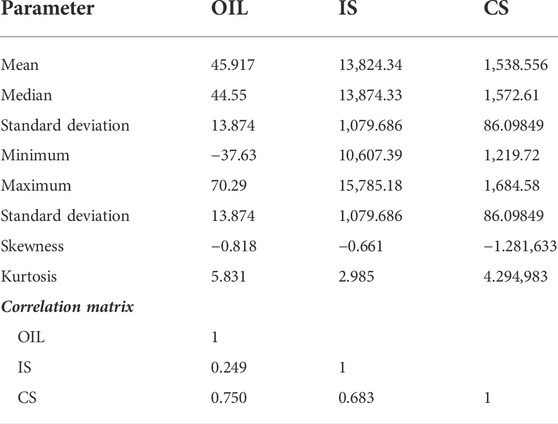
TABLE 1. Descriptive statistics and correlation matrix.
According to the results reported in Table 1, the mean values of OIL, IS, and CS are 45.917, 13,824.34, and 1,538.556, respectively. In addition, the minimum values of OIL, IS, and CS are −37.63, 10607.39, and 1219.72, respectively. Furthermore, the maximum values of OIL, IS, and CS are 70.29, 15785.18, and 1,684.58, respectively. The correlation results indicate the highest positive association of 0.750 among CS and OIL. At the same time, the lowest correlation was observed between IS and OIL.
In the domain of time, at first, we conducted a cointegration test to extract any association between oil prices and Islamic stock and conventional stock indexes. Table 2 shows the results of stationarity tests which include the “augmented Dickey-Fuller” (ADF) (Dickey & Fuller, 1979) and “Phillips–Perron” (PP) tests (Phillips & Perron, 1988). The lag-length criteria are chosen in accordance with the “Schwartz information criterion” (SIC), with a maximum lag length of 16. Both tests demonstrate that the underlying series have unit roots at the level but become stationary at the first difference.
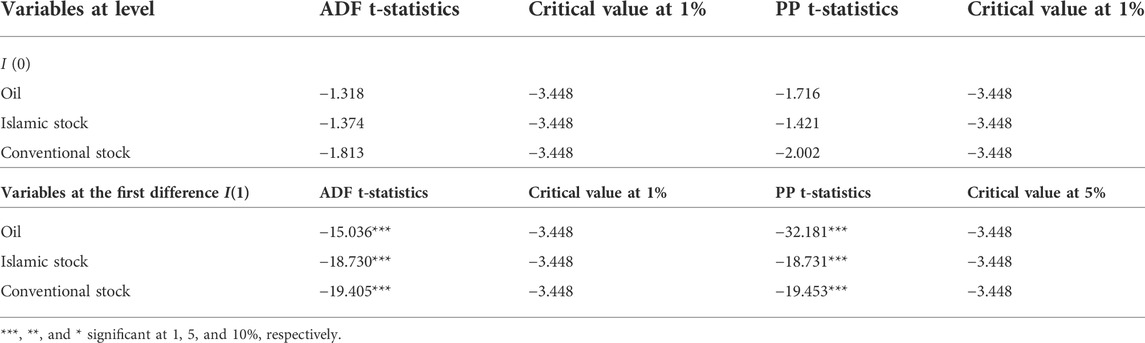
TABLE 2. Unit root tests.
All of the underlying variables in Table 2 are of I (1). Before undertaking wavelet analysis, we employed the trace test developed by Johansen (1991). According to the bivariate analysis results reported in Table 3, oil price is co-integrated with the Islamic and conventional stocks in the long run. The H0 of no cointegration is rejected because the test statistics are above the threshold values.
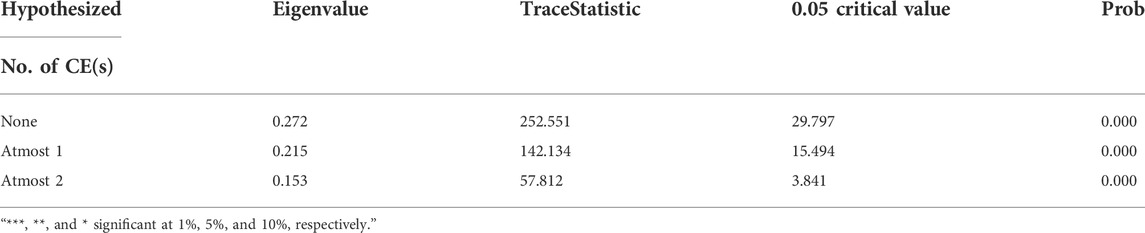
TABLE 3. Cointegration results.
We conducted a causality test in accordance with Toda and Yamamoto (1995) to determine the influence of changes in the price of oil on Islamic and conventional stock indexes.
Granger’s (1969) conventional causality test was used to estimate a vector autoregressive (VAR) (K) model. K is the optimal lag length(s) in this case; nevertheless, it is dependent on the lag length in the VAR model and is constrained by the stationarity assumption (Granger, 1986). Thus, to improve the Granger causality test’s reliability, we applied the Toda-Yamamoto causality technique that is not subject to pre-test biases (Soytas & Sari, 2006). According to Le and Chang (2015), the Toda-Yamamoto causality technique is valid, irrespective of the cointegration and integration properties of the system. An augmented VAR (K + dmax) is estimated under the Yamamoto causality test, where dmax stands for the maximum cointegration order of the selected variables.
As per Table 4, given the significance of the MWALD statistics, we may reject the “Granger non-causality” among oil and conventional and Islamic stock prices. Policymakers should take note of the findings here since the rejection of the null hypothesis of “Granger non-causality” indicates that shifts in oil prices have a long-term impact on both Islamic and conventional stock markets. These results are consistent with those of Mishra et al. (2019) research, which reported a cointegration association between oil and Islamic stock prices. Similarly, with respect to conventional stocks, Park and Ratti (2008) found the cointegration between oil prices and stock prices in the market of the UK, Italy, and Finland.
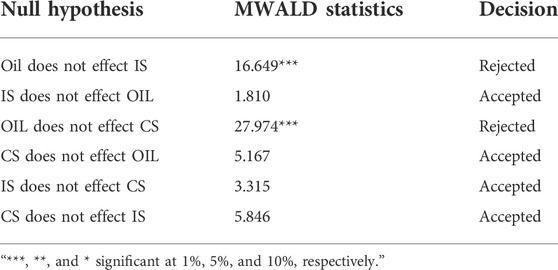
TABLE 4. Toda-Yamamoto test results.
We examined the co-movement of oil, Islamic, and conventional stock indexes in the time-frequency domain after proving cointegration and causation in the time series, which demonstrated that they were all related. This was accomplished by producing a wavelet power spectrum for the variables in question. This analysis was carried out with the assistance of Govhier and Grinsted’s “bivariate” package (for the R environment). Part of the cone of influence is shown by the white curve in Figure 1; an edge below the wavelet power spectrum is affected by the discontinuity, making the spectrum hard to interpret. The dark black contours exhibit the significance level of 5 percent; here, the significance values are generated with the help of Monte Carlo simulations.
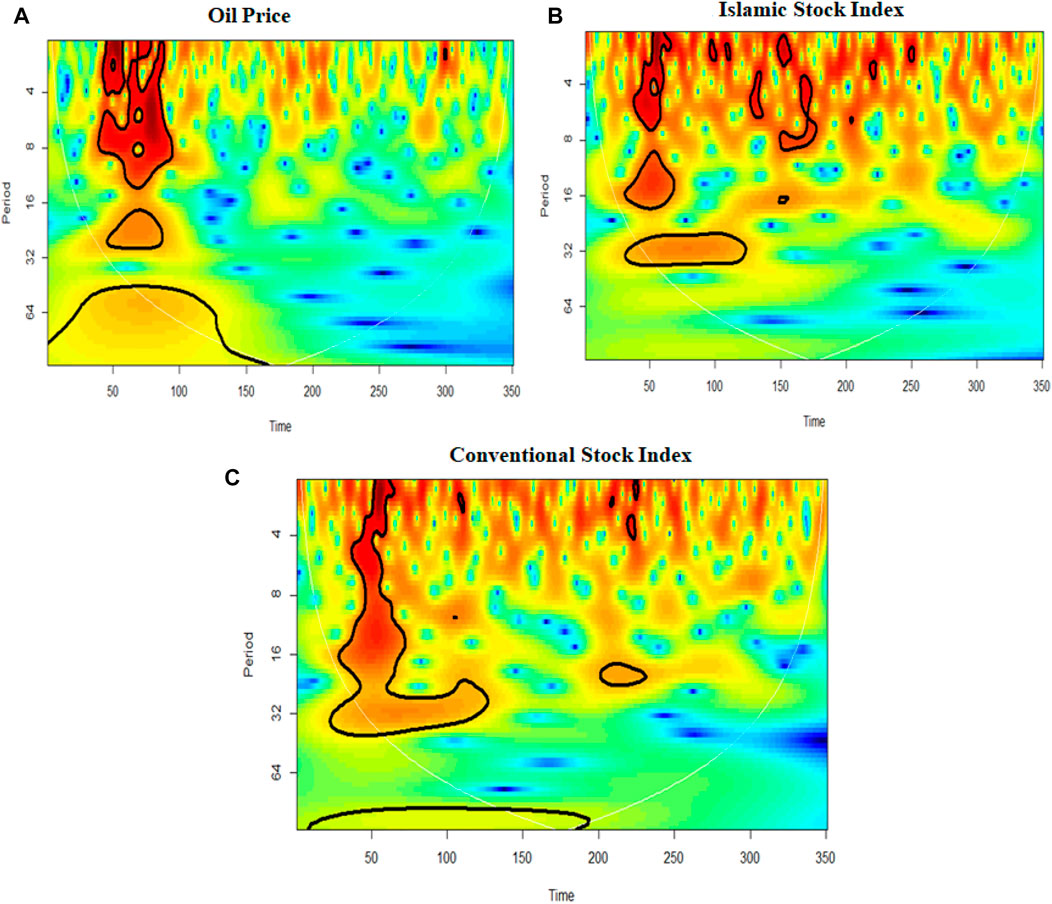
FIGURE 1. “Wavelet power spectrum” for the oil price, and Islamic and conventional stock indexes. The days are represented along the horizontal axis, while the periods are shown along the vertical axis. The white line is referred to as the “cone of influence.” The area below the white line is affected because of discontinuity, therefore being difficult to interpret. The black contour part of the “wavelet power spectrum” indicates the 5% significance level. The color coding for power varies between red (high power) and blue (low power) colors.
The CWT plots for oil prices, Islamic stock index, and conventional stock index are expressed in Figure 1. The CWT explains the movements of each selected variable in the time scales and frequency domain (ArshianSharif et al., 2020). For the Malaysian market, significant volatility is clearly visible as a response to the emergence of COVID-19 cases in the Malaysian market. Such volatility persisted for short-, medium-, long-, and very long-term periods. However, the pattern of volatility was different in these periods. Islamic stock prices showed greater volatility for an extended period of time. The reason for the difference between the capricious conventional and Islamic stock prices is the unique nature of Islamic stocks with respect to screening criteria. Normally in the financial crisis period, stock markets follow an irrational pattern (Abdullahi, 2021), which is evident from the results of this study. The oil prices exhibited significant short-, medium-, and long-term volatility. It was mentioned by Veza et al. (2021) that the COVID-19 impact, in the shape of movement restriction, was severe for the fuel industry, which saw a historical price drop.
Figure 2 plots the wavelet coherence among the oil prices, and Islamic and conventional stock indexes. Here, most of the arrows point to the left and down, indicating the anticyclical effect between the oil conventional stock index and the Islamic stock index where oil prices are leading. Oil exporter countries (such as Malaysia) are experiencing an unprecedented double blow due to COVID-19. First, the global economic contraction and second, the oil market collapse in April 2020 (Engebretsen & Anderson, 2020). However, according to Figure 2, in the short run, the influence of the oil price collapse is more on the conventional stock index as compared to the Islamic stock indexes. As per Keh et al. (2021), in the Malaysian market, oil prices’ collapse due to COVID-19 shocks impacted the whole economy. Such an adverse effect on the economy, in terms of the adverse stock market performance, is evident from the results of this study.
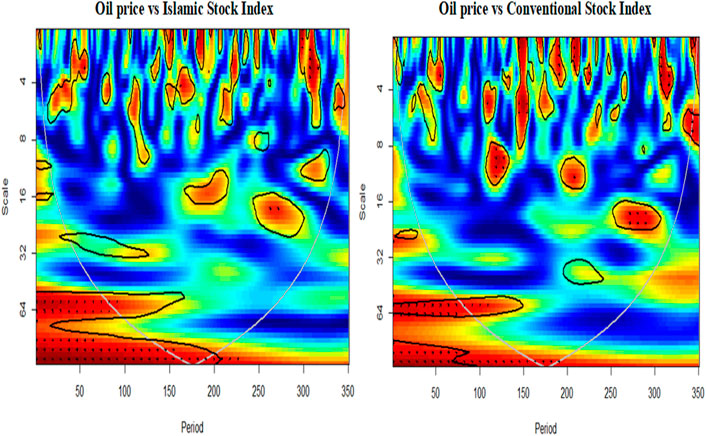
FIGURE 2. “Wavelet coherence” for pairs of oil prices with Islamic and conventional stock indexes. The horizontal axis represents the period, whereas the vertical axis indicates the scale. The white line is called the “cone of influence”. The area below the white line is affected because of discontinuity, therefore being hard to explain. The degree of correlation is exhibited by a color. The hotter color shows the greater absolute correlation value.
A significant link between stock and oil prices at the beginning of the data period can be observed in the shape of little red Islands at very short-term intervals, a time when the first COVID-19 case was identified in Malaysia. One large red Island (Islamic stock) and two relatively small Islands (conventional index) can be observed in the short-run during the February and March period. Here, oil pricing is leading by having a negative association with stock prices. During this time interval, Malaysian cases took a rise in February 2020 due to religious event’s gatherings (Tang, 2020) and the subsequent imposition of the Movement Control Order on 18 March 2020.
In the medium run, the influence of oil prices was observed on both stock indexes, specifically during February 2021. It was the period when first time during the pandemic period, oil prices adopted an increasing trend by reaching 63.53 per barrel on 25 February 2021, from 53.55 per barrel on 1 February 2021. In this case, as evident from Figure 2, the Islamic and conventional indexes responded negatively. The Islamic index response was significant for short-term and medium-term periods, whereas the conventional index response was mainly short-term. At the end of this sample (June 2021), the dark red zone indicates the significant association between oil, conventional, and Islamic stock indexes. It was the period when the total lockdown was imposed in Malaysia. In the very long run, a significant positive link was also observed between oil prices and both stock market indexes. It was around phase 4 (29 April 2020–3 May 2020) of MCO in Malaysia, and just 8 cases were reported in this period (Ministry of Health Malaysia, 2021).
In a nutshell, the current study observed medium-, short-, and long-run effects on both conventional and Islamic indexes. The long-run influence of oil prices on selected indexes is positive due to Malaysia’s oil-export-based economy. The findings of the current study corroborate the claim of Jong et al. (2021) that variations in international crude oil prices put a substantial impact on various areas of the financial sector, particularly on the stock market. This study observed the intensity of the lead-lag association between oil and prices of stock differs at the different frequency levels. Similar conclusions were testified by Albulescu et al’s. (2021) study. Hence, investors in both developed and developing countries are vulnerable to the effects of a sudden increase in the price of crude oil due to its impact on “monetary policy instruments, inflation, corporate income, and other economic activities”. Therefore, these findings support the equity valuation theory argument which lends credence to the contention that “interest rate, inflation, production cost, aggregate demand, and investor confidence” all play a role in determining stock prices.
The present research studies the interconnection between the fluctuations in global crude oil prices on conventional and Islamic stock performances in Malaysia. For this purpose, daily data on oil, and conventional and Islamic stock indexes were collected from 1 January 2020 to 10 June 2021. An advanced econometric technique named wavelet analysis was applied in this research, which provides information in both the time and frequency domains. Apart from that, the Toda-Yamamoto test was also applied to examine long-term causality.
Crude oil price fluctuations have a substantial impact on the production costs and profitability of industries. Since Malaysia is an oil-exporting country, changes in oil prices can impact its revenues and financial market performance. Considering this point of view, we analyzed the response of Islamic and conventional stock performance toward oil prices. In the short run, the response was negative due to the higher volatility in the market, consequential due to the emergence of the COVID-19 crisis. However, as the COVID-19 crisis prolonged, a positive relationship between oil and Islamic and conventional stock prices was observed.
From the empirical investigation, it has been found that oil prices have significant influence on both selected indexes. However, such influence differs regarding different frequency levels. As it is now well documented that COVID-19 has impaired the global economy, the current study will educate investors, scholars, and policymakers about the consequence of COVID-19 on the financial market of Malaysia. Furthermore, it is important for the Islamic finance industry to understand how Islamic stock prices behaved during COVID-19. It is important for the Islamic finance industry to understand how Islamic stock prices behaved during COVID-19. It is also strongly recommended that market participants consistently engage in prudent risk management procedures and choose appropriate hedging instruments in order to take preventative actions to ensure the stability of Islamic stock markets. As a future recommendation, the current study scope can be extended to other ASEAN countries. In addition, the data period of the current study can be extended to the pre-COVID-19 era. Moreover, in future, a comparative analysis can be made of the stock and oil price association regarding the pre- and post-COVID-19 periods.
The original contributions presented in the study are included in the article/Supplementary Material; further inquiries can be directed to the corresponding author.
AK: article drafting and literature review. AS: data analysis. MS: data collection. AA: methods and formatting. MF: discussion and conclusion. MZ: proofreading.
The authors declare that the research was conducted in the absence of any commercial or financial relationships that could be construed as a potential conflict of interest.
The Reviewer WM declared a shared affiliation with the authors MF and MS to the handling Editor at the time of review.
All claims expressed in this article are solely those of the authors and do not necessarily represent those of their affiliated organizations, or those of the publisher, the editors, and the reviewers. Any product that may be evaluated in this article, or claim that may be made by its manufacturer, is not guaranteed or endorsed by the publisher.
Abdulkarim, F. M., Akinlaso, M. I., Hamid, B. A., and Ali, H. S. (2020). The nexus between oil price and Islamic stock markets in Africa: A wavelet and multivariate-GARCH approach. Borsa Istanb. Rev. 20 (2), 108–120. doi:10.1016/j.bir.2019.11.001
Abdullah, A. M., Saiti, B., and Masih, M. (2016). The impact of crude oil price on Islamic stock indices of South East Asian countries: Evidence from MGARCH-DCC and wavelet approaches. Borsa Istanb. Rev. 16 (4), 219–232. doi:10.1016/j.bir.2015.12.002
Abdullahi, S. I. (2021). Islamic equities and COVID-19 pandemic: Measuring islamic stock indices correlation and volatility in period of crisis. Islam. Econ. Stud. 29, 50–66. doi:10.1108/IES-09-2020-0037
Abuzayed, B., and Al-Fayoumi, N. (2021). Risk spillover from crude oil prices to GCC stock market returns: New evidence during the COVID-19 outbreak. North Am. J. Econ. Finance 58, 101476. doi:10.1016/j.najef.2021.101476
Adekoya, O. B., Oliyide, J. A., and Tiwari, A. K. (2021). Risk transmissions between sectoral Islamic and conventional stock markets during COVID-19 pandemic: What matters more between actual COVID-19 occurrence and speculative and sentiment factors? Borsa Istanb. Rev. 22, 363–376. doi:10.1016/j.bir.2021.06.002
Aguiar-Conraria, L., and Soares, M. J. (2011). Oil and the macroeconomy: Using wavelets to analyze old issues. Empir. Econ. 40 (3), 645–655. doi:10.1007/s00181-010-0371-x
Aguiar‐Conraria, L., Magalhães, P. C., and Soares, M. J. (2012). Cycles in politics: Wavelet analysis of political time series. Am. J. Political Sci. 56 (2), 500–518. doi:10.1111/j.1540-5907.2011.00566.x
Alamgir, F., and Amin, S. B. (2021). The nexus between oil price and stock market: Evidence from South Asia. Energy Rep. 7, 693–703. doi:10.1016/j.egyr.2021.01.027
Albulescu, C., Mina, M., and Oros, C. (2021). Oil-US stock market nexus: Some insights about the new coronavirus crisis. Econ. Bull. doi:10.48550/arXiv.2104.05273
Ali, M., Alam, N., and Rizvi, S. A. R. (2020). Coronavirus (COVID-19)—an epidemic or pandemic for financial markets. J. Behav. Exp. Finance 27, 100341. doi:10.1016/j.jbef.2020.100341
Apergis, N., and Miller, S. M. (2009). Do structural oil-market shocks affect stock prices? Energy Econ. 31 (4), 569–575. doi:10.1016/j.eneco.2009.03.001
Arouri, M. E. H. (2011). Does crude oil move stock markets in Europe? A sector investigation. Econ. Model. 28 (4), 1716–1725. doi:10.1016/j.econmod.2011.02.039
Arouri, M. E. H., and Nguyen, D. K. (2010). Oil prices, stock markets and portfolio investment: Evidence from sector analysis in Europe over the last decade. Energy Policy 38 (8), 4528–4539. doi:10.1016/j.enpol.2010.04.007
Arouri, M. E. H., and Rault, C. (2012). Oil prices and stock markets in GCC countries: Empirical evidence from panel analysis. Int. J. Fin. Econ. 17 (3), 242–253. doi:10.1002/ijfe.443
Arshad, S. (2017). Analysing the relationship between oil prices and islamic stock markets. Econ. Pap. 36 (4), 429–443. doi:10.1111/1759-3441.12186
ArshianSharif, A., Aloui, C., and Yarovaya, L. (2020). COVID-19 pandemic, oil prices, stock market, geopolitical risk and policy uncertainty nexus in the US economy: Fresh evidence from the wavelet-based approach. Int. Rev. Financial Analysis 70, 101496. doi:10.1016/j.irfa.2020.101496
Badeeb, R. A., and Lean, H. H. (2018). Asymmetric impact of oil price on Islamic sectoral stocks. Energy Econ. 71, 128–139. doi:10.1016/j.eneco.2017.11.012
Basher, S. A., and Sadorsky, P. (2006). Oil price risk and emerging stock markets. Glob. Finance J. 17 (2), 224–251. doi:10.1016/j.gfj.2006.04.001
Bekiros, S. D. (2014). Contagion, decoupling and the spillover effects of the US financial crisis: Evidence from the BRIC markets. Int. Rev. Financial Analysis 33, 58–69. doi:10.1016/j.irfa.2013.07.007
Bildirici, M. E., and Badur, M. M. (2019). The effects of oil and gasoline prices on confidence and stock return of the energy companies for Turkey and the US. Energy 173, 1234–1241. doi:10.1016/j.energy.2019.02.137
Chang, T., Li, X., Miller, S. M., Balcilar, M., and Gupta, R. (2013). The Co-movement and causality between the US real estate and stock markets in the time and frequency domains. Int. Rev. Econ. Finance 38, 220–233.
Ciner, C. (2001). Energy shocks and financial markets: Nonlinear linkages. Stud. Nonlinear Dyn. Econ. 5 (3). doi:10.2202/1558-3708.1079
Cong, R.-G., Wei, Y. M., Jiao, J. L., and Fan, Y. (2008). Relationships between oil price shocks and stock market: An empirical analysis from China. Energy Policy 36 (9), 3544–3553. doi:10.1016/j.enpol.2008.06.006
Cunado, J., and de Gracia, F. P. (2014). Oil price shocks and stock market returns: Evidence for some European countries. Energy Econ. 42, 365–377. doi:10.1016/j.eneco.2013.10.017
Cunado, J., and Gracia, F. P. de. (2003). Do oil price shocks matter? Evidence for some European countries. Energy Econ. 25 (2), 137–154. doi:10.1016/s0140-9883(02)00099-3
Dagher, L., and El Hariri, S. (2013). The impact of global oil price shocks on the Lebanese stock market. Energy 63, 366–374. doi:10.1016/j.energy.2013.10.012
Diaz, E. M., and de Gracia, F. P. (2017). Oil price shocks and stock returns of oil and gas corporations. Finance Res. Lett. 20, 75–80. doi:10.1016/j.frl.2016.09.010
Diaz, E. M., Molero, J. C., and de Gracia, F. P. (2016). Oil price volatility and stock returns in the G7 economies. Energy Econ. 54, 417–430. doi:10.1016/j.eneco.2016.01.002
Dickey, D. A., and Fuller, W. A. (1979). Distribution of the estimators for autoregressive time series with a unit root. J. Am. Stat. Assoc. 74 (366), 427–431. doi:10.2307/2286348
Dimitriou, D., Kenourgios, D., and Simos, T. (2013). Global financial crisis and emerging stock market contagion: A multivariate FIAPARCH–DCC approach. Int. Rev. Financial Analysis 30, 46–56. doi:10.1016/j.irfa.2013.05.008
Dong, M., Chang, C.-P., Gong, Q., and Chu, Y. (2019). Revisiting global economic activity and crude oil prices: A wavelet analysis. Econ. Model. 78, 134–149. doi:10.1016/j.econmod.2018.08.012
Ehouman, Y. A. (2020). Volatility transmission between oil prices and banks’ stock prices as a new source of instability: Lessons from the United States experience. Econ. Model. 91, 198–217. doi:10.1016/j.econmod.2020.06.009
Elengoe, A. (2020). COVID-19 outbreak in Malaysia. Osong Public Health Res. Perspect. 11 (3), 93–100. doi:10.24171/j.phrp.2020.11.3.08
Elyasiani, E., Mansur, I., and Odusami, B. (2011). Oil price shocks and industry stock returns. Energy Econ. 33 (5), 966–974. doi:10.1016/j.eneco.2011.03.013
Engebretsen, R., and Anderson, C. (2020). The impact of coronavirus (COVID-19) and the global oil price shock on the fiscal position of oil-exporting developing countries. Mexico City: OECD.
Ftiti, Z., and Hadhri, S. (2019). Can economic policy uncertainty, oil prices, and investor sentiment predict islamic stock returns? A multi-scale perspective. Pacific-Basin Finance J. 53, 40–55. doi:10.1016/j.pacfin.2018.09.005
Gao, X., An, H., Fang, W., Li, H., and Sun, X. (2014). The transmission of fluctuant patterns of the forex burden based on international crude oil prices. Energy 73, 380–386. doi:10.1016/j.energy.2014.06.028
Ghouri, S. S. (2006). Assessment of the relationship between oil prices and US oil stocks. Energy Policy 34 (17), 3327–3333. doi:10.1016/j.enpol.2005.07.007
Granger, Clive W. J. (1969). Investigating causal relations by econometric models and cross-spectral methods. Econometrica 37, 424–438. doi:10.2307/1912791
Granger, Clive William John (1986). Developments in the study of cointegrated economic variables. United Kingdom: Oxford Bulletin of Economics and Statistics.
Gupta, R., and Modise, M. P. (2013). Does the source of oil price shocks matter for South African stock returns? A structural VAR approach. Energy Econ. 40, 825–831. doi:10.1016/j.eneco.2013.10.005
Hammoudeh, S., and Choi, K. (2007). Characteristics of permanent and transitory returns in oil-sensitive emerging stock markets: The case of GCC countries. J. Int. Financial Mark. Institutions Money 17 (3), 231–245. doi:10.1016/j.intfin.2005.11.002
Haque, M. M., Chowdhury, M. A. F., Buriev, A. A., Bacha, O. I., and Masih, M. (2018). Who drives whom-sukuk or bond? A new evidence from granger causality and wavelet approach. Rev. Financ. Econ. 36, 117–132. doi:10.1016/j.rfe.2017.09.002
Hashmi, S. M., Chang, B. H., and Bhutto, N. A. (2021). Asymmetric effect of oil prices on stock market prices: New evidence from oil-exporting and oil-importing countries. Resour. Policy 70, 101946. doi:10.1016/j.resourpol.2020.101946
Hashmi, S. M., Chang, B. H., Huang, L., and Uche, E. (2022). Revisiting the relationship between oil prices, exchange rate, and stock prices: An application of quantile ARDL model. Resour. Policy 75, 102543. doi:10.1016/j.resourpol.2021.102543
Hassan, K., Hoque, A., and Gasbarro, D. (2019). Separating BRIC using islamic stocks and crude oil: Dynamic conditional correlation and volatility spillover analysis. Energy Econ. 80, 950–969. doi:10.1016/j.eneco.2019.02.016
Huang, S., An, H., Gao, X., and Huang, X. (2016). Time–frequency featured co-movement between the stock and prices of crude oil and gold. Phys. A Stat. Mech. Its Appl. 444, 985–995. doi:10.1016/j.physa.2015.10.080
Hussin, M. Y. M., Muhammad, F., Noordin, K., Marwan, N. F., and Razak, A. A. (2012). The impact of oil price shocks on Islamic financial market in Malaysia. Labuan E-Journal Muamalat Soc. (LJMS) 6, 1–13. doi:10.51200/ljms.v6i.2965
Ivanov, P. C., Rosenblum, M. G., Peng, C.-K., Mietus, J., and Havlin, S., (1996). Scaling behaviour of heartbeat intervals obtained by wavelet-based time-series analysis. Nature 383 (6598), 323–327. doi:10.1038/383323a0
Ivanovski, K., and Hailemariam, A. (2021). Forecasting the dynamic relationship between crude oil and stock prices since the 19th century. J. Commod. Mark. 24, 100169. doi:10.1016/j.jcomm.2021.100169
Jiang, W., and Liu, Y. (2021). The asymmetric effect of crude oil prices on stock prices in major international financial markets. North Am. J. Econ. Finance 56, 101357. doi:10.1016/j.najef.2020.101357
Johansen, S. (1991). Estimation and hypothesis testing of cointegration vectors in Gaussian vector autoregressive models. Econometrica 59, 1551–1580. doi:10.2307/2938278
Jong, M.-C., Puah, C.-H., and Soh, A.-N. (2021). The impact of COVID-19 pandemic and commodities prices on Booking. com share price. Adv. Sci. Technol. Eng. Syst. J. 6 (2), 185–189. doi:10.25046/aj060221
Jouini, J. (2013). Return and volatility interaction between oil prices and stock markets in Saudi Arabia. J. Policy Model. 35 (6), 1124–1144. doi:10.1016/j.jpolmod.2013.08.003
Kang, W., de Gracia, F. P., and Ratti, R. A. (2021). Economic uncertainty, oil prices, hedging and US stock returns of the airline industry. North Am. J. Econ. Finance 57, 101388. doi:10.1016/j.najef.2021.101388
Keh, C.-G., Tan, Y.-T., and Tang, S.-E. (2021). Covid 19: Government responses to oil price. Adv. Int. J. Bus. Entrepreneursh. SMEs (AIJBES) 3 (7), 01–19. doi:10.35631/aijbes.37001
Kenourgios, D., Samitas, A., and Paltalidis, N. (2011). Financial crises and stock market contagion in a multivariate time-varying asymmetric framework. J. Int. Financial Mark. Institutions Money 21 (1), 92–106. doi:10.1016/j.intfin.2010.08.005
Kumar, S. (2019). Asymmetric impact of oil prices on exchange rate and stock prices. Q. Rev. Econ. Finance 72, 41–51. doi:10.1016/j.qref.2018.12.009
Le, T.-H., and Chang, Y. (2015). Effects of oil price shocks on the stock market performance: Do nature of shocks and economies matter? Energy Econ. 51, 261–274. doi:10.1016/j.eneco.2015.06.019
Li, S.-F., Zhu, H.-M., and Yu, K. (2012). Oil prices and stock market in China: A sector analysis using panel cointegration with multiple breaks. Energy Econ. 34 (6), 1951–1958. doi:10.1016/j.eneco.2012.08.027
Lv, X., Lien, D., and Yu, C. (2020). Who affects who? Oil price against the stock return of oil-related companies: Evidence from the US and China. Int. Rev. Econ. Finance 67, 85–100. doi:10.1016/j.iref.2020.01.002
Miller, J. I., and Ratti, R. A. (2009). Crude oil and stock markets: Stability, instability, and bubbles. Energy Econ. 31 (4), 559–568. doi:10.1016/j.eneco.2009.01.009
Ministry of Health Malaysia, . (2021). Updates on the coronavirus disease 2019 (Covid-19) situation in Malaysia, Available at: http://covid-19.moh.gov.my/terkini/072020/situasi-terkini-07-julai-2020/Kenyataan Akhbar KPK COVID-19 (7 Jul 2020)
Mishra, S., Sharif, A., Khuntia, S., Meo, M. S., and Khan, S. A. R. (2019). Does oil prices impede islamic stock indices? Fresh insights from wavelet-based quantile-on-quantile approach. Resour. Policy 62, 292–304. doi:10.1016/j.resourpol.2019.04.005
Narayan, P. K., Narayan, S., and Prasad, A. (2008). Understanding the oil price-exchange rate nexus for the Fiji islands. Energy Econ. 30 (5), 2686–2696. doi:10.1016/j.eneco.2008.03.003
Narayan, P. K., Phan, D. H. B., and Sharma, S. S. (2019). Does Islamic stock sensitivity to oil prices have economic significance? Pacific-Basin Finance J. 53, 497–512. doi:10.1016/j.pacfin.2018.04.003
Olayeni, O. R., Tiwari, A. K., and Wohar, M. E. (2020). Global economic activity, crude oil price and production, stock market behaviour and the Nigeria-US exchange rate. Energy Econ. 92, 104938. doi:10.1016/j.eneco.2020.104938
Pal, D., and Mitra, S. K. (2017). Time-frequency contained co-movement of crude oil and world food prices: A wavelet-based analysis. Energy Econ. 62, 230–239. doi:10.1016/j.eneco.2016.12.020
Park, J., and Ratti, R. A. (2008). Oil price shocks and stock markets in the US and 13 European countries. Energy Econ. 30 (5), 2587–2608. doi:10.1016/j.eneco.2008.04.003
Phillips, P. C. B., and Perron, P. (1988). Testing for a unit root in time series regression. Biometrika 75 (2), 335–346. doi:10.1093/biomet/75.2.335
Power, G. J., and Turvey, C. G. (2010). Long-range dependence in the volatility of commodity futures prices: Wavelet-based evidence. Phys. A Stat. Mech. Its Appl. 389 (1), 79–90. doi:10.1016/j.physa.2009.08.037
Rahim, A. M., and Masih, M. (2016). Portfolio diversification benefits of Islamic investors with their major trading partners: Evidence from Malaysia based on MGARCH-DCC and wavelet approaches. Econ. Model. 54, 425–438. doi:10.1016/j.econmod.2015.12.033
Raza, S. A., Shahbaz, M., Amir-ud-Din, R., Sbia, R., and Shah, N. (2018). Testing for wavelet based time-frequency relationship between oil prices and US economic activity. Energy 154, 571–580. doi:10.1016/j.energy.2018.02.037
Reuters, . (2020). Oil mixed as demand worries offset gains from output cut deal.Available at: https://www.reuters.com/article/us-global-oil/opec-deal-could-boost-oil-prices-but-oversupply-remains-idUSKCN21U0WQ
Roueff, F., and Von Sachs, R. (2011). Locally stationary long memory estimation. Stoch. Process. Their Appl. 121 (4), 813–844. doi:10.1016/j.spa.2010.12.004
Sadorsky, P. (2008). Assessing the impact of oil prices on firms of different sizes: Its tough being in the middle. Energy Policy 36 (10), 3854–3861. doi:10.1016/j.enpol.2008.07.019
Sadorsky, P. (1999). Oil price shocks and stock market activity. Energy Econ. 21 (5), 449–469. doi:10.1016/s0140-9883(99)00020-1
Saha, S. (2022). Asymmetric impact of oil price changes on stock prices: Evidence from country and sectoral level data. J. Econ. Finan. 46 (2), 237–282. doi:10.1007/s12197-021-09559-3
Salisu, A. A., Ebuh, G. U., and Usman, N. (2020). Revisiting oil-stock nexus during COVID-19 pandemic: Some preliminary results. Int. Rev. Econ. Finance 69, 280–294. doi:10.1016/j.iref.2020.06.023
Schneider, A., and Domonoske, C. (2020). Oil prices, stocks plunge after Saudi Arab. stuns world massive discounts. Available at: https://www.npr.org/2020/03/08/813439501/saudi-arabia-stuns-world-with-massive-discount-in-oil-sold-to-asia-europe-and-u- Sharif.
Soytas, U., and Sari, R. (2006). Can China contribute more to the fight against global warming? J. Policy Model. 28 (8), 837–846. doi:10.1016/j.jpolmod.2006.06.016
Srivastava, A., Bhatia, S., and Gupta, P. (2015). Financial crisis and stock market integration: An analysis of select economies. Glob. Bus. Rev. 16 (6), 1127–1142. doi:10.1177/0972150915604519
Tang, K. H. D. (2020). Movement control as an effective measure against covid-19 spread in Malaysia: An overview. J. Public Health 30 (3), 583–586. doi:10.1007/s10389-020-01316-w
Tiwari, A. K., Jena, S. K., Mitra, A., and Yoon, S.-M. (2018). Impact of oil price risk on sectoral equity markets: Implications on portfolio management. Energy Econ. 72, 120–134. doi:10.1016/j.eneco.2018.03.031
Tiwari, A. K., Mishra, B. R., and Solarin, S. A. (2021). Analysing the spillovers between crude oil prices, stock prices and metal prices: The importance of frequency domain in USA. Energy 220, 119732. doi:10.1016/j.energy.2020.119732
Toda, H. Y., and Yamamoto, T. (1995). Statistical inference in vector autoregressions with possibly integrated processes. J. Econ. 66 (1–2), 225–250. doi:10.1016/0304-4076(94)01616-8
Torrence, C., and Webster, P. J. (1999). Interdecadal changes in the ENSO-monsoon system. J. Clim. 12, 2679–2690. doi:10.1175/1520-0442(1999)012<2679:ICITEM>2.0.CO;2
Veza, I., Muhammad, V., Oktavian, R., Djamari, D. W., and Said, M. F. M. (2021). Effect of COVID-19 on biodiesel industry: A case study in Indonesia and Malaysia. Int. J. Automot. Mech. Eng. 18 (2), 8637–8646. doi:10.15282/ijame.18.2.2021.01.0657
Wang, J., Umar, M., Afshan, S., and Haouas, I. (2021). Examining the nexus between oil price, COVID-19, uncertainty index, and stock price of electronic sports: Fresh insights from the nonlinear approach. Econ. Research-Ekonomska Istraživanja 35, 2217–2233. doi:10.1080/1331677X.2021.1937260
Wang, Y., Wu, C., and Yang, L. (2013). Oil price shocks and stock market activities: Evidence from oil-importing and oil-exporting countries. J. Comp. Econ. 41 (4), 1220–1239. doi:10.1016/j.jce.2012.12.004
Wei, Y., and Guo, X. (2017). Oil price shocks and China’s stock market. Energy 140, 185–197. doi:10.1016/j.energy.2017.07.137
World Economic Forum. (2020). Mad March: How the stock market is being hit by COVID-19. Available at: https://www.weforum.org/agenda/2020/03/stock-market-volatility-coronavirus/
Worldometer, . (2021). COVID-19 coronavirus pandemic. Available at: https://www.worldometers.info/coronavirus/
Yarovaya, L., Brzeszczyński, J., and Lau, C. K. M. (2016). Intra-and inter-regional return and volatility spillovers across emerging and developed markets: Evidence from stock indices and stock index futures. Int. Rev. Financial Analysis 43, 96–114. doi:10.1016/j.irfa.2015.09.004
Keywords: conventional stock index, COVID-19, Islamic stock index, Malaysia, oil prices, sharia
Citation: Khan AB, Sharif A, Islam MSU, Ali A, Fareed M and Zulfaqar M (2022) Impact of oil prices on the Islamic and conventional stock indexes’ performance in Malaysia during the COVID-19 pandemic: Fresh evidence from the wavelet-based approach. Front. Energy Res. 10:962017. doi: 10.3389/fenrg.2022.962017
Received: 05 June 2022; Accepted: 22 August 2022;
Published: 26 September 2022.
Edited by:
Guo Wei, University of North Carolina at Pembroke, United StatesReviewed by:
Waqas Mehmood, Universiti Utara Malaysia, MalaysiaCopyright © 2022 Khan, Sharif, Islam, Ali, Fareed and Zulfaqar. This is an open-access article distributed under the terms of the Creative Commons Attribution License (CC BY). The use, distribution or reproduction in other forums is permitted, provided the original author(s) and the copyright owner(s) are credited and that the original publication in this journal is cited, in accordance with accepted academic practice. No use, distribution or reproduction is permitted which does not comply with these terms.
*Correspondence: Muhammad Fareed, bS5mYXJlZWRAdXVtLmVkdS5teQ==
Disclaimer: All claims expressed in this article are solely those of the authors and do not necessarily represent those of their affiliated organizations, or those of the publisher, the editors and the reviewers. Any product that may be evaluated in this article or claim that may be made by its manufacturer is not guaranteed or endorsed by the publisher.
Research integrity at Frontiers
Learn more about the work of our research integrity team to safeguard the quality of each article we publish.