 Hao Liu
 Zhengqiang Miao2
- 1State Power Investment Corporation Research Institute, Beijing, China
- 2Shandong Nuclear Power Company LTD, Yantai, China
This article proposes a two-layer collaborative stochastic optimization model of a hybrid combined heat and power system to determine the optimal capacities and operational strategies of components for minimizing the total cost, which includes investment, operation, and CO2 emission costs. Hybrid optimization algorithms, in genetic algorithm and particle swarm optimization, are employed to solve the two-layer optimization, respectively. Typical scenarios with probability distributions are generated in Monte Carlo simulations and a clustering approach, which demonstrate the influences of the uncertainties of renewable energies and electrical and thermal loads. The simulation results validate the effectiveness of the proposed optimization model. When considering the CO2 emission cost, the renewable energy penetration resulting from the larger capacities of renewable power technologies reaches 30%, which is 11.5% higher than the optimal case without considering the emission cost. This optimal integration increases the fossil energy utilization efficiency by 2.5% and the revenue from excess electricity sales by 2.7 times. The levelized capital cost, however, increases by 33.0%, and the utility grid integration and the net interaction also increase by 1.1% and 21.5%, respectively.
1 Introduction
A hybrid combined heat and power (CHP) system utilizes advanced technologies for transmission, storage, and consumption of energy, as well as the conversion of renewable energies, natural gas, and other resources to multiple energy forms, such as cooling, heating, and electricity, for consumers (Wang Y. et al., 2019). In this regard, the comprehensive integration of various technologies is among the important development orientations for future energy systems that aim to improve the overall energy utilization efficiency, promote cost effectiveness, increase renewable energy penetration, resolve environmental problems, and improve energy sustainability (Fonseca et al., 2021). However, a variety of energy streams, units, and uncertainties complicate the design and management of a hybrid CHP system (Wu et al., 2020).
The design of a hybrid CHP system aims to select suitable components with ideal capacities to achieve optimum performance from different types of units. The undersized or oversized capacity imposes the system into low performance in economics, energy, or reliability. The utilization of optimization algorithms with computer-aided design (e.g., iterative methods and heuristic algorithms) is widely recognized as a common and effective method to find a satisfactory solution by comparing various alternatives as well as improving performances (Gao et al., 2019). For example, the hybrid micro-grid systems of photovoltaics (PV), wind turbine (WT), battery, and diesel generators were optimized using multi-objective particle swarm optimization (Azaza and Wallin, 2017) and grasshopper optimization algorithm (Bukar et al., 2019); the capacities of PV, WT, CHP, and gas boiler in power/heat grids were determined in NSGA-II (Wang Y. et al., 2019); different components of hybrid renewable energy systems in India were integrated by employing a numerical iterative algorithm (Kanase-Patil et al., 2011). In these studies, the optimal capacities were strongly dependent on energy-management strategies of components, in which these operational rules were usually predefined. If the operational management is together optimized with the capacity optimization, more benefits will be achieved. Consequently, this article integrates the optimal energy management of components into design optimization.
The optimal energy management in this article is specified to control the operational states of components and adjust their respective instantaneous outputs to satisfy the energy demands of users and achieve certain objectives, not considering demand side management and demand side response. Typically, the power and heat generation units are instantaneously adjusted with the variations of loads and renewable resources, and the coordinated dispatch between components (Wang M. et al., 2020), power and heat systems (Wang Y. et al., 2019), energy hubs (Mohammadi et al., 2018) and electricity, heat, and gas networks (He et al., 2020) are optimized. However, most studies on operational optimization of hybrid energy systems focused on day-ahead or online energy dispatch and did not consider the design of components. The integration between system design and instantaneous operational management results in difficulties in modeling and solution.
To comprehensively optimize system design and operation, some methodologies were proposed and developed. A mixed integer nonlinear programming model was modeled to determine the optimal combination, capacity, and operation strategies for energy technologies (Zhu et al., 2020). The configuration, size, and operation of urban energy systems are rigorously optimized from both time-dependent demand and supply perspectives considering component sizes and part load characteristics (Zheng et al., 2017). But the detailed and complicated models consume more computation cost and time. A typical alternative method is to characterize the operation management in the simplified decision variables. For example, the hybrid operation of the absorption chiller and electric chiller was represented in a fixed (Wang J. J. et al., 2010) or variable (Liu et al., 2012) ratio, the hourly operation of the heat pump was simplified to change with the electricity price (Ren et al., 2019), and the hourly load ratio of electricity and heat was optimized to denote the energy management (Li et al., 2017). These studies presented various integrated designs with operational management. However, they mainly concentrate on deterministic optimization regardless of multiple uncertainties during the hybrid CHP operation. If the uncertainties are not adequately included in the optimization, the actual operational performance may deviate from the optimal one.
There are various uncertainties in the optimization, such as renewable energies, user loads, prices of fuel or electricity from the public grid, and component technical parameters (Mavromatidis et al., 2018). The stochastic optimization of design and operation for energy storage in hybrid renewable energy systems demonstrated that various uncertainty methods lead to different results (Yu et al., 2019). Uncertainty modeling is critical to capture the actual scenarios (Zakaria et al., 2020). The existing techniques include probabilistic approaches, possibilistic approaches, interval-based analysis, robust optimization, and information gap decision theory (Aien et al., 2016). Numerous studies have revealed how uncertainties affect energy plants. Uncertainties in any energy system can be represented in the probabilistic or possibilistic method. The probability method is typically implemented to express the renewable energy uncertainties, such as the Weibull and Rayleigh distributions of wind speed and the normal and beta distributions of solar radiation (Mavromatidis et al., 2018) and the sampling in Monte Carlo (Zhou et al., 2013). The robust optimization for uncertainties was considered to strengthen the robust performance of the CHP system under demand response (Majidi et al., 2019). The information gap decision theory was employed to model the uncertainty of energy sources in the integrated electricity, gas, and district heating networks without a probability distribution function (Mirzaei et al., 2020). A hybrid stochastic-interval optimization model was developed to realize the risk-constrained self-scheduling of a hybrid energy system (Khaloie et al., 2021). A decentralized robust–stochastic security-constrained unit commitment model was constructed for the collaborative operation of networked energy hubs and the renewable power system (Oskouei et al., 2021). The approaches for characterizing each uncertainty category differ; however, among these, a simple technique that is commonly employed is the probability density function method (Mavromatidis et al., 2018). Furthermore, handling the uncertainties on both supply and demand sides is a challenge. Wang et al. (2021) developed modified stochastic programming to capture both demand and supply sides’ scenarios and constructed a co-optimization to optimize both sides of the integrated energy system. The accurate assessments of both sides are the fundamental works in the system design (Canziani et al., 2021). This article introduces the uncertainty model of both sides of renewable energies and user loads in a scenario-based method with probability distributions to the collaborative optimization of design and operation of the hybrid CHP system, which is novel in comparison to the previous studies on integrated optimization.
As mentioned above, most of those studies concentrate on deterministic optimization and optimizing the capacities of components in the predefined operational strategies or in the simplified parameters to represent operation strategies in the system optimization considering operational strategies of hybrid CHP systems. However, the instantaneous operational management considering the uncertainties of supply and demand is significant to further improve system performances. Departing from previous studies, this study aims to comprehensively and collaboratively optimize the capacities and instantaneous energy-management strategies of components in the hybrid CHP system involving electricity, heat, and gas considering the uncertainties of both supply and demand. The contributions of this work are summarized as follows.
⁃ A two-layer collaborative optimization model is proposed to optimize the design and operation of the hybrid CHP system. The capacities of components are determined to minimize investment cost in the first-layer optimization using genetic algorithm (GA), and the instantaneous operational management of components is optimized to minimize energy and maintenance cost, and CO2 emission cost in the second-layer optimization using particle swarm optimization (PSO).
⁃ The uncertainties in both renewable energy resources and user loads are modeled in Monte Carlo simulation, and the scenario-generation-based stochastic optimization is implemented in the integrated optimization of design and operation of hybrid CHP systems, which is novel in comparison to existing contributions.
⁃ The schemes considering different objectives are optimized. The integrated performances are assessed and compared in indicators of the annual total cost, energy utilization efficiency, integration level of the grid, renewable energy index, and to indicate economic, energy, flexibility, and sustainability, respectively.
This article is organized as follows: Section 2 constructs the thermodynamic models. Section 3 proposes scenario generation and collaborative optimization methods. Section 4 presents the application of the proposed methods by a case study. Section 5 obtains some conclusions.
2 System description
Figure 1 shows the hybrid CHP system. The power-generation system consists of a gas turbine (GT) CHP plant, PV panels, a WT, and an electricity grid. The heat-production system includes waste heat recovery units in the CHP plant, a gas boiler, and a heat pump. The flexible operation is dependent on the cooperative interactions and conversions between electricity and heat. The heat pump is the key power-to-heat component for utilizing excess power from renewable energies and for improving energy utilization efficiency (Bloess et al., 2018). The battery and thermal tank are energy-storage devices to alleviate the unbalances.
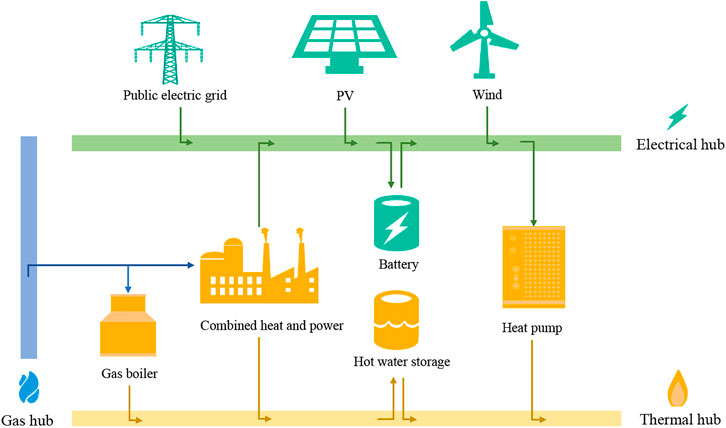
FIGURE 1. Hybrid CHP system integrated with renewable energies.
2.1 Combined heat and power system
The electrical and thermal outputs of the CHP plant (
where
The heat and power outputs are interdependent in a special feasible region because the CHP cannot be adjusted freely in all ranges of installed capacity. Generally, the start-up coefficient is set, which is less than the load factor in the actual operation.
2.2 Solar PV panels
The electrical outputs of solar PV panels (
where
where
2.3 Wind turbines
The total electrical output considering the number of WTs (
where
where
2.4 Air source heat pump
The air source heat pump (ASHP) uses electrical power to transfer thermal energy from the heat sources to the heat sink. The relationship between electrical power (
where
where
2.5 Gas boiler
The heat output of a gas boiler (
where
2.6 Thermal storage
The general model of thermal storage under the constraint of capacity considering the heat losses is expressed as follows (Bloess et al., 2018):
where
2.7 Battery
The general electrical model of the battery can be expressed as follows (Ren et al., 2019):
where
3 Methodology
Figure 2 illustrates the framework of the two-layer collaborative stochastic optimization of a hybrid energy system, whose objectives are to determine the optimal configurations and short-term operation strategy according to the generated scenarios. Collaborative optimization is divided to two-layer optimization, in which the first-layer optimization is to determine the capacities of components and the second-layer optimization is to determine the hourly outputs of components. The optimal design decomposition method to divide the whole optimization into different stages has been validated in similar studies on energy systems (Jing et al., 2019). This section introduces scenario generation, a two-layer optimization model, a solution algorithm, and evaluation indicators in the framework of Figure 1.
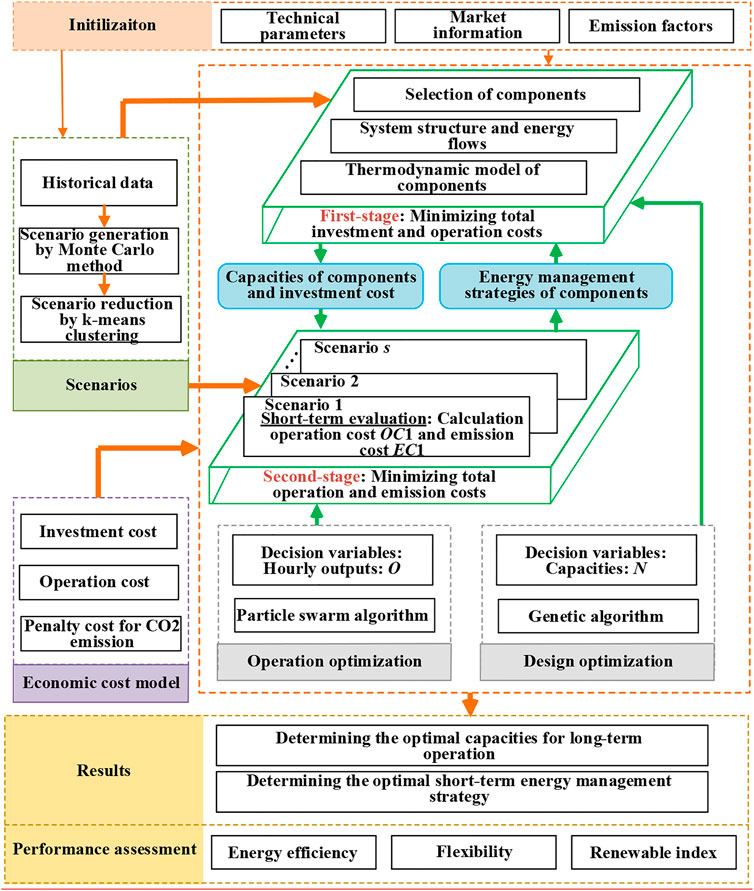
FIGURE 2. Framework of two-layer collaborative stochastic optimization.
3.1 Scenario generation of supply and demand uncertainties
Scenario generation is in stochastic programming, which discretizes the random process. It is not only important in terms of improving computation but also includes events of particular interest without affecting the optimization process (Mitra and Domenica, 2010). Moreover, the scenario generation method is a decision-planning tool in itself by reducing a large number of random factors to a small number of outcomes. Based on these advantages, the scenario generation method is employed to characterize the uncertainties of both supply and demand sides.
The uncertain factors such as renewable energy sources and loads are from the simulated data in DesT. The scenario-based method is employed for estimating the probability of occurrence of each category. The hybrid system runs over the entire year, and the profiles of 24 h in the most representative days are generated. Based on data on the hourly hierarchy, each hour’s probability density function is fitted on the primary distribution characteristics. The wind velocity (
where
The discretization method and Monte Carlo simulation are employed to sample from the continuous probability density function. To obtain accurate results, massive scenarios are generated. But the computational cost for optimization will be increased. Then, the k-means clustering method is utilized to reduce the number of scenarios. The ten scenarios and their probabilities are generated and shown in Figure 3. The load profiles seem to be similar such as trends, and peak and valley locations, which mainly resulted from the similar settings in DesT building simulations, such as occupations and human behaviors.
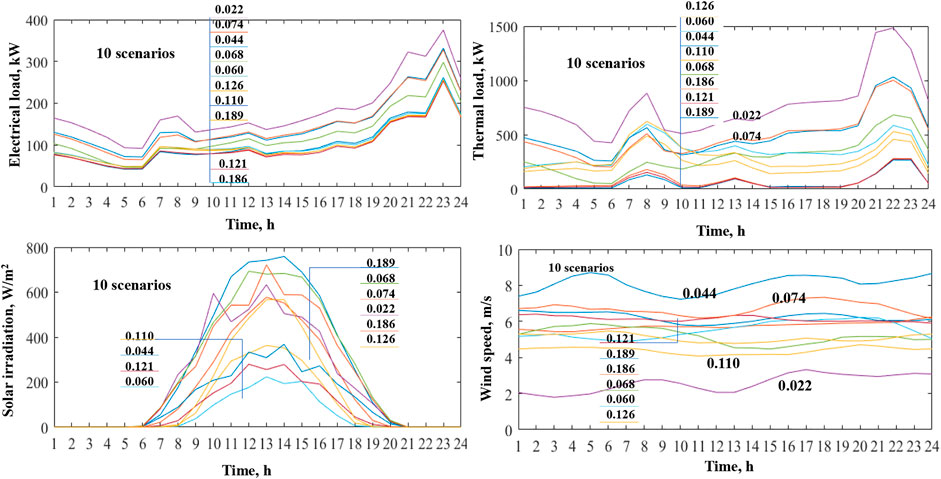
FIGURE 3. Generated scenarios of loads and weather parameters.
The generated scenarios in Figure 3 with their probabilities represent the uncertain supply and demand sides, which convert the uncertainty problem of parameters to a deterministic problem. Thus, the optimization and solving will become easier with the specific boundary conditions.
3.2 Optimization model
It is seen in the modeling components in Section 2 that this optimization problem is nonlinear because of the coupled relationship between component output and variable efficiency. Also, optimization involves capacity determination and operational management, and the optimized capacities directly influence the solutions of operational management. Thus, the optimization problem is constructed as a two-layer collaborative optimization as follows:
where
3.2.1 First-layer optimization
The first-layer optimization aims to obtain the optimal capacities of components to minimize their investment costs. The decision variables of component capacities (
To consider the initial capital cost (ICC) of components into the economic feasibility of the IES, this cost is expressed in terms of interest rate (
where I represents component i;
3.2.2 Second-layer optimization
The energy-management strategies and operational conditions of components are optimized to achieve better daily performances. The decision variables can be expressed as follows:
where
where
where
where
where
The operational cost of the grid is the difference between the purchase and sale costs of electricity.
where
When the penalty cost for CO2 emission is considered, the CO2emissions from the natural gas CHP and gas boiler should be obtained. The CO2 emission that occurs with the purchase of electricity from the grid (
The CO2 emission cost (
where
where
3.3 Constraints
1) Electrical and thermal balances:
where
2) Capacity constraints:
where the output of each component is always less than its capacity (
3.4 Solution algorithms
The optimization model is a typical high-dimensional problem involving multiple decision variables and two-layer optimization. The hybrid optimization methods are more suitable than the two-layer optimization in this context. Many hybrid optimizations have been attempted to effectively improve the computation efficiency, such as the hybrid implementation of lexicographic optimization and normal boundary intersection method (Khaloie et al., 2021), PSO with linear programming, PSO with differential evolution, and the combination of GA, PSO, differential evolution and simulated annealing. Since the heuristic algorithms have a strong ability to obtain global solutions, the hybrid optimization employs the GA to optimize the configurations in the first layer and the PSO to obtain the optimal operational strategy in the second-layer optimization. It is noted that the single optimization algorithm can be selected to implement twice for the two optimization problems in different parameters. Based on the foregoing, the flowchart of the hybrid two-layer optimization model is shown in Figure 4. The computation procedures are summarized as follows:
1) Load the necessary parameters (e.g., technical performance of components, market information on equipment, fuel, and electricity) and emission factors of fuel and the electrical grid
2) Load the hourly historical or simulated data of loads, solar irradiance, atmospheric temperature, and wind speed; thereafter, generate typical scenarios
3) Perform configuration optimization using the GA in the generated scenarios
4) Implement the following PSO sub-programming to optimize the energy-management strategies of components and obtain the operational cost of Eq. 13 and the CO2 emission penalty cost of Eq. 14
5) Evaluate the fitness of each individual with the total cost, considering the initial capital, operational, and emission penalty costs, and select the best-ranking individuals to reproduce, and produce new generations through crossover and mutation
6) Continue the steps of GA until convergence is achieved, and then decode the decision variables to output the optimal configurations and energy-management strategies
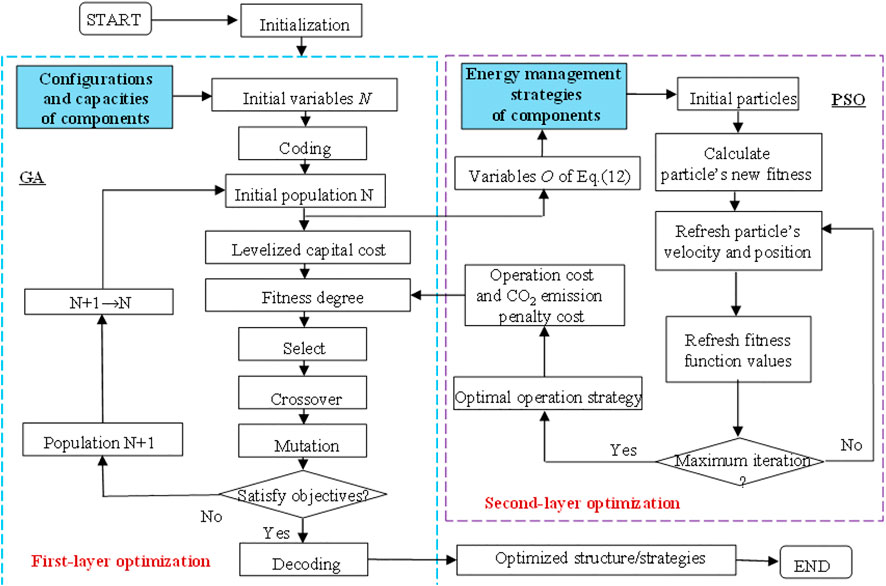
FIGURE 4. Flowchart and procedure of two-layer optimization in hybrid GA–PSO.
From the overall optimization procedures of Figure 4, the large-scale coupled problem of capacity determination and operational management can be divided into small-scale problems that are easier to solve. If the single-layer optimization considering both system design and operation management is constructed, too many decision variables are simultaneously optimized and the problem will be difficult to solve.
3.5 Evaluation indicators
1) Energy utilization efficiency
As the primary energy consumption of electricity from the grid (
2) Grid integration level
The electricity grid is perceived as virtual electric storage. The interaction of purchasing or injecting electricity between the hybrid system and the grid could result in grid destabilization. Grid integration (GI) and net interaction (NI) are employed according to the dependency of the hybrid system on the grid. The less GI and NI means the less dependence of the hybrid system on the grid and larger operational flexibility.
3) Renewable energy index
The generated electricity from PV panels and WTs satisfies the electrical demand of users and heat pumps, in which more inputs of renewable energy indicate a higher sustainability index of the energy system. The renewable energy index is defined as follows:
4 Results and discussion
4.1 Initializations
The programming was implemented and simulated in MATLAB (R2017b) software in a personal computer with a 1.60-GHz Intel Core i5-8250U processor and 8-GB RAM. The following assumptions were set:
1) The maximum capacities of CHP, PV panels, and WTs are set according to the maximal electrical load, whereas the maximum capacities of the heat pump and gas boiler are set according to the maximal thermal load.
2) The maximum capacity of the thermal storage tank is assumed to satisfy the thermal demand in 4 h, which is four times that of the maximal hourly thermal load. The maximum capacity of the battery is set to 10% of the peak electrical demand in an hour, and its initial electrical charge is set to 50% of the maximum.
3) It is assumed that the optimal numerical capacities are in a continuous range without considering the discrete sizes of components in the market. The technical and emission constraints of components are indicated in Table 1. Their investment costs are shown in Table 2, in which the scale effects are ignored.
4) As shown in Table 3, the price of natural gas is taken to be 0.36$/Nm3. The hourly purchased electricity price from the grid is different. The price of injecting electricity from the hybrid system to the grid is set to half of the hourly purchased electricity from the grid and
5) The parameters of GA and PSO are listed in Table 4. The higher crossover probability in GA is set to be 0.9 and the lower mutation probability is taken to be 0.1, which aims to obtain the diversity of populations. The inertia weight in the PSO is set to 1.0, which avoids premature convergence or too slow convergence.
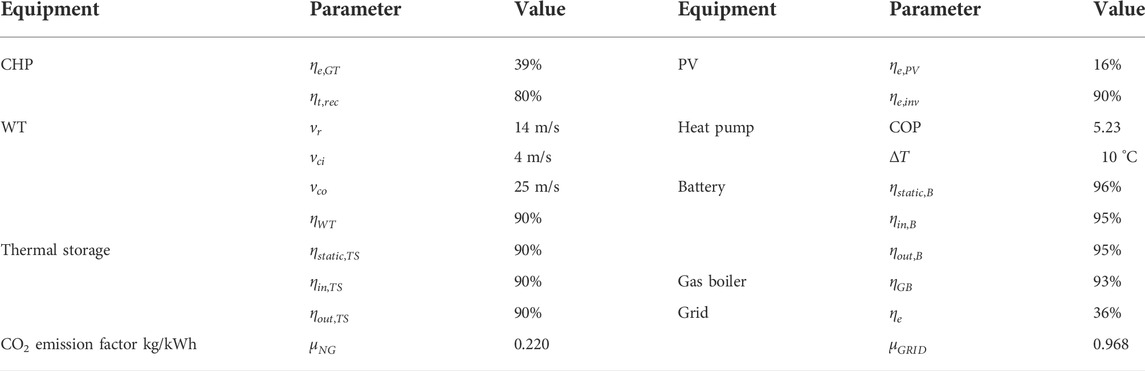
TABLE 1. Technical and emission parameters (Ren et al., 2019; Ruhnau et al., 2019).
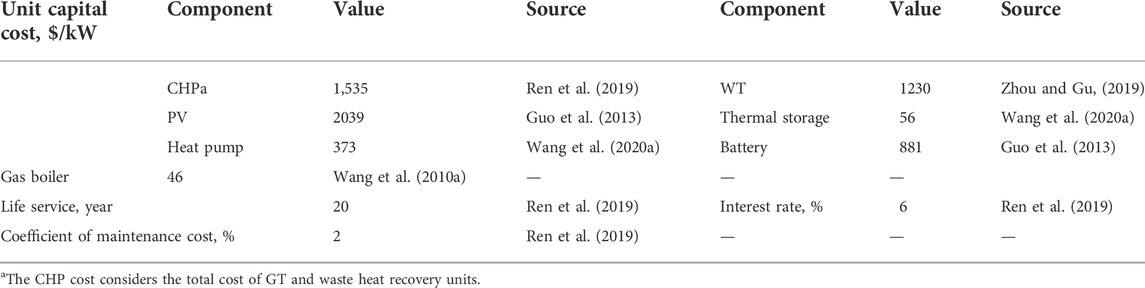
TABLE 2. Economic parameters.
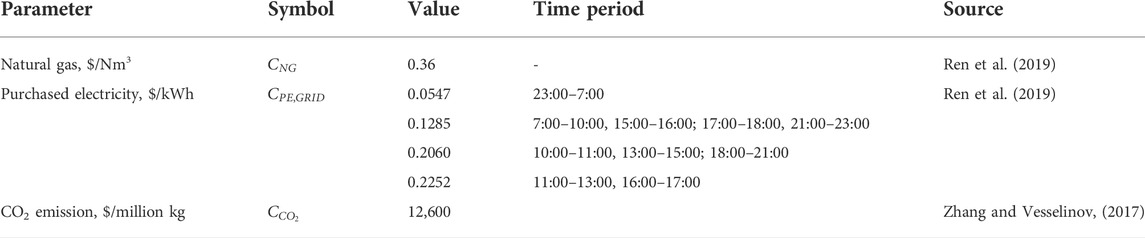
TABLE 3. Unit price of electricity from the grid, natural gas, and CO2 emission.
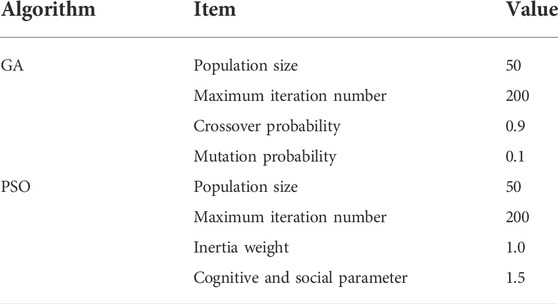
TABLE 4. GA and PSO parameters.
The following two cases are optimized to demonstrate the proposed optimization model.
Case 1:. To minimize the total investment, operational, and CO2 emission costs.
Case 2:. To minimize the total investment and operational costs without the emission cost.
4.2 Optimal capacities
Parallel computation in MATLAB is adopted for the PSO to optimize the operation. The duration of the whole optimization is approximately 5 h and 30 min, whereas that of the PSO of each scenario is only 0.37 s on average. The fitness of operational cost quickly drops to the lowest value after only eight to nine iterations. However, the fitness of total cost converges more gradually, and this results from the repeated coupling computations (1 billion times) between the main GA program and the PSO sub-program.
Table 5 summarizes the optimum capacities under different objectives (Case 1 with CO2 cost and Case 2 without CO2 cost).
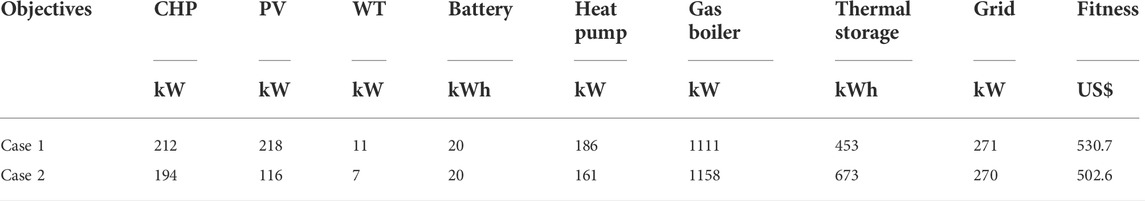
TABLE 5. Optimum configurations of the hybrid system considering various objectives.
4.2.1 Energetic analysis
It can be seen in Table 5 that the capacity of electric components in Case 1 (considering CO2 emission cost) is larger than that in Case 2 without considering the CO2 emission cost. The sizes of PV panels and WTs account for 52% of installed power capacity in Case 1, demonstrating that renewable energy technologies are prioritized to reduce CO2 emission costs. Table 6 indicates that the electricity from PV and WTs in Case 1 reaches 20.3%, which is 5.7% more than that in Case 2. Although the CHP capacity in Case 2 is less than that in Case 1, the latter case outputs more electricity, which exceeds 4.0%. Thus, the renewable energy index in Case 1 reaches 29.5% whereas that in Case 2 is only 18.0%, as shown in Table 5. As a result, the energy utilization efficiency in Case 1 (93.0%) is also larger than that in Case 2 (80.5%).
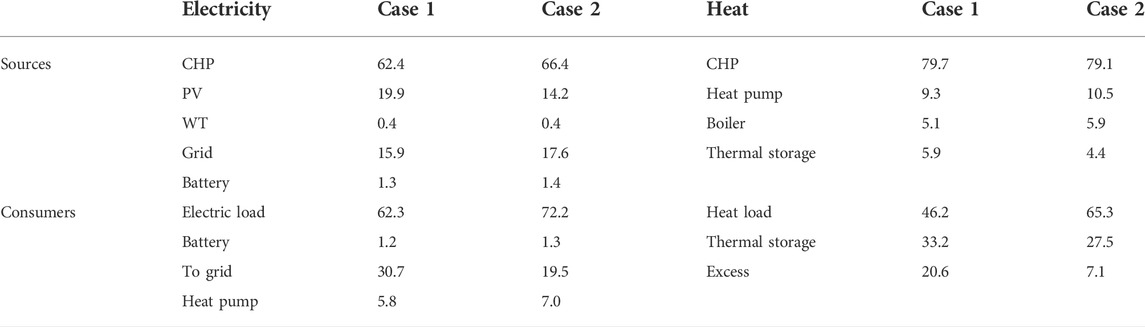
TABLE 6. Sectors of electrical and thermal sources and consumers in two cases.
The optimal integrations of a heat pump, gas boiler, and thermal storage tank for satisfying the thermal load vary with different objectives. Analyzing their construction as sources, the CHP is the key source of heat supply because of its larger waste heat and electricity generation that exceed 79.0%. Considering CO2 emission, although the heat pump size in Case 1 is larger than that in Case 2, the former can only supply approximately 9.3% of the heat demand compared to the latter (10.5%), as shown in Table 6. The large size of the CHP between the two cases leads to more waste heat output, and thermal storage is necessary to store the excess waste heat. The heat storage ratio is more than 27.5%, and the contribution of thermal storage to compensate for the heat deficiency is only approximately 4.4% (Case 2) or 5.9% (Case 1). In evaluating the economic performance of the size of the thermal storage tank, the amount of excess heat that exits the tank to the atmosphere is taken into account; the smaller tank size in Case 1 results in more excess heat, i.e., up to 20.6%. For both cases, the gas boiler contribution for supplementing heat deficiency is more than 5.0%.
In analyzing the proportions of purchased electricity from the grid and injecting electricity into the grid (Table 6), the former accounts for 15.9% (Case 1) and 17.6% (Case 2) of the electricity demand. Thus, the grid integration levels are relatively high, i.e., 23.4% in Case 1 and 22.3% in Case 2, as shown in Figure 5. The excess electricity remaining to be sent back to the grid in Case 1 is 11.2% more than that in Case 2 because the CO2 emission factor of this hybrid system is less than that of the electricity from the grid. Moreover, surplus electricity could supplement the CO2 emission penalty cost. This also results in the higher net interaction of the hybrid system with the grid in Case 1, i.e., 70.6%. These indicators demonstrate the importance of the grid as virtual electricity storage to improve the operational performance of IES.
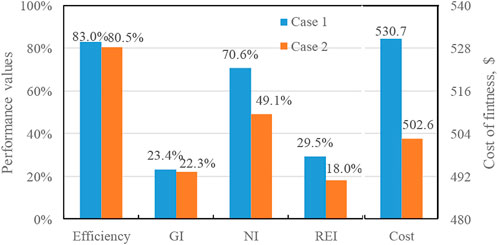
FIGURE 5. Performance comparison between two cases with and without CO2 emission costs.
4.2.2 Cost analysis
Compared to the compositions of the total cost of the two cases considering different objectives (Table 7), the levelized capital cost in Case 1 (considering the CO2 emission cost) is larger than that in Case 2. This is because of the larger sizes of components in Case 1 that account for approximately 43.4% and 34.4% of the total cost, respectively; hence, higher contributions lead to higher costs. The CHP operational cost in Case 1 reaches 71.0% of the total operational cost, and the required overpayment of CO2 emission from the CHP and gas boiler is approximately 5.2%. In Case 1, the greater the amount of electricity injected into the grid, the higher the revenue derived from selling electricity; the total cost is reduced when the investment and CO2 emission costs are higher.
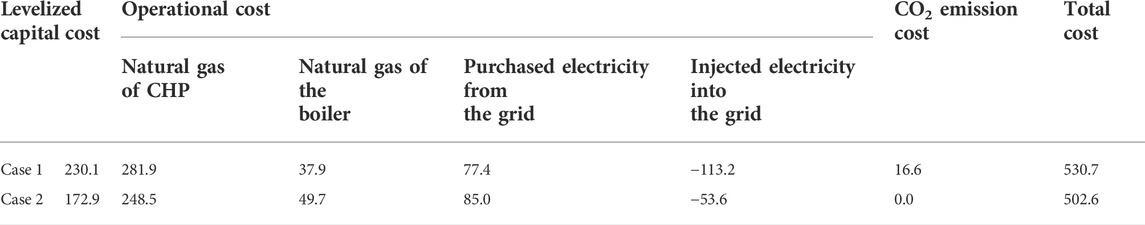
TABLE 7. Composition of the total cost of two cases considering different objectives (US$/d).
Without considering CO2 emission cost, the CHP levelized capital cost and operational cost in Case 1 increase by 33.0% and 13.4%, respectively, and the revenue from the sale of electricity increases by 111.3% with respect to those in Case 2. On the other hand, the gas boiler fuel cost and electricity purchase cost in Case 1 decreased by 23.7% and 8.9%, respectively, with respect to those in Case 2.
In addition, the cost difference between Case 1 and Case 2 shows that the emission cost has a great impact on the cost feasibility of CHP. If the proposed model with and without emission cost is applied in similar plants, their cost difference presents the guide to deciding the price of an emission reduction and possible carbon. Optimal energy-management strategies.
Figure 6 shows the optimal operational strategies of components in two typical daily scenarios of Case 1 using the PSO, in which the CO2 emission cost is considered. The electric power balances clearly show that the CHP, PV, and grid mainly cover the electrical loads of users and heat pump electrical demand for supplying the thermal load. The detailed battery and WT operating states are shown in Figure 7, in which the WT only supplies 0.9% (Case 1) and 0.3% of Case (2) of electricity because of its small size. The charging-discharging behaviors mainly follow the battery’s charged state to maximize battery life and average stored electricity; in the two scenarios, they cover 2.6% and 1.3% of the electrical demand, respectively.
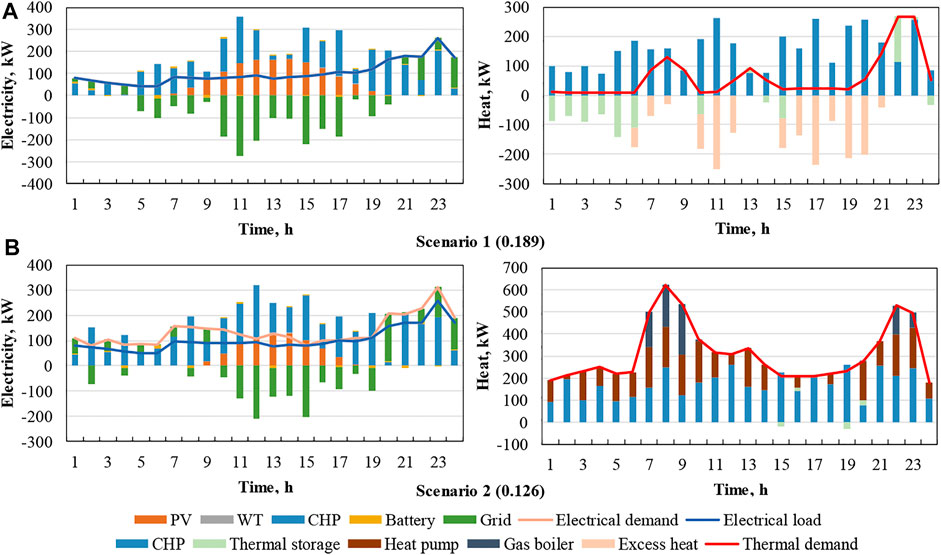
FIGURE 6. Energy-management strategies of components in Scenarios 1 (A) and 2 (B) considering CO2 emission cost.
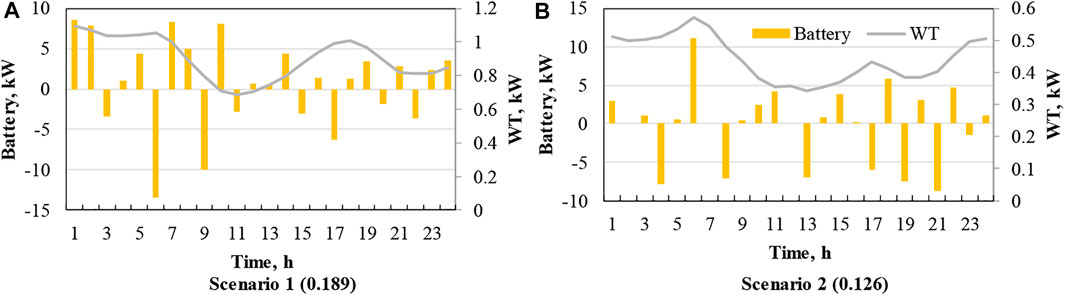
FIGURE 7. Operational strategies of battery and WT under Scenarios 1 (A) and 2 (B) considering CO2 emission cost.
Figure 6 shows that there is an amount of excess electricity to be sold back to the grid (particularly between 10:00 and 17:00) which is considerably dependent on the price of electricity set by the grid. In scenario 1, the CHP always runs to generate more electricity to be injected into the grid although the PV models provide sufficient power for users between 10:00 and 16:00. The sale of excess electricity generates more income when the electricity cost is high. The daily electricity sales income compensates for 61.8% of the CHP operational cost and CO2 emission cost; it is approximately four times the utility fee of purchased electricity. The CHP operation at a higher load factor results in more waste heat, which is sufficient to satisfy the thermal demand of users. The excess heat is either stored in the thermal storage tank or released to the environment, and only 39.9% of the stored heat is released to supplement the heat deficiency at 22:00 and 23:00.
Compared to the optimal strategies of components in scenario 1, the integrated heat pump and gas boiler operation serves the high thermal load in scenario 2, as shown in Figure 6B. Therefore, the electrical demand exceeds the electrical load of users. The heat pump, which consumes 20.7% of generated electricity, operates to supply 34.6% of the thermal demand throughout the day, except at 15:00 and 19:00. The CHP continues to operate with a higher load factor to output excess electricity to the grid during daytime when the electricity price is higher. Nevertheless, there is practically no excess waste heat to be stored because of the higher thermal demand. In addition, the gas boiler supplies 10.5% of the thermal demand by consuming approximately 9.9% of natural gas.
5 Conclusion
The proposed two-layer collaborative optimization of configuration and energy-management strategies was validated by the simulations, in which the generated scenarios with probability distributions were adopted to demonstrate the uncertainties of renewable energies and loads. The following conclusions are obtained:
Renewable energy power technologies with suitable capacities are beneficial to decreasing the CO2 emission cost of fossil energy consumption. The renewable energy index reaches 30%, which is 11.5% larger than the case without considering the CO2 emission cost. However, the interaction level between the hybrid system and utility grid increases, and the grid integration and net interaction increase by 1.1% and 21.5%, respectively. This demonstrates that the utility grid functions as important virtual storage to improve the renewable energy penetration level. Moreover, the levelized capital cost resulting from renewable energy technologies with larger sizes increases by 33.0%. To a certain extent, the revenue derived from electricity sales compensates for the higher investment and CO2 emission costs.
Thermal management is considerably dependent on power management strategies. When the CHP load factor is high, more waste heat is generated; hence, thermal storage equipment should be installed to store excess heat. The heat pump can aid in converting excess power to heat but requires effective integrated strategies. In addition, the power units output more amounts of excess electricity and sell these to the grid during the daytime when the hourly prices of electricity purchased from the grid are higher. In the optimal scheme, considering the CO2 emission cost, it covers the cost of purchased electricity because the CO2 emission factor of electricity from the hybrid system is less than that of electricity from the grid.
The developed framework would be beneficial in terms of providing a better collaborative decision-making process of design and operation in the hybrid system influenced by intermittent energy resources and uncertain loads. In addition, the PSO sub-programming can be flexibly adapted for the online optimization of operational management of operators by combining certain energy supply and demand techniques as well as predictions. But there are some limitations in the scenario generation in this study. The generated scenarios are crucial to getting accurate results. The validations of the generated scenarios are difficult in the design period, and their representations in the limited number of scenarios are required to analyze. For future work, it would be interesting and challenging to analyze the impact of some extreme operation scenarios not considered in the design stage. Also, the proposed framework is extended to evaluate the effect of the participation of uncertain market factors on system design and operation.
Data availability statement
The raw data supporting the conclusions of this article will be made available by the authors, without undue reservation.
Author contributions
HL: methodology, software, and writing. ZM: data analysis and reviewing. NW: data analysis, methodology, and draft writing. YY: methodology, writing, and reviewing.
Funding
This research was supported by State Power Investment Corporation LTD. (Grant No. TC2020HN02).
Conflict of interest
Author ZM was employed by the company Shandong Nuclear Power Company LTD.
The remaining authors declare that the research was conducted in the absence of any commercial or financial relationships that could be construed as a potential conflict of interest.
Publisher’s note
All claims expressed in this article are solely those of the authors and do not necessarily represent those of their affiliated organizations, or those of the publisher, the editors, and the reviewers. Any product that may be evaluated in this article, or claim that may be made by its manufacturer, is not guaranteed or endorsed by the publisher.
Abbreviations
ASHP, air source heat pump; CHP, combined heat and power; COP, coefficient of performance; GA, genetic algorithm; GI, grid integration; GT, gas turbine; ICC, initial capital cost, NI, net interaction; PSO, particle swarm optimization; REI, renewable energy index; PV, photovoltaics; WT, wind turbine.
References
Aien, M., Hajebrahimi, A., and Fotuhi-Firuzabad, M. (2016). A comprehensive review on uncertainty modeling techniques in power system studies. Renew. Sustain. Energy Rev. 57, 1077–1089. doi:10.1016/j.rser.2015.12.070
Azaza, M., and Wallin, F. (2017). Multi objective particle swarm optimization of hybrid micro-grid system: A case study in Sweden. Energy 123, 108–118. doi:10.1016/j.energy.2017.01.149
Bloess, A., Schill, W.-P., and Zerrahn, A. (2018). Power-to-heat for renewable energy integration: A review of technologies, modeling approaches, and flexibility potentials. Appl. Energy 212, 1611–1626. doi:10.1016/j.apenergy.2017.12.073
Bukar, A. L., Tan, C. W., and Lau, K. Y. (2019). Optimal sizing of an autonomous photovoltaic/wind/battery/diesel generator microgrid using grasshopper optimization algorithm. Sol. Energy 188, 685–696. doi:10.1016/j.solener.2019.06.050
Canziani, F., Vargas, R., and Gastelo-Roque, J. (2021). Hybrid photovoltaic-wind microgrid with battery storage for rural electrification: A case study in perú. Front. Energy Res. 8, 528571. doi:10.3389/fenrg.2020.528571
Durisch, W., Tille, D., Wörz, A., and Plapp, W. (2000). Characterisation of photovoltaic generators. Appl. Energy 65, 273–284. doi:10.1016/S0306-2619(99)00115-4
Fonseca, J. D., Commenge, J.-M., Camargo, M., Falk, L., and Gil, I. D. (2021). Multi-criteria optimization for the design and operation of distributed energy systems considering sustainability dimensions. Energy 214, 118989. doi:10.1016/j.energy.2020.118989
Gao, L., Hwang, Y., and Cao, T. (2019). An overview of optimization technologies applied in combined cooling, heating and power systems. Renew. Sustain. Energy Rev. 114, 109344. doi:10.1016/j.rser.2019.109344
Guo, L., Liu, W., Cai, J., Hong, B., and Wang, C. (2013). A two-stage optimal planning and design method for combined cooling, heat and power microgrid system. Energy Convers. Manag. 74, 433–445. doi:10.1016/j.enconman.2013.06.051
He, L., Lu, Z., Geng, L., Zhang, J., Li, X., and Guo, X. (2020). Environmental economic dispatch of integrated regional energy system considering integrated demand response. Int. J. Electr. Power & Energy Syst. 116, 105525. doi:10.1016/j.ijepes.2019.105525
Hossain, M. A., Pota, H. R., Squartini, S., Zaman, F., and Guerrero, J. M. (2019). Energy scheduling of community microgrid with battery cost using particle swarm optimisation. Appl. Energy 254, 113723. doi:10.1016/j.apenergy.2019.113723
Jing, R., Wang, M., Zhang, Z., Wang, X., Li, N., Shah, N., et al. (2019). Distributed or centralized? Designing district-level urban energy systems by a hierarchical approach considering demand uncertainties. Appl. Energy 252, 113424. doi:10.1016/j.apenergy.2019.113424
Kanase-Patil, A. B., Saini, R. P., and Sharma, M. P. (2011). Sizing of integrated renewable energy system based on load profiles and reliability index for the state of Uttarakhand in India. Renew. Energy 36, 2809–2821. doi:10.1016/j.renene.2011.04.022
Khaloie, H., Anvari-Moghaddam, A., Hatziargyriou, N., and Contreras, J. (2021). Risk-constrained self-scheduling of a hybrid power plant considering interval-based intraday demand response exchange market prices. J. Clean. Prod. 282, 125344. doi:10.1016/j.jclepro.2020.125344
Li, Y., Liang, W., and Tan, R. (2017). Optimal design of installation capacity and operation strategy for distributed energy system. Appl. Therm. Eng. 125, 756–766. doi:10.1016/j.applthermaleng.2017.07.011
Liu, M., Shi, Y., and Fang, F. (2012). A new operation strategy for CCHP systems with hybrid chillers. Appl. Energy 95, 164–173. doi:10.1016/j.apenergy.2012.02.035
Majidi, M., Mohammadi-Ivatloo, B., and Anvari-Moghaddam, A. (2019). Optimal robust operation of combined heat and power systems with demand response programs. Appl. Therm. Eng. 149, 1359–1369. doi:10.1016/j.applthermaleng.2018.12.088
Mavromatidis, G., Orehounig, K., and Carmeliet, J. (2018). A review of uncertainty characterisation approaches for the optimal design of distributed energy systems. Renew. Sustain. Energy Rev. 88, 258–277. doi:10.1016/j.rser.2018.02.021
Mirzaei, M. A., Nazari-Heris, M., Zare, K., Mohammadi-Ivatloo, B., Marzband, M., Asadi, S., et al. (2020). Evaluating the impact of multi-carrier energy storage systems in optimal operation of integrated electricity, gas and district heating networks. Appl. Therm. Eng. 176, 115413. doi:10.1016/j.applthermaleng.2020.115413
Mitra, S., and Domenica, N. D. (2010). A review of scenario generation methods. Int. J. Comput. Sci. Math. 3, 226–244. doi:10.1504/IJCSM.2010.037446
Mohammadi, M., Noorollahi, Y., Mohammadi-ivatloo, B., Hosseinzadeh, M., Yousefi, H., and Khorasani, S. T. (2018). Optimal management of energy hubs and smart energy hubs – a review. Renew. Sustain. Energy Rev. 89, 33–50. doi:10.1016/j.rser.2018.02.035
Oskouei, M. Z., Mohammadi-Ivatloo, B., Abapour, M., Shafiee, M., and Anvari-Moghaddam, A. (2021). Privacy-preserving mechanism for collaborative operation of high-renewable power systems and industrial energy hubs. Appl. Energy 283, 116338. doi:10.1016/j.apenergy.2020.116338
Pourmousavi, S. A., Nehrir, M. H., Colson, C. M., and Wang, C. (2010). Real-time energy management of a stand-alone hybrid wind-microturbine energy system using particle swarm optimization. IEEE Trans. Sustain. Energy 1, 193–201. doi:10.1109/tste.2010.2061881
Ren, F. K., Wang, J. J., Zhu, S. T., and Chen, Y. (2019). Multi-objective optimization of combined cooling, heating and power system integrated with solar and geothermal energies. Energy Convers. Manag. 197, 111866. doi:10.1016/j.enconman.2019.111866
Rosato, A., Sibilio, S., and Scorpio, M. (2014). Dynamic performance assessment of a residential building-integrated cogeneration system under different boundary conditions. Part I: Energy analysis. Energy Convers. Manag. 79, 731–748. doi:10.1016/j.enconman.2013.10.001
Ruhnau, O., Hirth, L., and Praktiknjo, A. (2019). Time series of heat demand and heat pump efficiency for energy system modeling. Sci. Data 6, 189. doi:10.1038/s41597-019-0199-y
Wang, J., Han, Z., and Guan, Z. (2020a). Hybrid solar-assisted combined cooling, heating, and power systems: A review. Renew. Sustain. Energy Rev. 133, 110256. doi:10.1016/j.rser.2020.110256
Wang, J. J., Jing, Y. Y., and Zhang, C. (2010b). Optimization of capacity and operation for CCHP system by genetic algorithm. Appl. Energy 87, 1325–1335. doi:10.1016/j.apenergy.2009.08.005
Wang, J. J., Lu, Z. R., Li, M., Lior, N., and Li, W. H. (2019a). Energy, exergy, exergoeconomic and environmental (4E) analysis of a distributed generation solar-assisted CCHP (combined cooling, heating and power) gas turbine system. Energy 175, 1246–1258. doi:10.1016/j.energy.2019.03.147
Wang, J. J., Yang, Y., Mao, T. Z., Sui, J., and Jin, H. G. (2015). Life cycle assessment (LCA) optimization of solar-assisted hybrid CCHP system. Appl. Energy 146, 38–52. doi:10.1016/j.apenergy.2015.02.056
Wang, J., Zhai, Z., Jing, Y., and Zhang, C. (2010a). Optimization design of BCHP system to maximize to save energy and reduce environmental impact. Energy 35, 3388–3398. doi:10.1016/j.energy.2010.04.029
Wang, M., Yu, H., Jing, R., Liu, H., Chen, P., and Li, C. (2020b). Combined multi-objective optimization and robustness analysis framework for building integrated energy system under uncertainty. Energy Convers. Manag. 208, 112589. doi:10.1016/j.enconman.2020.112589
Wang, M., Yu, H., Yang, Y., Lin, X., Guo, H., Li, C., et al. (2021). Unlocking emerging impacts of carbon tax on integrated energy systems through supply and demand co-optimization. Appl. Energy 302, 117579. doi:10.1016/j.apenergy.2021.117579
Wang, Y., Wang, X., Yu, H., Huang, Y., Dong, H., Qi, C., et al. (2019b). Optimal design of integrated energy system considering economics, autonomy and carbon emissions. J. Clean. Prod. 225, 563–578. doi:10.1016/j.jclepro.2019.03.025
Wu, G., Xiang, Y., Liu, J., Gou, J., Shen, X., Huang, Y., et al. (2020). Decentralized day-ahead scheduling of multi-area integrated electricity and natural gas systems considering reserve optimization. Energy 198, 117271. doi:10.1016/j.energy.2020.117271
Yu, J., Ryu, J.-H., and Lee, I.-b. (2019). A stochastic optimization approach to the design and operation planning of a hybrid renewable energy system. Appl. Energy 247, 212–220. doi:10.1016/j.apenergy.2019.03.207
Zakaria, A., Ismail, F. B., Lipu, M. S. H., and Hannan, M. A. (2020). Uncertainty models for stochastic optimization in renewable energy applications. Renew. Energy 145, 1543–1571. doi:10.1016/j.renene.2019.07.081
Zhang, X., and Vesselinov, V. V. (2017). Integrated modeling approach for optimal management of water, energy and food security nexus. Adv. Water Resour. 101, 1–10. doi:10.1016/j.advwatres.2016.12.017
Zheng, X., Qiu, Y., Zhan, X., Zhu, X., Keirstead, J., Shah, N., et al. (2017). Optimization based planning of urban energy systems: Retrofitting a Chinese industrial park as a case-study. Energy 139, 31–41. doi:10.1016/j.energy.2017.07.139
Zhou, Y., and Gu, A. (2019). Analysis of cost reduction and abatement carbon price of wind power in China. Renew. energy Resour. 37, 1084–1090. doi:10.13941/j.cnki.21-1469/tk.2019.07.022
Zhou, Z., Zhang, J., Liu, P., Li, Z., Georgiadis, M. C., and Pistikopoulos, E. N. (2013). A two-stage stochastic programming model for the optimal design of distributed energy systems. Appl. Energy 103, 135–144. doi:10.1016/j.apenergy.2012.09.019
Keywords: system design, management strategies, optimization, combined heat and power system, uncertainty
Citation: Liu H, Miao Z, Wang N and Yang Y (2022) A two-layer optimization of design and operational management of a hybrid combined heat and power system. Front. Energy Res. 10:959774. doi: 10.3389/fenrg.2022.959774
Received: 02 June 2022; Accepted: 30 August 2022;
Published: 23 September 2022.
Edited by:
Anderson Rodrigo De Queiroz, North Carolina Central University, United StatesReviewed by:
Rui Jing, Xiamen University, ChinaJiangjiang Wang, North China Electric Power University, China
Giancarlo Aquila, Federal University of Itajubá, Brazil
Copyright © 2022 Liu, Miao, Wang and Yang. This is an open-access article distributed under the terms of the Creative Commons Attribution License (CC BY). The use, distribution or reproduction in other forums is permitted, provided the original author(s) and the copyright owner(s) are credited and that the original publication in this journal is cited, in accordance with accepted academic practice. No use, distribution or reproduction is permitted which does not comply with these terms.
*Correspondence: Hao Liu, bGl1aGFvMDVAc3BpYy5jb20uY24=