 Jianming Xu
 Anfeng Liu2
 Yibo Tang
- 1Provincial Key Laboratory of Informational Service for Rural Area of Southwestern Hunan, Shaoyang University, Shaoyang, China
- 2School of Computer Science and Engineer, Central South University, Changsha, China
- 3College of Physics and Electronics, Central South University, Changsha, China
This article presents a power system joint optimization generation regulation method based on the improved balance optimizer, which takes the five factors of power system network loss, voltage offset, generation cost, fuel cost, and comprehensive pollution emission as the objective function and takes the internal power balance of the system, each generator set, generation capacity, generation flow, and up and down climbing as the constraints. Fully considering the current energy-saving development objectives and the impact of economic dispatching, taking stable and safe operation as the core, the power generation dispatching model is established by improving the balance optimizer. The model realizes the maximum power generation with the lowest energy consumption parameters and transitions from the original power generation energy consumption of the power system to the best energy-saving power generation energy consumption so that the power value of the system reaches the target balance and completes efficient dispatching. Simulation experiments show that the proposed method can ensure the most reasonable power load in both summer and winter. The average load in summer and winter is reduced from 254.78/mw to 205.36/mw, down about 19.39%, which can ensure the power generation stability of the power system. The average power generation cost after dispatching is 129,920 $/h, which is significantly improved by comparing with 131,225 $/h before dispatching and can realize certain environmental benefits.
Introduction
At this stage, with the continuous development of the power era, the development of power technology is an important task that cannot be ignored by all countries at this stage. People’s life, entertainment, and social production are inseparable from the support of power. However, with the increasing power consumption of users and the large-scale high load (Le et al., 2021) power consumption of various large enterprises, in order to speed up the pace of production, system failures occur frequently and the internal power distribution is uneven. The long-term uneven distribution will not only lead to short circuit (Toyoda and Wu, 2019), power climbing, and insufficient or excessive power generation but will also lead to unstable operation of the power system, increased cost, and poor power generation efficiency (Wu et al., 2020). Based on this, it is necessary to make reasonable arrangement and dispatching planning. Effective generation dispatching can not only make the operation of the power system more stable without fault impact but also recover the highest benefit return with the lowest generation cost.
This literature (Zhang et al., 2022) mainly aims at the mixed phenomenon of AC and DC in the power system. The power generation problem of the system is quasi-transformed into the optimal power flow calculation problem. Taking four groups of phenomena such as network loss, power generation cost, pollutant emission, and voltage offset as the objective function, the differential evolution method is used to solve the generation scheduling parameters of the four groups of objective functions. The literature (Li et al., 2021a) proposed a genetic algorithm based on the neural network. Compared with the traditional methods, the genetic algorithm can capture the key information affecting power generation faster so as to converge to higher quality reactive power optimization scheme better and faster. The document (Li et al., 2021b) proposes the generation scheduling optimization strategy of swarm intelligence algorithm, which divides the optimal generation scheduling into two stages: search and utilization. The search process generally introduces disturbance variables so that the whole optimization process can find the target value faster and achieve global and large-scale optimization. Hu et al., (2020) propose an optimal generation scheduling algorithm with key parameter constraints. By setting different scheduling parameters for different generation values, it makes detailed optimization in the process of continuous updating among them. Shan et al., (2020) adopt a cross-platform generation scheduling algorithm, set models that can describe different nodes in the power system, and establish a joint scheduling threshold for scheduling. Yan et al., (2016) calculates the power value with linear change in the power system, sets the standard threshold, finds the power points that do not conform to the linear change, and implements generation dispatching.
On this basis, considering the abovementioned shortcomings and adverse effects, this study proposes a power system joint optimal generation scheduling method based on the improved balance optimizer. Balance optimizer is a new intelligent algorithm. It adopts the power generation optimization strategy inspired by the balance physical phenomenon based on the control volume mass and has strong data optimization ability, fast calculation speed, and fast convergence speed. First, the objective function is established, and then the condition constraints are carried out. An improved balance optimizer method is used to build a joint optimal generation scheduling model. On the basis of the original balance optimizer, the power variation objective function considering the actual maximization of the power system is added, and the objective constraint function is used to further approximate the optimal dispatching value. The optimization strategy can better adapt to the actual power generation situation of the power system and shows relatively best optimization performance. After the completion of dispatching, the system generates electricity smoothly, reduces the cost and power consumption, and greatly improves the operation efficiency.
Objective Function Establishment
The improved balance optimizer follows the principle of mass balance equation in physics and describes the whole process of mass entering, leaving, and generating in a control volume. When applied to the joint optimal generation scheduling of the power system, the power target can be regarded as a mass point, the process of this mass point can be described, and finally the most balanced power value can be output. The objective function described, based on the improved balance optimizer, is
1) Power system network loss, expressed as
In the formula,
2) Voltage offset
In the formula,
3) Power generation cost, the average cost consumption of power generation fuel can be expressed as
In the formula,
of which
In the formula,
4) Fuel costs. The power generation fuel characteristics of the power system can be expressed by the quadratic function (Long et al., 2018), and the system fuel cost is
In the formula,
In the formula,
5) Comprehensive emission of pollution (Souza et al., 2018a). The emission calculation formula is
In the formula,
Constraint Function
The objective function and constraint conditions belong to a complementary variable relationship. In the whole power generation dispatching system, the objective function is not only the reference of the dispatching model but also the independent variable, and the constraint conditions are appropriate linear programming based on the objective function, which is also the dependent variable. The constraint model of the power system is given as follows.
Internal power balance constraints (Souza et al., 2018b) refer to the balance between power supply and load in the power system. The generation capacity of the power system is determined according to the predicted power system load, which is a part of power planning. Restricting it can help the power system to achieve smooth operation:
In the formula,
Output (Abdin et al., 2022) constraint of the fuel generator set. As an important part of the power system, the fuel generator set can help achieve accurate dispatching in the next step by adopting the targeted constraint strategies:
In the formula,
Output constraint of the kerosene generator set:
In the formula,
Generation capacity limitations. Including normal operation capacity, emergency reserve capacity, and maintenance reserve capacity and taking the maximum capacity that the power system can bear as the objective, the constraint function is established:
In the formula,
The power generation flow is about (Ebramsyah et al., 2017) bundles. Generation flow is an important index to evaluate the superiority of power dispatching, and the constraint function is established according to the national flow standard:
In the formula,
Generation Load Balancing Constraints
Table 1 shows the load required for power generation load balance, and the average value used as the load reference standard.
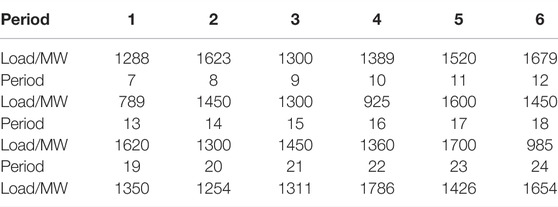
TABLE 1. Load required in 24 h.
In the formula,
Generation constraints at the beginning and end of the power system. The power period is segmented to restrict the power generation at the beginning and end of the period:
In the formula,
The reactive power constraint of the generator set. It means that in an AC circuit with reactance, the electric field or magnetic field absorbs energy from the power supply in one part of a cycle and releases energy in the other part of the cycle. The average power in the whole cycle is zero. It is related to the problem of repeated energy exchange between the power system and power supply:
In the formula,
Climbing Event Constraints on Power Load
Due to the influence of external factors or human factors, the power system is prone to power load climbing events. Power load climbing (Meyendorf et al., 2017) refers to the phenomenon of large-scale increase or decrease of system power in a short time, which is easy to cause an imbalance of system active power, destroy the frequency stability, and even cause large-scale die-cutting load, which seriously threatens the safety and stability of power grid and economic operation. In this article, this kind of event is regarded as an accidental event for optimal generation scheduling for scheduling regulation, and the changes of power system voltage, fluctuation rate (Dong et al., 2020), and other parameters during power load climbing are solved. The prediction algorithm is used to predict the linear change of power in the next step, and reasonable scheduling is carried out according to the change value.
There is
In the formula,
Climbing Event Constraint Under Power Load
The downward climbing and upward climbing performance of the power load are basically the same, both in a phased downward (Calzarossa et al., 2019) trend, and there is a downward trend at the second time point. The maximum climbing amplitude is set in the unit of rated step size of the power system (Prada, 2017) as
1) When the system goes downhill, a reasonable load shedding method shall be adopted before starting time
2) When the system goes downhill, after the starting time
Generation Scheduling Model of Power System
Based on the peak valley TOU price on the demand side, the energy-saving power generation dispatching on the generation side (Chao et al., 2016) is globally optimized. Through the analysis of the time price response of the user end, it can be seen that the market means will change the original system load distribution pattern. Through peak load regulation (Faghihi et al., 2016) and valley filling, the system load fluctuation level is reduced, the unit peak load regulation pressure is reduced, the utilization rate of the high-energy units is improved, and the coal consumption of the corresponding units is reduced. In view of this, an energy-saving generation scheduling optimization model based on the global (Kelley et al., 2018) energy consumption optimization is constructed with the adjustment range of peak valley TOU price on the demand side, unit output on the generation side, and unit startup and shutdown status as the central policy variables. Figure 1 1) shows the daily power consumption and operation cost scheduling analysis of the power system.
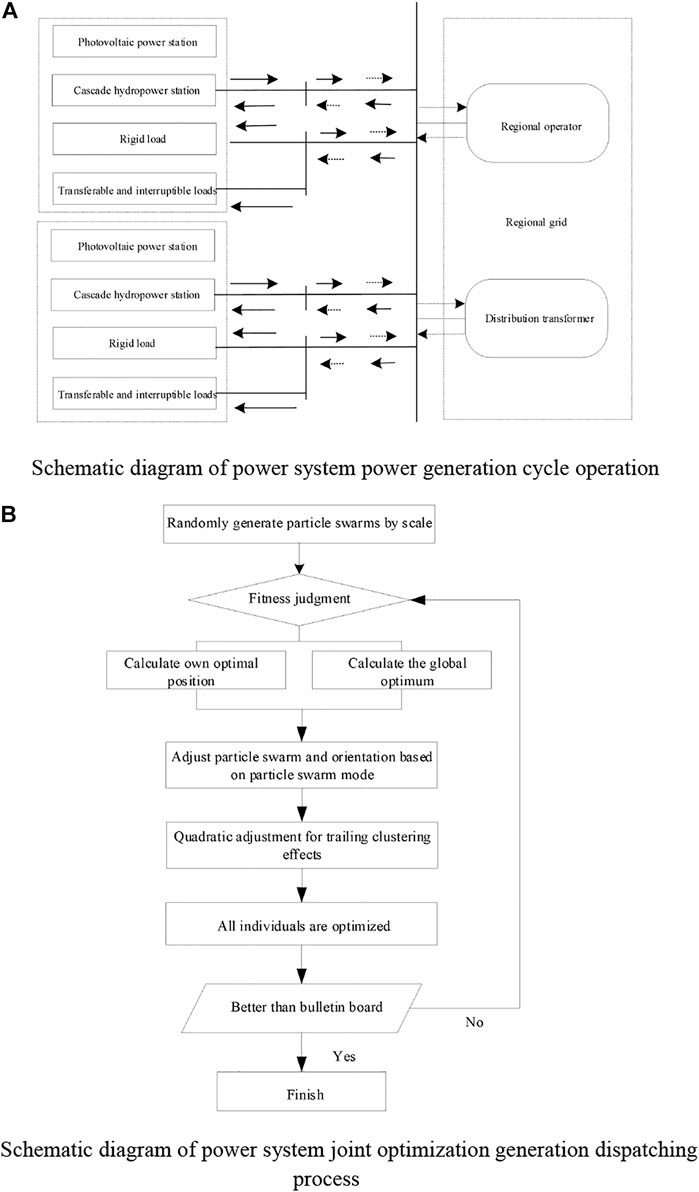
FIGURE 1. Schematic diagram of power system operation and dispatch. (A) Schematic diagram of power system power generation cycle operation. (B) Schematic diagram of power system joint optimization generation dispatching process.
The power system joint optimization energy-saving generation scheduling model is constructed as follows:
In the formula,
In order to further ensure the scheduling quality, a secondary constraint of the decision variable (Kadota et al., 2018) on the scheduling model (Bhattacharya et al., 2019)
Simulation Experiment
In order to verify the effectiveness of the proposed scheduling model and method, two different power system generation environments are set, summer and winter, respectively. The power system consists of one with four hydropower stations and three thermal power generating units. The typical test system is used for calculation and analysis. The total installed capacity of the system is 297.5 mw. The average power consumption rate of the power generation side of the hydropower station and thermal power plant is 80%. The maximum power load is 300 MW, and the minimum power load is 150 MW. The population size of the two algorithms is 40, and the maximum number of iterations is 1,000.
It can be seen from Figures 2A,B, the generation scheduling model proposed in this article can make full use of the internal adjustability of power system generator units, effectively reduce the peak valley difference of load, and make the residual load more stable. After power generation dispatching, the mean square deviation of the load is greatly reduced, and the peak valley difference is significantly reduced. In summer, the original power generation load variance is 256.813/mw. After effective dispatching, the residual power generation load variance is reduced to 197.265/mw, and the power generation load drop difference is 26.31%.
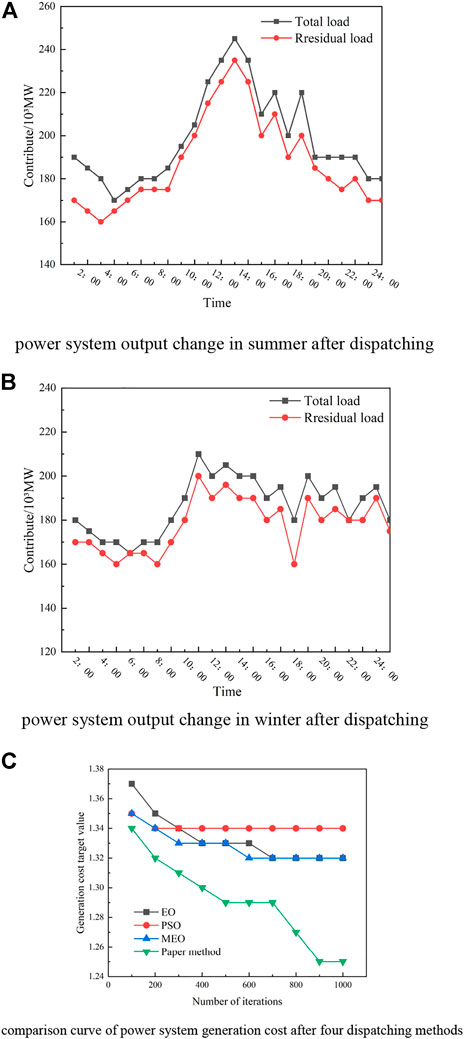
FIGURE 2. Post-dispatch changes in the power system. (A) Power system output change in summer after dispatching. (B) Power system output change in winter after dispatching. (C) Comparison curve of power system generation cost after the four dispatching methods.
From Figure 2, the power generation cost of this method is the lowest among them, and the computational robustness is better than that of the particle swarm optimization algorithm. When the number of scheduling iterations is 600, the cost target value in this study is about 1.290, while the target values of the other three methods are 1.332, 1.338, and 1.348, respectively, which are higher than those in this study. The overall cost value of the EO method shows a flat trend, indicating that the cost has not been improved after iteration. Among all methods, the declining trend of this method is the most obvious. After power generation dispatching, the cost improvement phenomenon is the best.
The dispatching results of the four comparison algorithms on the target value of power generation cost of the power system are shown in Table 2.
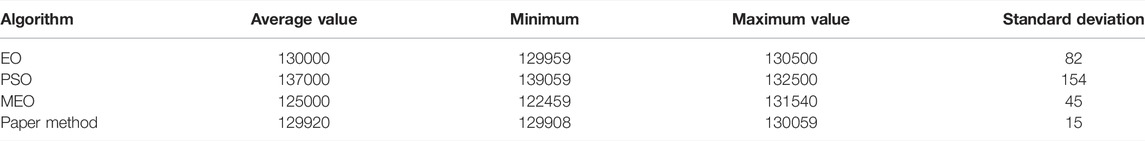
TABLE 2. Target value of power system generation cost obtained by the four methods.
Through the comparison of the maximum values in Table 2, it can be seen that this study is 130,059, and the other three methods are 130,500, 132,500, and 131,540. This study is the lowest among them, and the scheduling performance is the best. Compared with the lowest value, this study is 129,908, and the other three methods are 129,959, 139,059, and 122,459. This study is still the lowest value. Through comprehensive comparison, this study performs the best.
Conclusion
In this article, a power system joint optimal generation scheduling method based on the improved balance optimizer is proposed, and the following conclusions are drawn:
1) Through the establishment of conditional constraint function including the concept of objective, the effective constraint on the power load climbing event is realized, which greatly reduces the subsequent calculation error caused by misjudgment and improves the quality of dispatching.
2) Based on the current comprehensive power saving policy and the premise of safety core, this study also establishes the power system joint optimization generation scheduling model, which fundamentally solves the problems of high power generation cost and high power generation energy consumption.
3) After adopting this method, the cost is reduced from the initial USD 131225/h to USD 129920/h, and the power load is also reduced from 254.78/mw to 205.36/mw. This method has high practical value.
Data Availability Statement
The original contributions presented in the study are included in the article/Supplementary Material. Further inquiries can be directed to the corresponding author.
Author Contributions
JX and YT conceived and designed the calculations and experiments; YQ and AL performed the simulation; GX contributed analysis tools; JX and YT wrote the manuscript.
Conflict of Interest
The authors declare that the research was conducted in the absence of any commercial or financial relationships that could be construed as a potential conflict of interest.
Publisher’s Note
All claims expressed in this article are solely those of the authors and do not necessarily represent those of their affiliated organizations, or those of the publisher, the editors, and the reviewers. Any product that may be evaluated in this article, or claim that may be made by its manufacturer, is not guaranteed or endorsed by the publisher.
References
Abdin, A. F., Caunhye, A., Zio, E., and Cardin, M.-A. (2022). Optimizing Generation Expansion Planning with Operational Uncertainty: A Multistage Adaptive Robust Approach. Appl. Energy 306, 118032. doi:10.1016/j.apenergy.2021.118032
Bhattacharya, B., Chakraborty, N., and Mandal, K. K. (2019). A Cost‐optimized Power Management Strategy for Combined Wind Thermal–Pumped Hydro Generation Considering Wind Power Uncertainty[J]. Int. Trans. Electr. Energy Syst. 29 (7). e12104. doi:10.1002/2050-7038.12104
Calzarossa, M. C., Vedova, M. D., and Tessera, D. (2018). A Methodological Framework for Cloud Resource Provisioning and Scheduling of Data Parallel Applications under Uncertainty[J]. Future Gener. Comput. Syst. 93. 212–223. doi:10.1016/j.future.2018.10.037
Calzarossa, M. C., Della Vedova, M. L., and Tessera, D. (2019). A Methodological Framework for Cloud Resource Provisioning and Scheduling of Data Parallel Applications under Uncertainty. Future gener. Comput. Syst. 93 (APR), 212–223. doi:10.1016/j.future.2018.10.037
Chao, Z., Li, H., Tian, M., and Zhou, J. (2016). “Analysis on the Influence of Rotational Inertia Level of Sending System on Transmission Capability[C],” in 2015 5th International Conference on Electric Utility Deregulation and Restructuring and Power Technologies (DRPT) (IEEE).
Dong, H., Li, S., Dong, H., Tian, Z., and Hillmansen, S. (2020). Coordinated Scheduling Strategy for Distributed Generation Considering Uncertainties in Smart Grids[J]. IEEE Access 8, 86171–86179. doi:10.1109/ACCESS.2020.2992342
Ebramsyah, A., Joy, A., Miller, C., Stevens, J., and Patil, P. (2017). Optimizing Student Workforce Scheduling at PSU Office of Information Technology (OIT).
Faghihi, V., Reinschmidt, K. F., and Kang, J. H. (2016). Objective-driven and Pareto Front Analysis: Optimizing Time, Cost, and Job-Site Movements. Automation Constr. 69, 79–88. doi:10.1016/j.autcon.2016.06.003
Hu, J., Chen, H., Heidari, A. A., Wang, M., and Pan, Z. (2020). Orthogonal Learning Covariance Matrix for Defect of Grey Wolf Optimizer: Insights, Balance, Diversity, and Feature Selection. Knowledge-Based Syst. 213. doi:10.1016/j.knosys.2020.106684
Kadota, I., Sinha, A., and Modiano, E. H. (2018). “Optimizing Age of Information in Wireless Networks with Throughput Constraints,” in IEEE INFOCOM 2018 - IEEE Conference on Computer Communications.
Kelley, M. T., Pattison, R. C., Baldick, R., and Baldea, M. (2018). An MILP Framework for Optimizing Demand Response Operation of Air Separation Units[J]. Inst. Electron. Inf. Commun. Eng. 222, 951–966. doi:10.1016/j.apenergy.2017.12.127
Le, S., Wu, Y., Guo, Y., and Vecchio, C. D. (2021). Game Theoretic Approach for a Service Function Chain Routing in NFV with Coupled Constraints[J]. Circuits Syst. II Express Briefs, IEEE Trans. 99, 1.
Li, H., Deng, J., Feng, P., Pu, C., Arachchige, D. D. K., and Cheng, Q. (2021a). Short-Term Nacelle Orientation Forecasting Using Bilinear Transformation and ICEEMDAN Framework. Front. Energy Res. 9, 780928. doi:10.3389/fenrg.2021.780928
Li, H., Deng, J., Yuan, S., Feng, P., and Arachchige, D. D. K. (2021b). Monitoring and Identifying Wind Turbine Generator Bearing Faults Using Deep Belief Network and EWMA Control Charts. Front. Energy Res. 9, 799039. doi:10.3389/fenrg.2021.799039
Li, Y. Z., Zheng, X. W., and Lu, D. J. (2016). “Virtual Network Embedding Based on Multi-Objective Group Search Optimizer,” in International Conference on Broadband & Wireless Computing.
Long, W., Jiao, J., Liang, X., and Tang, M. (2018). An Exploration-Enhanced Grey Wolf Optimizer to Solve High-Dimensional Numerical Optimization. Eng. Appl. Artif. Intell. 68, 63–80. doi:10.1016/j.engappai.2017.10.024
Martinez Caama, O. J. M., Selva, M., Clauss, P., et al. (2017). Full Runtime Polyhedral Optimizing Loop Transformations with the Generation, Instantiation, and Scheduling of code-Bones[J]. Concurrency Comput. Pract. Exp. 29 (15), e4192. doi:10.1002/cpe.4192
Meyendorf, N. G., Nithin, A. H., and Omenzetter, P. (2017). Scheduling Structural Health Monitoring Activities for Optimizing Life-Cycle Costs and Reliability of Wind Turbinesat.
Prada, J. F . (2017). Ensuring the Reliable Operation of the Power Grid: State-Based and Distributed Approaches to Scheduling Energy and Contingency Reserves. United States: Carnegie Mellon University.
Shan, W., Qiao, Z., Heidari, A. A., Chen, H., and Teng, Y. (2020). Double Adaptive Weights for Stabilization of Moth Flame Optimizer: Balance Analysis, Engineering Cases, and Medical Diagnosis. Knowledge-Based Syst. 214. doi:10.1016/j.knosys.2020.106728
Silva, F., Torresknoop, A., Coopmans, T., Maier, D., and Wehner, S. (2021). Optimizing Entanglement Generation and Distribution Using Genetic Algorithms. Quantum Sci. Technol. 035007, 26. doi:10.1088/2058-9565/abfc93
Souza, G., Deus, D., Tadaiesky, V., et al. (2018a). Optimizing Tasks Generation for Children in the Early Stages of Literacy Teaching: a Study Using Bio-Inspired Metaheuristics. Soft Comput. A fusion Found. Methodol. Appl. 22, 6811–6824. doi:10.1007/s00500-018-3409-1
Souza, G., Deus, D., Tadaiesky, V., et al. (2018b). Optimizing Tasks Generation for Children in the Early Stages of Literacy Teaching: a Study Using Bio-Inspired Metaheuristics[J]. Soft Comput. 22 (3). 6811–6824. doi:10.1007/s00500-018-3409-1
Tian, X. Q., Xu, T., Wang, X. L., et al. (2016). “The Synergic Scheduling Optimization and Effectiveness Evaluation Model for Multi-Types Generation Resources Considering Emission Constraints,” in International Conference on Material Engineering & Application.
Toyoda, M., and Wu, Y. (2019). Mayer-type Optimal Control of Probabilistic Boolean Control Network with Uncertain Selection Probabilities. IEEE Trans. Cybern. 51, 3079–3092. doi:10.1109/TCYB.2019.2954849
Wang, Y.-R., Huang, K.-C., and Wang, F.-J. (2016). Scheduling Online Mixed-Parallel Workflows of Rigid Tasks in Heterogeneous Multi-Cluster Environments. Future Gener. Comput. Syst. 60 (jul), 35–47. doi:10.1016/j.future.2016.01.013
Wu, Y., Guo, Y., and Toyoda, M. (2020). Policy Iteration Approach to the Infinite Horizon Average Optimal Control of Probabilistic Boolean Networks[J]. IEEE Trans. Neural Netw. Learn. Syst. 32, 2910–2924. doi:10.1109/TNNLS.2020.3008960
Yan, J., Ruan, S., Cai, Q., et al. (2016). “A Novel Bi-objective Model with Particle Swarm Optimizer for Structural Balance Analytics in Social Networks,” in 2016 IEEE Congress on Evolutionary Computation (CEC), Vancouver, BC, Canada, 24-29 July 2016. doi:10.1109/cec.2016.7743864
Keywords: balance optimizer, power system, objective function, energy consumption parameters, power generation cost
Citation: Xu J, Liu A, Qin Y, Xu G and Tang Y (2022) Research on Power System Joint Optimal Generation Scheduling Based on Improved Balance Optimizer. Front. Energy Res. 10:958384. doi: 10.3389/fenrg.2022.958384
Received: 31 May 2022; Accepted: 13 June 2022;
Published: 16 August 2022.
Edited by:
Yusen He, The University of Iowa, United StatesReviewed by:
Heming Huang, Wuhan University, ChinaYan Zhang, Tokyo University of Agriculture and Technology, Japan
Copyright © 2022 Xu, Liu, Qin, Xu and Tang. This is an open-access article distributed under the terms of the Creative Commons Attribution License (CC BY). The use, distribution or reproduction in other forums is permitted, provided the original author(s) and the copyright owner(s) are credited and that the original publication in this journal is cited, in accordance with accepted academic practice. No use, distribution or reproduction is permitted which does not comply with these terms.
*Correspondence: Yibo Tang, NjI2MzIzMzIwQHFxLmNvbQ==