 Cheng Shen
 Bo Zeng
95% of researchers rate our articles as excellent or good
Learn more about the work of our research integrity team to safeguard the quality of each article we publish.
Find out more
METHODS article
Front. Energy Res. , 14 July 2022
Sec. Advanced Clean Fuel Technologies
Volume 10 - 2022 | https://doi.org/10.3389/fenrg.2022.958040
This article is part of the Research Topic The Challenge and Opportunity of CCUS in the Development of Unconventional Resource View all 15 articles
Casing deformation (CD) will seriously affect the fracturing progress and stimulation effect of shale gas. Taking 105 gas wells in the Luzhou shale gas area in southern Sichuan as an example, the CD prediction model was established by introducing the fracture operation curve diagnosis method to analyze the changes in net pressure and propagation mode during fracturing. The fracturing stage induced by CD is called the excited (ET) stage, and the fracturing stage that occurs during CD is called the CD stage. It is concluded that the change of net pressure and the propagation mode are coupled with each other. By natural fracture development, formation curvature and horizontal well trajectory, natural fractures and bedding have been active by high fracturing strength, or because of the frequent crossing-layer in single stage, local stress reverse, makes the net pressure decrease and makes the formation in strike-slip stress state to reverse fault stress state, liquid leak-off and blocked fracture propagation time are increased, thus inducing CD. According to the response law induced by CD, the CD pre-control mode is formed, and the CD pre-control technology is established to quantitatively evaluate the wellbore risk and optimize the fracturing operation order and time arrangement. The CD rate is reduced from 56% in the early stage to 20%, and the integrity of the wellbore is guaranteed to be 100%. The method has strong applicability in the field and can be further popularized.
According to the results of many scholars at home and abroad, casing deformation (CD) is mainly affected by geological and engineering factors. In terms of geology, the main media of CD in shale gas wells is a large number of natural fractures and faults in the reservoir (Daneshy, 2005; Yu et al., 2014; Bao and Eaton, 2016; Chen et al., 2016; Chen et al., 2017; Chen et al., 2019; Yan et al., 2019; Chen et al., 2021; Meyer et al., 2018; Schultz et al., 2018; Liu et al., 2019; Liu et al., 2020; Fan et al., 2020; Hu et al., 2020; Peng et al., 2020a; Peng et al., 2020b; Qiao and Ye, 2021; Tong et al., 2021a; Cheng et al., 2022; Meng et al. 2020). In terms of engineering, CD occurs mostly after fracturing, so it is proposed that natural fractures and faults slip when large volume fracturing fluid enters the reservoir. Natural fracture and fault slip and stratum slip and dislocation are the main engineering causes of casing shear deformation (Gao et al. 2017; Gao et al. 2021; Lu et al., 2021). For the casing itself, Zhang et al. (2015) suggest that sudden pressure release within the casing at the end of large-rate fracturing places the casing in the most vulnerable conditions of collapse failure. Yin et al. (2018a), Yin et al. 2018b, Yin et al. 2018c) proposed that variation of annular pressure caused by cold fracturing fluid increases the risks of casing deformation. Sugden et al. (2012), Xi et al. (2019), Lian et al. (2020), Guo et al. (2018), Guo et al. (2019), Zhang X. et al (2021) and others proposed that the cementing quality problems such as casing eccentricity and lack of cement sheath cause asymmetric load on the casing, and the effects of fracturing fluid on the difference of temperature from the heel to the toe end of the lateral increases the risks of casing failure at the heel end stages.
In the south of the Sichuan shale block, engineers of drilling and fracturing have taken different measures to solve the CD: ①The drilling operator prevented casing deformation by increasing the cement sheath and casing wall thickness to enhance casing strength. Nevertheless, the maximum casing curvature is merely reduced by 8% (Gao et al. 2017; Yin et al., 2018c; Lu et al., 2021), and casing deformation still occurs in seven out of eight test wells. ②According to the geological model, the fracturing engineer simulated the effects of fault activation and bedding plane hydration expansion on fracturing treatment (McClure and Horne, 2011; Rutqvist et al., 2015; Zhang et al., 2020a, Zhang et al., 2020b; Zhang Xin et al., 2021; Li J. et al., 2021; Li X. et al., 2021), high-density completion, reduction in the fracturing fluid volume and treatment rate, compound temporary plugging technique have been used to reducing the activity of the fracture system. Nevertheless, these approaches are still ineffective in the study area (Zhang X. et al., 2021; Tong et al., 2021b; Zhang P. et al., 2021). Analysis shows that the existing CD prevention and control methods have a large probability of failure in the study area, which is mainly caused by the insufficient accuracy of fracture prediction and the untimely adjustment of fracturing parameters.
Mainguy (2016) proposed that deformation of the weak surface is caused by slippage and dislocation along a discontinuous surface, which results from energy accumulation triggering the weak surface to reach the slippage state, and there is an energy accumulation process. The fracturing curve reflects and indicates energy variation and accumulation during the fracturing treatment, and it has been widely used in evaluation of stimulation effects and proppant plugging risks in carbonate rock, coalbed methane, tight gas, volcanic rock, and shale gas reservoirs (Nolte and Smith., 1981; Pirayesh et al., 2015; Bian et al., 2016; Zhang et al., 2018; Zhuang et al., 2019; Chen et al., 2020; Hu et al., 2020; Zhao et al., 2022; Shen et al. 2022). It provides the visual data for controlling the fracturing process. In this paper, the geological-engineering parameters of 56 CD gas wells in the study area were acquired to fully excavate the information from the fracturing curve, and the “process control” was emphasized. A model and technology for prevention and pre-control of casing deformation based on diagnostics of shale gas fracturing curves were formed and applied in the field, which provides guidance for fracturing treatment in the current and later stages and reduces the rate of casing deformation.
To prevent and control casing deformation in shale gas fracturing, it is necessary to establish a bottom-hole net pressure model, an induced stress model, and a casing deformation prediction model.
When not considering the induced stress generated by the prior fracturing stage, the bottom hole net pressure of fracturing stages is obtained by calculating casing pressure at wellhead, hydrostatic column pressure, perforation friction, borehole friction, and minimum horizontal principal stress as follows:
Here Pnet n-real-time net pressure when considering the induced stress during the fracturing process of the nth stage, MPa; PHead n-real-time treatment casing pressure at the wellhead during the fracturing process of the n th stage, Mpa; PString n-real-time proppant-carrying slurry static column pressure in the nth stage, Mpa; Pnf n-real-time perforation hole friction on the fracture entry in the nth stage, Mpa; Pwf n-real-time borehole friction in the nth stage, Mpa; σmin n-minimum horizontal principal stress of the nth stage, Mpa.
In addition, PString n, Pnf n, Pnf n, and Pwf n are calculated as follows.
The real-time proppant-carrying slurry column static pressure is calculated by referring to the hydrostatic column pressure at the burial depth of each stage:
Here ρfrac n is the real-time fracturing fluid density of the nth stage, kg/m3; g is the acceleration of gravity, m/s2, which is 9.8; hn is the average vertical depth from the logging interpretation of the fracturing stage, m.
During the fracturing process, the slurry is carrying the proppant; the real-time proppant-carrying slurry column static pressure cannot be calculated only by the hydrostatic column pressure, and the fracturing fluid density should be modified.
Here wn is the actual proppant concentration of slurry in fracturing stage, kg/m3; ρPropV is the proppant density applied in fracturing stage, kg/m3; ρProp is the apparent density of the proppant applied in fracturing stage, kg/m3; ρFluid is the fracturing fluid density applied in fracturing stage, kg/m3.
When the fracturing fluid flows through the borehole to the reservoir, friction is generated within the borehole. The friction is currently related to the treatment rate and fluid properties. A real-time borehole friction model is established as follows:
Here λ is the hydraulic friction coefficient, dimensionless; L is the bottom measured depth of fracturing stage, m; vs is the real-time flow rate of proppant-carrying slurry, m/s; D is the borehole diameter, m.
The real-time flow rate of proppant-carrying slurry is calculated as follows:
Here q is the real-time fracturing rate, m3/min.
In addition, the hydraulic friction coefficient is determined by defining the Reynolds number:
Here Re is the Reynolds number, dimensionless; μ is the fracturing fluid viscosity, mPa·s.
Based on the Reynolds number, the criterion for the hydraulic friction coefficient is established: when Re2000, the hydraulic friction coefficient is determined by Eq. 8; when 2000 < Re < 59.7/(2R/D)8/7, it is determined by Eq. 9; when 59.7/(2R/D)8/7 < Re<[665-765z (2R/D)]/(2R/D), it is determined by Eq. 10; when Re>[665-765lg (2R/D)]/(2R/D), it is determined by Eq. 11.
When the fracturing fluid flows through the borehole to the formation, it passes through the perforation holes, resulting in frictional resistance. The friction is currently related to the perforation hole numbers, hole diameter, and fracturing rate. A real-time perforation hole friction model is established as follows:
Here R is the absolute roughness of the borehole wall, m; Pnf is the real-time perforation hole friction on the fracture entry during fracturing, MPa; nnf is the perforation hole number of the fracturing stage, number; dnf is the perforation hole diameter of the fracturing stage, m; αnf is the flow coefficient at the perforation hole, dimensionless.
The previous stage will produce superimposed induced stress on the current stage, which will cause the original formation stress state to change and affect the real-time net pressure of this section. Stress influence, establishes a real-time induced stress superposition model:
Here Pnet(n) is the real-time effective net pressure when considering the induced stress generated in the fracturing process of the nth stage, MPa; σxin is the real-time induced stress generated at the fracture entry of the nth stage by the fracture entry of the ith stage at the minimum horizontal principal stress direction, MPa.
The induced stress generated by the fracturing stage itself and the prior stage is acted upon along the minimum horizontal principal stress and the maximum horizontal principal stress. The induced stress generated at the fracture entry of the nth stage by the fracture entry of the ith stage at the minimum horizontal principal stress direction is calculated as follows:
Here c is the reservoir half thickness, m; L (i, n) is the difference in measured depth between the middle of the ith stage and the middle of the nth stage, m.
Similarly, the induced stress generated at the fracture entry of the nth stage by the fracture entry of the ith stage at the maximum horizontal principal stress direction is calculated as follows:
Here σyin is the real-time induced stress generated at the fracture entry of the nth stage by the fracture entry of the ith stage at the maximum horizontal principal stress direction, MPa; ν is the average Poisson’s ratio obtained from logging interpretation of the fractured stage, dimensionless.
In addition, to carry out research on the in situ stress in the study area, the current in situ stress field is calculated as follows:
Here σx′ is the real-time minimum horizontal principal stress during fracturing, MPa; σy′ is the real-time maximum horizontal principal stress during fracturing, MPa; σy is the average maximum horizontal principal stress obtained from logging interpretation point in the fractured stage, MPa.
A total of six response trends, including fluid leak-off and fracture propagation blockage (Zhao et al., 2022) when the hydraulic fracture encounters the natural fracture, are identified. First, the curve is divided into several sections. The net pressure curve obtained from fracture diagnostics is divided into multiple sections according to the trend of monotonic increase and decrease by using Fisher’s optimal segmentation method, and the slope of the monotonic change of net pressure in each section is read as follows:
Here Pnet(n)start j is the initial real-time effective net pressure when considering the induced stress during the jth section in the nth stage, MPa; Pnet(n)end j is the final real-time effective net pressure when considering the induced stress during the jth section in the nth stage, MPa; t(n)start j is the time when the jth section in the nth stage starts, min; t(n)end j is the time when the jth section in the nth stage ends, min.
A model for determining fluid leak-off is established as follows:
Here ΔS is the stress contrast in the reservoir and upper and lower interlayers, MPa.
A model for determining fracture propagation blockage has been established as follows:
Here
Here σz′ is the real-time vertical stress in the fracturing process, MPa; θnf is the approach angle, °; φnf is the dip angle, °; Stnf is the tensile strength, MPa; τo is the cohesion, MPa; knf is the friction coefficient, dimensionless; σnf is the normal stress on the fracture wall, MPa; στ is the tangential stress on the fracture wall, MPa.
It is assumed that fluid leak-off and fracture propagation blockage occur during the jth section in the nth stage, and the duration is recorded as tlnj and trnj, respectively. When fluid leak-off or fracture propagation blockage occurs, the risk of casing deformation in the fracturing process is determined. If necessary, the sum of the duration of increasing the risk of casing deformation in the nth stage is recorded as:
Here ttn is the total duration of fluid leak-off and fracture propagation blockage in the nth stage, min; tlnj is the duration of fluid leak-off during the jth section of the nth stage; trnj is the duration of fracture propagation blockage during the jth section of the jth stage, min.
The study area covers the well blocks L and Y in the Luzhou Area. Natural fractures and faults have developed in the area, which also shows strong segmentation characteristics with formation in blocks. Because the horizontal stage frequently passes through natural fractures, faults, or different horizons, it is difficult to drill gas wells in the area. The horizontal stage of the gas well in the area is about 1800 m long in total and about 60–80 m long in each segmented stage. The number of clusters in one individual stage is about 6–8. Drilling of each stage requires drilling fluids of 1800–2000 m3 and sand of 100–150 t approximately. The pump rate during stimulation is about 14–18 m3/min. Currently, there are 105 horizontal wells with fracturing treatment completed or in progress. Among them, 56 wells have CD to various degrees. To facilitate analysis, diagnosis has been performed for 2,488 stages in all of the 105 wells within the study area. Diagnosis results show there are 1,100 stages in 56 wells with CD and 1,388 stages in 49 wells with no CD. In other words, CD has a significant impact on operations in gas wells.
Calculation results of net pressures in 2,488 stages show that the average real-time net pressure in the area is about 16.2 MPa with an overall distribution characterized by non-standard normal distribution (Figure 1). Analysis results show that the net operation pressure of 14.04 MPa in the 1,100 stages with casing deformation (CD) is significantly lower than the average net pressure of 17.94 MPa in the 1,388 stages with casing intact (CI). It can be seen that under the same operating conditions, it is more difficult to establish sufficient net pressure in the CD wells through a large pump rate.
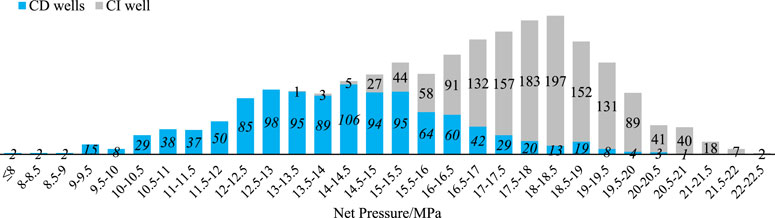
FIGURE 1. Distribution of the number of stages at different real-time net pressures in the whole area.
There are 198 casing deformation points in the CD wells, corresponding to 198 casing deformation stages in fracturing. Correspondingly, the fracturing section that induces the casing deformation, or the section that involves resistance after fracturing, is called the excited (ET) stage. In total, there are 198 ET stages. All stages fractured before this are collectively referred to as the preceding fracturing stages, with a total number of 198. According to the calculation results of Eq. 13 and Eq. (14), when the action range is greater than the increase of the two-dimensional stress caused by induced stress beyond 300 m, is only 0.001 MPa. Therefore, the fracturing stages (about 4 to 6 stages) within 300 m of the preceding fracturing stages are focused on the concerned research. Statistics show that the CD stages have an average net pressure of 13.68 MPa, the ET stages have an average net pressure of 12.28 MPa, and the preceding stages have a net pressure of 15.2 MPa (Figure 2).
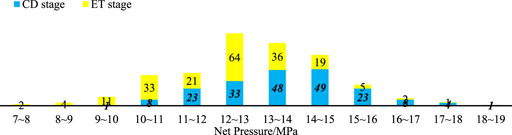
FIGURE 2. Average real-time net pressure distribution of casing deformation (CD) and excited stages (ET).
In this study, the time proportion of two modes in fracturing was reviewed: liquid leak-off and fracture extension blockage,. The statistics of the time proportion of two modes in 2,488 stages show that the average fracturing liquid leak-off time accounts for 24.19% and the average extension blocking time accounts for 10.42%. To be more specific, the average liquid leak-off time accounts for 30.1%, and average extension blocked time accounts for 29.86% in CD stages; the average liquid leak-off time accounts for 40.49%, and average extension blocked time accounts for 20.15% in excited stages; the average liquid leak-off time accounts for 24.21%, and average extension blocked time accounts for 11.44% in preceding fracturing stages (Figure 3, Figure 4).

FIGURE 3. Distribution of fracture stages with different proportions of extension blocked time.
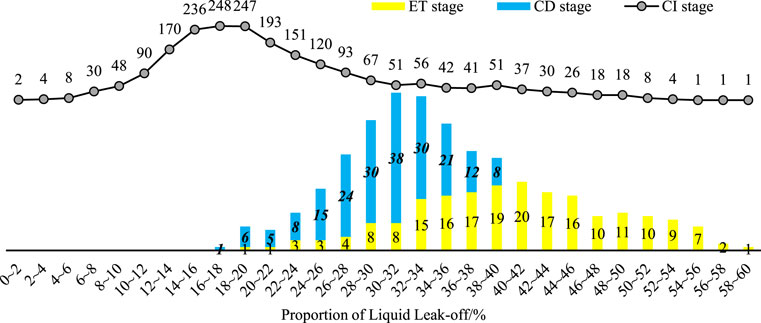
FIGURE 4. Distribution of fracture stages with different proportion of liquid leak-off time.
Comprehensive theoretical research results show there are two internal reasons for the occurrence of casing deformation: one is the communication and activation of weak surfaces such as natural fractures and bedding, and the other is the accumulation of energy to a certain extent. In cases with large volumes of fracturing fluids injected to a certain limit during fracturing, the instability of natural fractures or bedding may eventually induce casing deformation. For consideration of these two internal reasons, the net pressure and extension mode are used to carry out historical backtracking. In addition, the casing deformation inducing opportunity and energy limit in the fracturing process are found in view of the geological characteristics of each fracturing stage.
According to the statistical results of extension modes, the proportion of liquid leak-off and extension blocking time in the excited stage is higher than the overall average value, whereas the liquid leak-off and extension blocking time in the preceding fracturing stage is lower than that in the excited stage but higher than the overall average (Figure 5). Under such circumstances, the first fractured intervals in the preceding fracturing stages have a proportion of the diagnosed liquid leak-off and extension blocking time slightly lower or consistent with the overall average. By analyzing the two extension modes, it can be concluded that the excited stages have the highest proportions of liquid leak-off times, followed by the preceding fracturing stages. In addition, intervals closer to the preceding fracturing stages have lower liquid leak-off time proportions. At the same time, proportions of liquid leak-off time in casing deformation stages are slightly higher than the overall average. On the other hand, proportions of extension blocking time in both excited stages and casing deformation stages are higher than the overall average. It is also worth noticing that the proportions of extension blocking time in casing deformation stages are significantly higher than those in the excited stages. The average extension blocking time in preceding fracturing stages is lower than that in the excited stages but slightly higher than the overall average. Intervals in the preceding fracturing stages closer to the excited stages have longer extension blocking times.
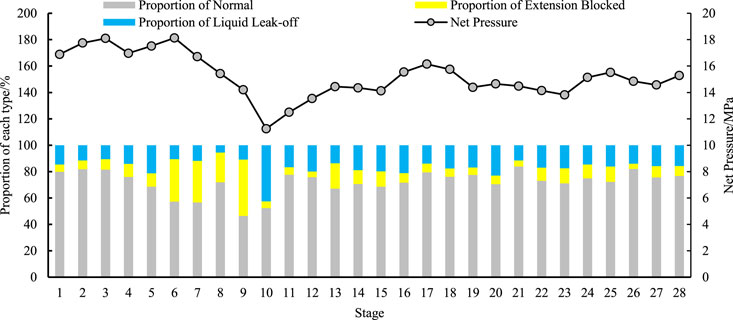
FIGURE 5. Statistics of the ratio of net pressure, leak-off, and extension time in each stage of well H7–4.
Taking well H7-4 as an example, fracturing occurred in the 10th stage and casing deformation occurred in the 13th stage. It can be clearly seen that in the process of fracturing from stage 6–10, the proportion of time blocked and leak-off is particularly prominent, and the net pressure shows a trend of obvious gradual decrease, which has become the typical data change characteristic of casing deformation in the current study area.
The features of excited stages and casing deformation stages are closely related to different geologic and drilling conditions. Because casing deformation is related to weak surface slippage and formation dislocation, data related to the natural fracture development, formation curvatures, and penetration of horizontal well trajectories in different excited stages and casing deformation stages are collected in this study.
Firstly, the influence of natural fracture on casing deformation is analyzed. According to the relationship between CD stage and natural fracture, the majority of natural fractures are distributed at 50–100 m from ET stages and 0–50 m from CD stages. In contrast, the probability of CD caused by natural fracture slippage in the CD stage is higher. On the other hand, it can be seen from the conditions of the pre-preceding fracturing stages of different wells that starting from the first intervals of the preceding fracturing stages, the distances between the preceding fracturing stages and the natural fractures are reducing, which is also one of the reasons why the proportions of liquid leak-off time in the fracturing process gradually increase with the progress of fracturing treatments (Figure 6, Figure 7).
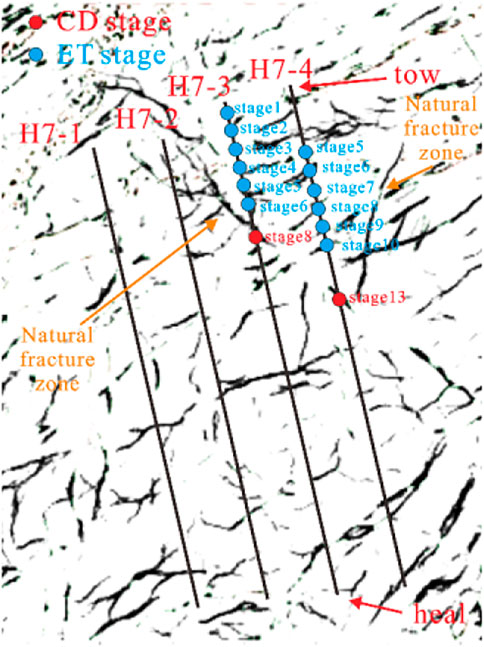
FIGURE 6. Location distribution and natural fracture development characteristics of fore-sequence excited stage groups and casing deformation stages in H7 platform.
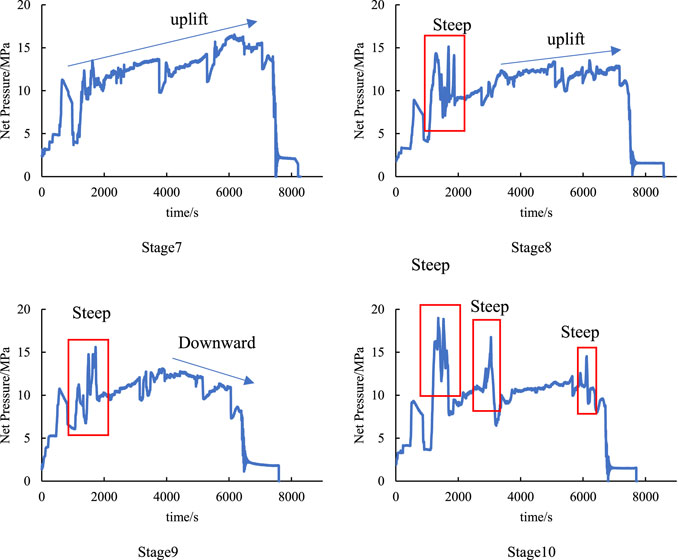
FIGURE 7. Net pressure curves for stages 7 through 10 of well H7–4.
In addition to reductions in distances between the preceding fracturing stages and natural fractures, there are also reductions in included angles between natural fractures and the borehole. This is the key reason for the higher extension blockages of fractures. Set 7th to 10th stages in H7-4 well as an example, natural fractures do not develop in stage 7, and the net pressure curve is characterized by gradual uplift of fracture network propagation. There were low-angle natural fractures near the wellbore in stage 8, and the net pressure curve showed a sudden and steep increase in the initial stage of fracturing, followed by a gradual uplift pattern of fracture network propagation. In the late fracturing operation of stage 9, the net pressure curve shows an obvious continuous downward trend, indicating that the natural fractures far from the wellbore are gradually approaching, and the hydraulic fractures have been able to extend to the intersection to cause liquid leak-off. At stage 10, the net pressure curve shows frequent steep increases due to both a natural fracture at a small angle near the wellbore and another natural fracture approaching the wellbore.
Secondly, the influence of formation curvature is analyzed. Formation curvatures are identified as the curvature volumes of geophysical interpretation. From the curvature prediction results, it can be seen that most positions with casing deformation are in abnormally distorted states. In other words, formations around these positions are characterized by local unevenness. On the other hand, only half of the formations in the excited and preceding fracturing stages are characterized by abnormal curvatures. This is also the main reason why the casing deformation occurs not in the excited stage but at some distance away from the excited stages during fracturing of the excited stages (Figure 8). At the same time, the unevenness of the formation is the external reflection of the change in the magnitude and direction of the formation stress, which becomes the main reason for the differential formation dislocation after the arrival of energy. In general, when the stage with abnormal curvature was not fractured, the fracturing operation curve tends to be stable or uplifted. Once the fracture stage with abnormal curvature is fractured, large through-through connectivity zones will be formed between platforms and wells. In other words, energy generated in fracturing at certain intervals may be transmitted over long distances through curvature belts with CD. As a result, corresponding fractured intervals in different wells along the entire curvature belt may have CD of various degrees.
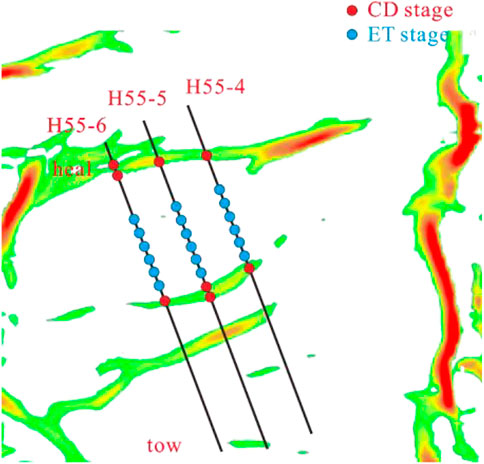
FIGURE 8. Relationship between the position of casing variation and the distribution of the curvature anomaly zone in the H55 platform.
In the case of Platform H55, the platform is fractured with a pull chain. Well four was the first to undergo casing fracture, followed by well 5 and 6. Due to the penetration of the curvature anomaly zone, the time of filtration and blocked extension on the fracturing curve gradually increases and the curve shape becomes more complex (Figure 9), indicating that the penetration of curvature will seriously lead to an increased risk of CD in multiple wells.
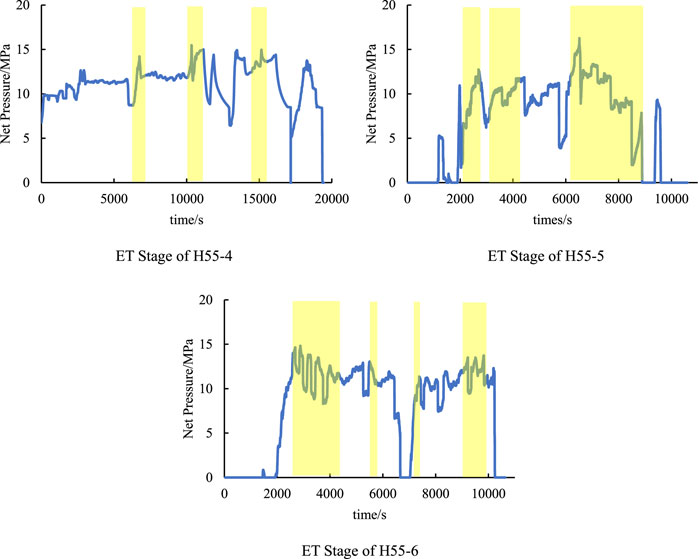
FIGURE 9. Net pressure curve of ET stage in H55 platform.
The combined action of formation penetration and distortion is more likely to lead to CD. Most CD stages have frequent formation penetration. By counting the number of formation penetrations (the number of differential formations penetrated by the horizontal intervals of the deviated wells) before, during, and after the casing deformation stage (within a 100 m range) during fracturing treatments, it was found the average number is 3.8 (Figure 10). In other words, because of the difference in rock mechanics and geomechanics in different horizons, the stresses in the whole casing deformation stage vary greatly. With the study area under strike-slip stresses, the induced stress produced by fracturing may change the original maximum horizontal principal stress > vertical stress >the minimum horizontal principal stress state to a reverse fault state with the maximum horizontal principal stress >the minimum horizontal principal stress > vertical stress. As a result, the interlayer sliding at the location of the casing deformation may promote sliding of natural fractures and, eventually, enhance the risk of CD.
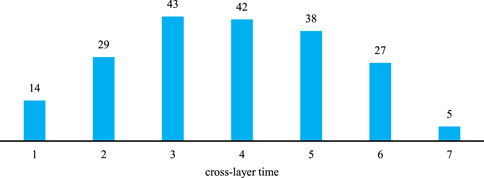
FIGURE 10. Total times of cross-layers in a range of 200 m of 198 CD stages.
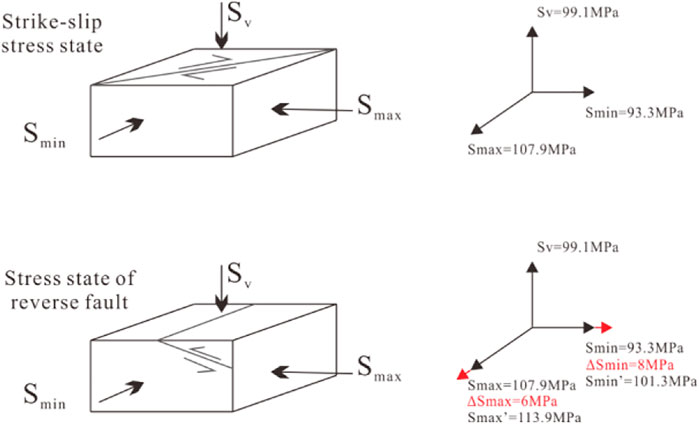
FIGURE 11. Model diagram of the formation stress state change caused by fracturing.
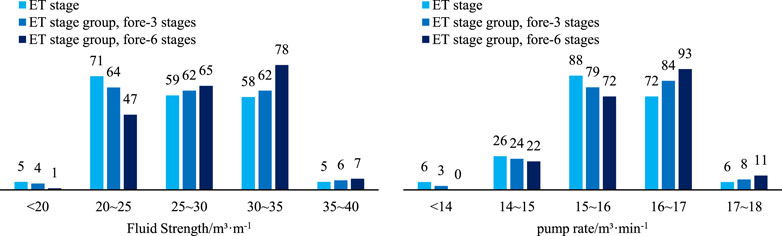
FIGURE 12. Comparison of liquid strength and displacement in ET stages and ET stage groups.
Through comprehensive analysis, it is concluded that the changes in net pressures and extension modes are coupled with each other. Before the CD induced by fracturing in the excited stages, most of the preceding fracturing stages had fracturing treatments with scales larger than necessary. With fluid intensities of over 30 m3/m and a pump rate of over 16 m3/min, external forces are applied to these formations continuously and intensively in subsequent fracturing treatments. At this time, the proceeding fracturing stages have relatively high average real-time net pressures (Figure 9). With down-hole faults and fractures potentially re-activated, these high pressures may involve liquid leak-off or extension blockage, with the net pressures lower than those in conventional fracturing treatments. The proportions of time related to liquid leak-off and extension blockage usually increase with the progress of the fracturing process, indicating that the fracture system near the well-bore may be closer to the well-bore, and it also indicates the increase of casing deformation risk. During the fracturing in the excited stages, due to insufficient attention to the impact of fracturing intensity, the continuous high-intensity operations often fail to achieve the desirable average real-time net pressures while the time of liquid leak-off and extension blockage reaches their peak. Since it is difficult to maintain the formation stability, casing deformation may be induced. In order to minimize the operation risk and avoid the occurrence of secondary CD, fracturing treatments are usually implemented by reducing the operation scales when the treatment measures are carried out after the CD through fracturing. At this time, the real-time net pressures of fracturing treatments are basically normal. However, due to the negative impacts of complicated geologic conditions and poor extension of fractures due to compromised strengths in positions with CD, proportions of time related to extension blockage increased significantly.
We may take the Well H7-3 in Block L as an example: casing deformation was observed in Stage 8 (CD stage) after fracturing of Stage 6 (ET stage) in the Well. From Figure 6, we can see that there is a natural fracture approaching the wellbore from stage 1 to stage 8. From Stage 1 to Stage 6, fracturing treatments were implemented with a stage length of 70 m, 6 clusters in one stage, fluid intensity of 35 m3/min, pump rate of 16–18 m3/min, and sand intensities of 2.5–3.0 t/m (Figure 13). By reviewing the diagnosis for fracturing treatments in Stage 1 to Stage 6, it was found that real-time pressures in Stage 1 and Stage 2 were generally over 17 MPa and up to 20 MPa. At the same time, fracture extension modes are predominantly network extension or extension along bedding, which are favorable for achieving desirable fracturing performances in individual stages. By the end of fracturing in Stage 3, net pressure curves show obvious signs of liquid leak-off with the time proportions increasing gradually in Stage 4. At the same time, the time with significant liquid leakage moved up. Starting from the end of fracturing treatments in Stage 3, natural fractures or faults approached the well-bore rapidly at high angles. Consequently, the time for the intersecting of hydraulic fractures in fracturing of Stage 4 and natural fractures moved up. In Stage 5 and Stage 6, extensions of fractures were blocked at a time earlier than those in the preceding two fracturing stages. At this time, fractures are developed at low angles or parallel to the well-bore. Consequently, it was difficult for hydraulic fractures to crack natural fractures. During fracturing of Stage 5, hydraulic fractures extended along bedding after blockage of a certain time. Multiple extension blockages in fracturing of Stage 6 indicated cluster development of natural fractures in near-well zones, which are not suitable for high-intensity fracturing treatments. Casing deformation was observed after fracturing of Stage 6 due to the following two reasons: high-intensity fracturing treatments and energy transmission in belts with natural fractures due to extremely well-developed natural fractures in the vicinity of the well-bore.
FIGURE 13. Net pressure results of stage 1 through six frac operation curve diagnosis in H7–3 well.
There are multiple geologic factors that may induce casing deformation. During the fracturing, the energy injection may break the formation stress balance and further increase the risk of casing deformation. However, it may not necessarily lead to casing deformation. Statistics related to 198 points with casing deformation show approximately 68% casing deformation points (stages) distributed in zones with extremely well developed natural fractures or with horizontal wells penetrated minor structures frequently. From the analysis of geological mechanisms, the casing deformation points are mostly located in the weak geological zones, that is, the area with natural fracture development, or the area with micro-amplitude structures, pointing to the positions with natural fractures and bedding (bedding fractures) extremely well developed. For boreholes with these geological conditions, the risk of casing deformation can be predicted and evaluated before fracturing. Due to the limited interpretation accuracy of geophysical exploration data, 32% of the casing deformation points may be difficult to predict and describe, so it is necessary to derive real-time data based on the diagnosis of fracturing curves. The advantage of real-time characterization is that it can quickly limit the fracturing scale and intensity through risk identification, so as to reduce the energy injection intensity, slow down the formation activation, and eventually eliminate the possibility of casing deformation.
In this way, the techniques for prevention and control of casing deformation in gas wells are developed based on diagnosis of fracturing curves. Differential fracturing treatments can be implemented when the natural fractures that can be detected or interpreted by geophysical exploration technology or the identifiable frequent penetrations by drilling trajectory tracking can be detected. With approaching of fracturing treatments to zones with complicated geologic conditions, intensities of such fracturing treatments can be reduced. Once the fracturing stages with complex geological conditions are passed, the intensity of fracturing treatments can be restored gradually. During this period, the net pressures and its curve shape diagnosed by fracturing curves shall be monitored in real-time to determine the proportions of leak-off and extension blockage times, so as to highlight the unidentified risks; In areas with no geophysical exploration data interpretation available and where the drilling trajectory is smooth and does not frequently penetrate the formation, if it is recognized that the net pressure diagnosed by the fracturing curve is significantly reduced, accompanied by liquid leak-off and blocked extension, real-time prediction of natural fractures between wells should be carried out. If the leak-off time accounts for a large proportion or is gradually moved up, the development of high-angle fractures with the well-bore is predicted. At the same time, real-time monitoring and prediction will be carried out for adjacent wells on the same drilling pad to avoid inferences among wells on the same pad. In the same way, the large proportion of the extension blocking time indicates that the fracture development angle is gradually lowered or parallel, and the temporary plugging can be used to turn to divert the flow and to minimize the risk. At the same time, the same fracturing process should be carried out for the fracturing stages parallel to the gas well on the same drilling pad to avoid further interference due to their contact with the same natural fractures. As soon as it is found through the fracturing curve diagnosis that the net pressures of two consecutive stages decrease, and the time when the fracture extension is blocked and the liquid leak-off occurs is significantly moved up, it will be regarded as the stage with natural fractures and the fracturing treatment scale will be reduced regardless of whether the geophysical exploration technology has identified the natural fractures.
With the prevention and control modes as a guide, it is possible to develop casing deformation prevention and control technologies for the responses of the construction curves.
Step 1. Quantitatively evaluate whether the well-bore has the risks of casing deformation such as fracture development, frequent formation penetration, and excessive dogleg of well trajectory. To evaluate local points, natural fractures identified by multiple fracture prediction technologies may serve as the marks for development of fractures, whereas frequent penetration of well trajectory over 3 times or doglegs over 0.3°/m may serve as marks for frequent formation penetration or excessive doglegs. Low-intensity fracturing treatments can be implemented in fracturing stages with the development of natural fractures and frequent formation penetration. Medium-intensity fracturing treatments are implemented in fracturing stages with one condition satisfied. High-intensity fracturing treatments can be implemented in fracturing stages with high formation stability. With regard to angles of natural fracture development, if such fractures are tended to communicate with neighboring wells, or intersect perpendicularly with the well-bore, it is also necessary to control the volume of liquid to eliminate the possibility of casing deformation in multiple wells induced by inferences among offset wells. As for natural fractures parallel to the well-bore or intersected with the well-bore at lower angles, care should be taken to eliminate possible casing deformation in that particular well.
Step 2. Optimization of operation sequence and time efficiency of fracturing treatments under induced stresses. With regard to zipper fracturing on the drilling pad, with the present well spacing of 300 m, zipper fracturing treatments shall be converted to zipper fracturing treatments in every two wells to eliminate the possibility of casing deformation induced by excessive concentration of stresses locally; As for the timing of operations in neighboring wells, fracturing can be implemented alternatively in two neighboring wells with differences of 200–300 m (4–5 stages) to minimize the interference; Within the same drilling pad with singular or multiple rigs, multiple fracturing units can be divided in accordance with the distribution of faults within the pad. In addition, fracturing treatments can be implemented in units with lower risks to minimize negative impacts of casing deformation; intensities of fracturing treatments can be enhanced gradually. When approaching the stages with higher risks, intensities of fracturing treatments can be reduced gradually. When moving away from such stages, fracturing intensities can be restored step by step to minimize risks related to slippage of the fault. At the same time, parameters for such fracturing treatments can be adjusted in real-time in accordance with the distribution of microscopic seismic and pressure responses. With the application of high-viscosity pre-flush fluid, multiple temporary plugging and sand plugging in fracture, pumping sequences can be optimized in real-time.Upon application of these prediction and optimization operations, fracturing treatments have been implemented in 20 wells on 5 drilling pads, among which 1 pad experienced no casing deformation, whereas 16 wells on the other four pads have four wells with minor casing deformation. Since the 98 mm bridge plugs can be installed to maintain continuous operations, the well-bore integrity can be maintained effectively. The rate of casing deformation was reduced to 20%, which is significantly lower than the preceding 56%. In addition, degrees of casing deformation were greatly reduced greatly (as for degrees of casing deformation, 32% of wells can have 85–98 mm bridge plugs installed; 41% of wells can have 54–85 mm bridge plugs installed; and 27% of wells can have >54 mm bridge plugs installed). On-site performances can verify the reliability and applicability of these technologies.
In the concerned research, we have developed a set of models based on the fracturing curves for casing deformation prediction, so that we can predict the real-time net pressures in the fracturing process and the time proportion of the expansion mode of risks that may induce CD. It is found that it is difficult to establish sufficient net pressure through a high pump rate in CD wells. The stage induced CD is called the ET stage, and the stage-occurring CD is called the CD stage. Statistics show that the average net pressure of CD stages is 13.68MPa, the average time of leak-off is 30.1%, and the average blocked extension time accounts for 29.86%. The average net pressure in the ET stage was 12.28MPa, the average time of leak-off accounted for 40.49%, and the average blocked time accounted for 20.15%. The CD stage is characterized by low net pressure, strong liquid loss, and obvious blockage.
The geological and engineering factors that induce the CD are analyzed. The geological factors mainly include natural fractures, formation curvature, and horizontal well trajectory. Small angle natural fractures, abnormal curvature bodies that run through multiple wells and platforms, and well trajectories that frequently cross different layers are the most likely to cause CD. The engineering factor is mainly the continuous high-strength liquid pumping in the fracturing process, which changes the in situ stress state, induces the change of strike-slip stress state to a reverse fault stress state, and increases the risk of CD induced by interlayer dislocation.
According to responses from CD, prevention and control technologies have been developed. In real-time record the total time of fracturing curve response to liquid leak-off and extension block, and carry out prevention and control measures for gas wells with these two situations gradually accumulating and gradually advancing. By adopting the prevention and control technologies with quantitative evaluation of well-bore risks, optimized fracturing sequences and proper time efficiency, rates of casing deformation were reduced from previous 56% to the present 20% with 100% guarantee of well-bore integrity. This method has strong applicability in the field and can be deployed more extensively.
The original contributions presented in the study are included in the article/Supplementary Material; further inquiries can be directed to the corresponding author.
SC:Paper writing, data statistics and analysis ZB:Technical guidance WJ:Theoretical research, technical guidance SY:Data collection and analysis GX:Site construction and data acquisition LJ:The data analysis, data statistics and analysis.
SC, ZB, WJ, SY, GX, ZX, and LJ were employed by CNPC Southwest Oil and Gas Field Company.
All claims expressed in this article are solely those of the authors and do not necessarily represent those of their affiliated organizations, or those of the publisher, the editors, and the reviewers. Any product that may be evaluated in this article, or claim that may be made by its manufacturer, is not guaranteed or endorsed by the publisher.
Bao, X., and Eaton, D. W. (2016). Fault Activation by Hydraulic Fracturing in Western Canada. Science 354 (6318), 1406–1409. doi:10.1126/science.aag2583
Bian, X., Jiang, T., Jia, C., Wang, H., Li, S., Su, Y., et al. (2016). A New Post-frac Evaluation Method for Shale Gas Wells Based on Fracturing Curves. Nat. Gas. Ind. B 3 (2), 146–151. doi:10.1016/j.ngib.2016.03.010
Chen, C., Huang, R., Zeng, B., Song, Y., and Zhou, X. (2021). Analysis and Optimization of Construction Parameters for Preventing Casing Deformation in the Changning Shale Gas Block, Sichuan Basin [J]. Pet. Drill. Tech. 49 (1), 93–100.
Chen, C., Lin, S., and Xiang, D. (2016). Casing Deformation Mechanism and Countermeasures in Changning-Weiyuan Shale Gas Demonstration Area[J]. Nat. Gas. Ind. 36 (11), 70–75.
Chen, C., Wang, P., and Xiang, D. (2017). Analysis of Casing Deformation in Changning-Weiyuan Block Based on Focal Mechanism Relationship[J]. Pet. Drill. Technol. 45 (4), 110–114.
Chen, C., Xiang, D., Zhang, F., An, M., Yin, Z., Jiang, Z., et al. (2019). Mechanism and Prevention and Control Strategy of Fault Slip and Casing Deformation Caused by Hydraulic Fracturing in Changning-Weiyuan Block, Sichuan[J]. Petroleum Sci. Bull. 4 (4), 364–377.
Chen, Y., Liu, D., Cai, Y., Yao, J., et al. (2020). Fracturing Curve and its Corresponding Gas Productivity of Coalbed Methane Wells in the Zhengzhuang Block, Southern Qinshui Basin, North China[J]. Energy Explor. Exploitation 38 (5), 1387–1408.
Cheng, S., Wu, J., Fu, Y., and Zeng, B. (2022). Integrated Dynamic Evaluation of Long Lateral Fracturing in Shale Gas Wells: A Case Study on the Changning National Shale Gas Demonstration Area[J]. Nat. Gas. Ind. 42 (2), 123–132.
Daneshy, A. A. “Impact of Off-Balance Fracturing on Borehole Stability and Casing Failure[C],” in SPE Western Regional Meeting.
Fan, Yu, Huang, R., Zeng, B., Chen, C., Zhou, X., Xiang, D., et al. (2020). Fault Slip Induced by Hydraulic Fracturing and Risk Assessment of Casing Deformation in the Sichuan Basin[J]. Petroleum Sci. Bull. 03, 366–375. doi:10.3969/j.issn.2096-1693.2020.03.031
Gao, Li, Li, Z., Li, H., Jiang, Z., and He, L. (2021). Study on the Mechanism of Shale Expansion on Casing Deformation in Weirong Field[J]. Chin. J. Undergr. Space Eng. 17 (6), 2007–2014.
Gao, L., Liu, Z., Qiao, L., Zhuang, Z., and Yang, H. (2017). Mechanism Analysis and Numerical Simulation of Casing Failure in Hydraulic Fracturing of Shale Gas Formation[J]. Pet. Mach. 45 (1), 75–80.
Guo, X., Li, J., Liu, G., Xi, Y., Zeng, Y., He, M., et al. (2019). Numerical Simulation of Casing Deformation during Volume Fracturing of Horizontal Shale Gas Wells. J. Petroleum Sci. Eng. 172, 731–742. doi:10.1016/j.petrol.2018.08.0610.1016/j.petrol.2018.08.067
Guo, X., Li, J., Liu, G., Chen, C., Ren, K., and Lai, D. (2018). Research on Casing Deformation for Shale Gas Wells Based on Focal Mechanism[J]. Fault-Block Oil Gas Field 25 (5), 665–669.
Hu, J., Zhang, S., Zeng, R., and Liu, Z. (2020). Early Warning Method for Sand Plugging Accidents in Shale Gas Fracturing Based on Deep Leaning[J]. China Saf. Sci. J. 30 (9), 108–114.
Hu, Meng, Ge, Hongkui, Fu, Dengwei, and Wang, Xiaoqiong (2020). Numerical Investigation of Casing Shear Deformation Due to Fracture/fault Slip during Hydraulic Fracturing[J]. Energy Sci. Eng. 8 (10), 3588–3601.
Li, J., Zhao, C., Liu, G., Zhang, H., Zhang, X., and Ren, K. (2021). Assessment of Fault Slip in Shale Formation during Hydraulic Fracturing and its Influence Factors[J]. J. China Univ. Petroleum(Edition Nat. Sci. 45 (2), 63–70. doi:10.3969/j.issn.1673-5005.2021.02.007
Li, X., Gu, C., Feng, Y., and Ding, Z. (2021). Numerical Study of Shear Deformation of Casings during Hydraulic Fracturing Considering Wellbore Loading History. Petroleum Sci. Bull. 6 (2), 245–261. doi:10.3969/j.issn.2096-1693.2021.02.019
Lian, W., Li, J., Liu, G., Yan, X., Wu, L., and Chen, L. (2020). Analysis of Casing Stress Difference at Different Positions in Horizontal Segment of Shale Gas Well during Fracturing Process[J]. Drill. Prod. Technol. 43 (2), 11–14+1.
Liu, K., Dahi Taleghani, A., and Gao, D. (2020). Semianalytical Model for Fault Slippage Resulting from Partial Pressurization. SPE J. 25 (03), 1489–1502. doi:10.2118/199348-pa
Liu, K., Dahi Taleghani, A., and Gao, D. (2019). Calculation of Hydraulic Fracture Induced Stress and Corresponding Fault Slippage in Shale Formation[J]. Fuel 254, 115525.1–115525.12. doi:10.1016/j.fuel.2019.05.108
Lu, Q., Liu, Z., Guo, J., He, L., Li, Y., Zeng, Ji, et al. (2021). Hydraulic Fracturing Induced Casing Deformation and a Prediction Model of Casing Deformation[J]. Petroleum Explor. Dev. 48 (2), 394–401. doi:10.1016/s1876-3804(21)60037-x
Mainguy, M. (2016). Monitoring Shear Deformations above Compacting High-Pressure High-Temperature Reservoirs with Calliper Surveys. Int. J. Rock Mech. Min. Sci. 86, 292–302. doi:10.1016/j.ijrmms.2016.05.007
McClure, M. W., and Horne, R. N. (2011). Investigation of Injection-Induced Seismicity Using a Coupled FLuid FLow and Rate/state Friction Model[J]. Geophysics 76 (6), 181–198. doi:10.1190/geo2011-0064.1
Meyer, J. J., Gallop, J., Chen, A., Reynolds, S., Mildren, S., et al. (2018). “Can Seismic Inversion Be Used for Geomechanics? A Casing Deformation Example[C],” in The Unconventional Resources Technology Conference.
Meng, H., Ge, H., Fu, D., and Wang, X. (2020). Numerical Investigation of Casing Shear Deformation Due to Fracture/Fault Slip During Hydraulic Fracturing. Energy Sci. and Engg. 8 (10), 3588–3601.
Nolte, K. G., and Smith, M. B. (1981). Interpretation of Fracturing Pressures. J. Pet. Technol33 33 (9), 1767–1775. doi:10.2118/8297-PA
Peng, Y., Zhao, J., Sepehrnoori, K., Li, Y., and Li, Z. (2020b). The Influences of Stress Level, Temperature, and Water Content on the Fitted Fractional Orders of Geomaterials. Mech. Time-Depend Mater 24 (2), 221–232. doi:10.1007/s11043-019-09417-0
Peng, Y., Zhao, J., Sepehrnoori, K., and Li, Z. (2020a). Fractional Model for Simulating the Viscoelastic Behavior of Artificial Fracture in Shale Gas. Eng. Fract. Mech. 228, 106892. doi:10.1016/j.engfracmech.2020.106892
Pirayesh, E., Soliman, M. Y., Rafiee, M., and Jamali, A. (2015). A New Method to Interpret Fracturing Pressure-Application to Frac Pack. SPE J. 20 (03), 508–517. doi:10.2118/166132-pa
Qiao, Z., and Ye, C. (2021). Cause Analysis of Casing Deformation in Fracturing of Horizontal Wells in Weirong Deep Shale Gas Field[J]. Reserv. Eval. Dev. 11 (2), 89–95. doi:10.13809/j.cnki.cn32-1825/te.2021.02.012
Rutqvist, J., Rinaldi, A. P., Cappa, F., and Moridis, G. J. (2015). Modeling of Fault Activation and Seismicity by Injection Directly into a Fault Zone Associated with Hydraulic Fracturing of Shale-Gas Reservoirs. J. Petroleum Sci. Eng. 127, 377–386. doi:10.1016/j.petrol.2015.01.019
Schultz, R., Atkinson, G., Eaton, D. W., Gu, Y. J., and Kao, H. (2018). Hydraulic Fracturing Volume Is Associated with Induced Earthquake Productivity in the Duvernay Play. Science 359 (6373), 304–308. doi:10.1126/science.aao0159
Shen, C., Wu, J., Fu, Y., and Zeng, B. (2022). Integrated Dynamic Evaluation of Long Lateral Fracturing in Shale Gas Wells: A Case Study on the Changning National Shale Gas Demonstration Area. Natural Gas Industry 42 (2), 123–132.
Sugden, C., Johnson, J., Chambers, M., Gary, R., Suryanarayana, P. V., et al. (2012). Specialconsiderations in the Design Optimization of the Production Casing in High-Rate, Multistage-Fractured Shale Wells[J]. SPE Drill. Complet. 27 (4), 459–472. doi:10.2118/151470-pa
Tong, H., Liu, Z., Zhang, H., Zhang, P., Deng, C., Ren, X., et al. (2021a). Theory and Method of Temporary Macrofracture Plugging to Prevent Casing Deformation in Shale Gas Horizontal Wells[J]. Nat. Gas. Ind. 41 (5), 92–100. doi:10.3787/j.issn.1000-0976.2021.05.010
Tong, H., Zhang, P., Zhang, H., Liu, Z., Ren, X., Xiao, K., et al. (2021b). Geomechanical Mechanisms and Prevention Countermeasures of Casing Deformation in Shale Gas Horizontal Wells[J]. Nat. Gas. Ind. 41 (1), 189–197. doi:10.3787/j.issn.1000-0976.2021.01.017
Xi, Y., Li, G., Zeng, Y., and Li, J. (2019). Overview of Casing Deformation in Multistage Fracturing of Shale Gas Horizontal Wells. Special Oil and Gas Reservoirs 26 (1), 1–6.
Yan, X., Li, J., Liu, G., Zeng, Y., and Li, J. (2019). Overview of Casing Deformation in Multistage Fracturing of Shale Gas Horizontal Wells[J]. Special Oil Gas Reservoirs 26 (1), 1–6.
Yin, F., Deng, Y., He, Y., Gao, D., and Hou, B. (2018a). Mechanical Behavior of Casing Crossing Slip Formation in Waterflooding Oilfields. J. Petroleum Sci. Eng. 167, 796–802. doi:10.1016/j.petrol.2017.12.069
Yin, F., Han, L., Yang, S., Deng, Y., He, Y., and Wu, X. (2018c). Casing Deformation from Fracture Slip in Hydraulic Fracturing. J. Petroleum Sci. Eng. 166, 235–241. doi:10.1016/j.petrol.2018.03.010
Yin, F., Xiao, Y., Han, L., and Wu, X. (2018b). Quantifying the Induced Fracture Slip and Casing Deformation in Hydraulically Fracturing Shale Gas Wells. J. Nat. Gas Sci. Eng. 60, 103–111. doi:10.1016/j.jngse.2018.10.005
Yu, H., Lian, Z., and Lin, T. (2014). Finite Element Analysis of Failure Mechanism of Casing during Shale Gas Fracturing[J]. China Pet. Mach. 42 (8), 84–88+93.
Zhang, F., Jiang, Z., Chen, Z., Yin, Z., and Tang, J. (2020a). Hydraulic Fracturing Induced Fault Slip and Casing Shear in Sichuan Basin: A Multi-Scale Numerical Investigation. J. Petroleum Sci. Eng. 195, 107797. doi:10.1016/j.petrol.2020.107797
Zhang, F., Yin, Z., Chen, Z., Maxwell, S., Zhang, L., and Wu, Y. (2020b). Fault Reactivation and Induced Seismicity during Multistage Hydraulic Fracturing: Microseismic Analysis and Geomechanical Modeling. SPE J. 25 (02), 692–711. doi:10.2118/199883-pa
Zhang, P., He, Y., Liu, Z., Tong, H., Deng, C., Ren, X., et al. (2021). Shear Compression Deformation Test and Deformation Prevention Practice of Casing in Shale Gas Horizontal Wells[J]. Nat. Gas. Ind. 41 (5), 84–91. doi:10.3787/j.issn.1000-0976.2021.05.009
Zhang, W., Fan, H., Zha, Y., Chen, Z., and Lubin, Z. (2015). A Recommended Calculating Method for Casing Bending Force after Large Scale Volume Fracturing[J]. China Pet. Mach. 43 (12), 29–32.
Zhang, X., Li, J., He, L., Qiao, Z., and Zhang, D. (2021b). Optimization of Fracturing Cluster Spacing in Shale Gas Wells Based on Casing Protection[J]. China Pet. Mach. 49 (12), 105–112.
Zhang, X., Li, J., Zhang, H., Sun, X., Deng, T., Yao, Y., et al. (2021a). Analysis on Casing Deformation Failure in Deep Shale Gas Wells in Weirong Shale Gas Play[J]. Drill. Prod. Technol. 44 (1), 23–27.
Zhang, X., Zhang, L., and Hu, J. (2018). Real-time Diagnosis and Alarm of Down-Hole Incidents in the Shale-Gas Well Fracturing Process. Process Saf. Environ. Prot. 116, 243–253. doi:10.1016/j.psep.2018.02.011
Zhao, J., Fu, Y., Wang, Z., Song, Y., Ren, L., Lin, R., et al. (2022). Study on Diagnosis Model of Shale Gas Fracture Network Fracturing Operation Pressure Curves[J]. Nat. Gas. Ind. 42 (2), 11–19.
Keywords: diagnostics of fracturing curve, deep shale gas, casing deformation, net pressure, induced stress, pre-control technology
Citation: Shen C, Zeng B, Wu J, Song Y, Guo X, Zhou X and Li J (2022) Casing Deformation Response and Controlling Technology Based on Diagnostics of Shale Gas Fracturing Curve. Front. Energy Res. 10:958040. doi: 10.3389/fenrg.2022.958040
Received: 31 May 2022; Accepted: 21 June 2022;
Published: 14 July 2022.
Edited by:
Shuai Zhao, Southwest Petroleum University, ChinaReviewed by:
Zhezhi Liu, Chongqing University of Science and Technology, ChinaCopyright © 2022 Shen, Zeng, Wu, Song, Guo, Zhou and Li. This is an open-access article distributed under the terms of the Creative Commons Attribution License (CC BY). The use, distribution or reproduction in other forums is permitted, provided the original author(s) and the copyright owner(s) are credited and that the original publication in this journal is cited, in accordance with accepted academic practice. No use, distribution or reproduction is permitted which does not comply with these terms.
*Correspondence: Cheng Shen, c2hlbmNfdmljdG9yQDE2My5jb20=
Disclaimer: All claims expressed in this article are solely those of the authors and do not necessarily represent those of their affiliated organizations, or those of the publisher, the editors and the reviewers. Any product that may be evaluated in this article or claim that may be made by its manufacturer is not guaranteed or endorsed by the publisher.
Research integrity at Frontiers
Learn more about the work of our research integrity team to safeguard the quality of each article we publish.