- 1Department of Electrical and Electronics Engineering, Anurag University, Ghatkesar, India
- 2Department of Electrical and Electronics Engineering, Malla Reddy Engineering College, Secunderabad, India
- 3Department of Electrical and Electronics Engineering, Vasireddy Venkatadri Institute of Technology, Guntur, India
- 4Department of Electrical and Electronics Engineering, SRM University, Amaravathi, India
- 5Department of Electrical Engineering, Graphic Era University, Dehradun, India
- 6Department of Electrical Engineering, National Institute of Technology, Delhi, India
- 7Wolfson Centre for Magnatics, School of Engineering, Cardif University, Cardiff, United Kingdom
- 8Department of Electrical Engineering, Faculty of Engineering, Aswan University, Aswan, Egypt
This paper presents the integration of renewable energy sources such as photovoltaics, wind, and batteries to the grid. The hybrid shunt active power filter (HSHAPF) is optimized with the Gray wolf optimization (GWO) and fractional order proportional integral controller (FOPI) for harmonic reduction under nonlinear and unbalanced load conditions. With the use of GWO, the parameters of FOPI are tuned, which effectively minimizes the harmonics. The proposed model has effectively compensated the total harmonic distortions when compared with without the filter and with the passive filter, the active power filter with a PI controller, and the GWO-FOPI-based controller. The performance of the proposed controller is tested under nonlinear and unbalanced conditions. The parameters of the FOPI controller are better tuned with the GWO technique. The comparative results reflect the best results of GWO-FOPI-based HSHAPF. The suggested controller is built in the MATLAB/Simulink Platform.
1 Introduction
Power quality (PQ) problems that occur in the distribution system occur when using nonlinear loads. With the development in semiconductor technology, the modeling and usage of power electronic devices are increasing on the end-user side (Mosobi et al., 2015). Because of the usage of power electronic devices, they give rise to many problems like a disturbance in reactive power, a poor power factor, harmonic distortion, and so on (Dash et al., 2018). These problems cause severe effects on the distribution system which result in PQ. To mitigate PQ issues, we have many controlling techniques which ensure harmonic-free systems (Hussain et al., 2019). There are mainly two approaches: load conditioning and power line conditioning (Amir and Srivastava, 2019). Most of the equipment used nowadays is more sensitive to the adverse effects of PQ problems (Goud and Reddy, 2020).
In this approach, at the point of common coupling (PCC), the proposed approach minimizes the effect produced by nonlinear loads. Initially, passive filter usage was widely considered for harmonic elimination and reactive power compensation. Due to various remarkable disadvantages like constant compensation performance, a large size, resonance, and so on, later on, the usage became less. To mitigate the reactive power compensation and harmonics (Jamil et al., 2019), active power filters (APFs) became more prominent as the performance characteristics are very effective when compared with the conventional filters (Meral and Celik, 2018).
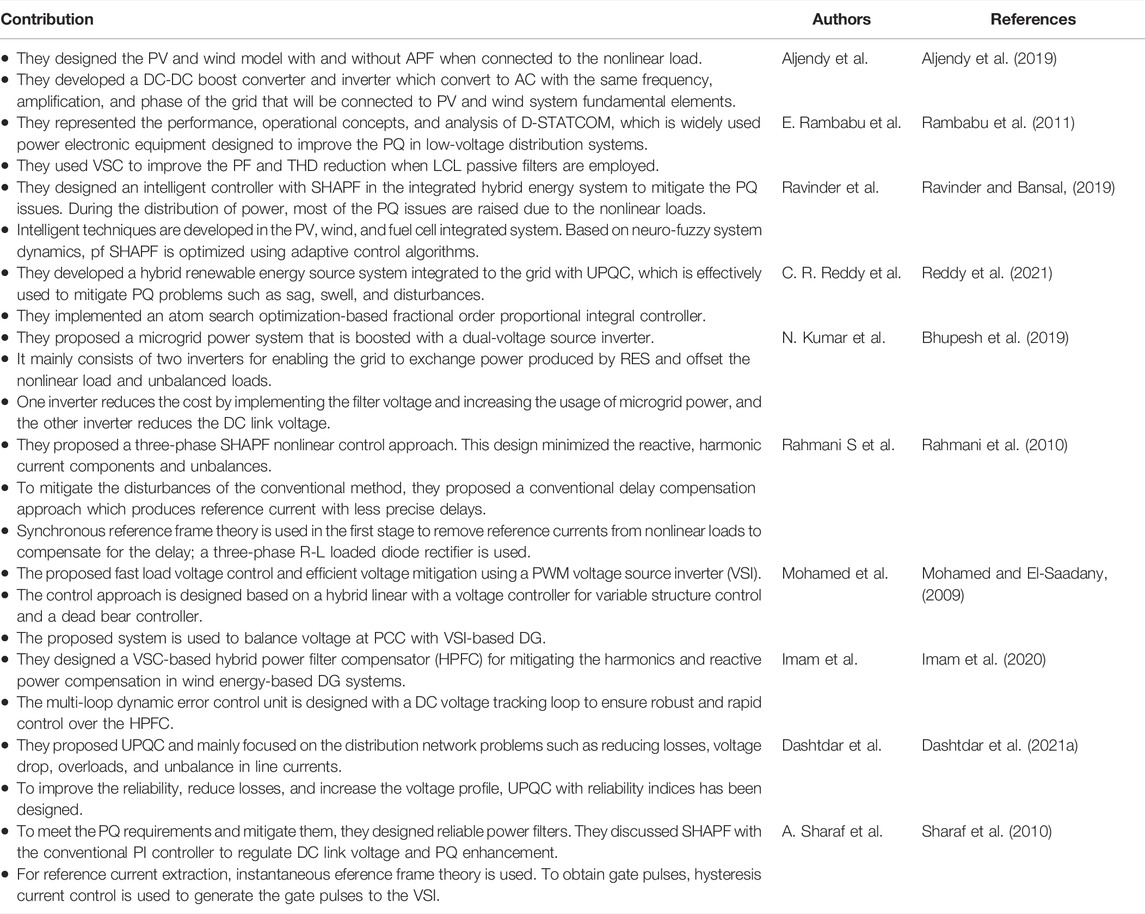
APFs are devices that generally produces an equal quantity of harmonics when compared with the load with a phase shift of 1800. These harmonics are injected into the linear PCC, and load current harmonics are mitigating and supply becomes sinusoidal (Pang et al., 2019). They are broadly classified as series APF and shunt APF. Shunt APF is used to mitigate the load current harmonics by inserting equal and opposite harmonic compensating current. Table 1 presents the brief research works carried out in the literature. This literature mainly focuses on grid integration using RES, APFs, PQ issues, and various types of controllers designed to mitigate in the hybrid integrated system.
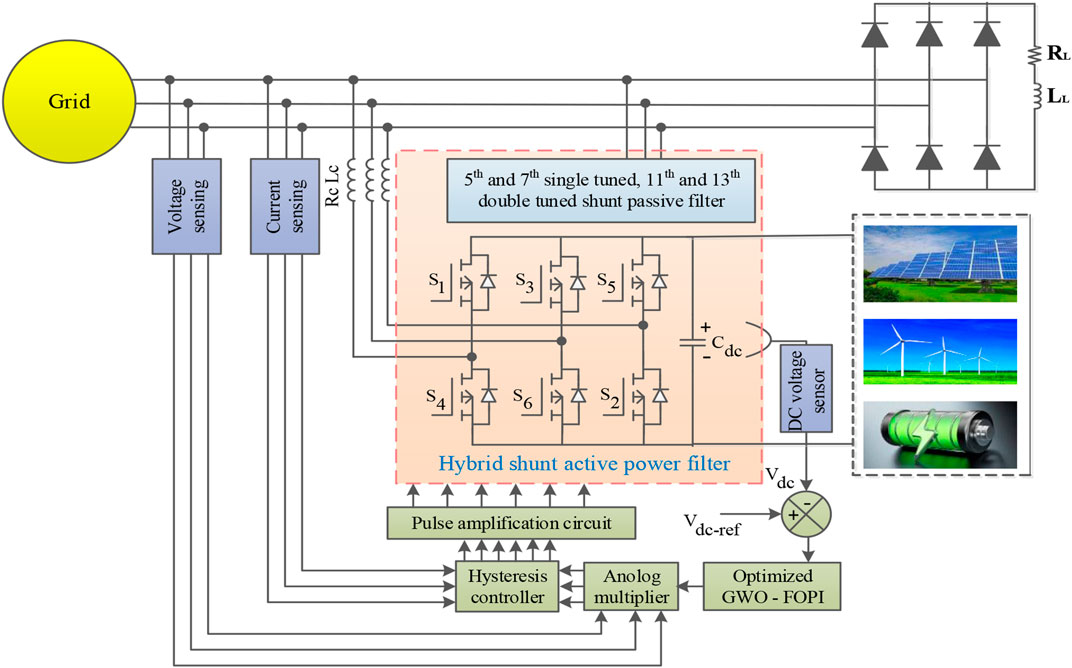
The designed system is a combination of photovoltaics (PVs), wind, and batteries as energy-storing devices (Arkhangelski et al., 2019). The purpose of using a battery is not only to provide backup but also to store the excess amount of generated energy to meet the demand. Figure 1 shows the structure of HSHAPF CC-VSI which is grid interfaced through a DC-link capacitor (Naresh et al., 2018; Muthukumar and Balamurugan, 2019; Goud and Rao, 2020; Kuchibhatla et al., 2020). To increase the voltage if required, a step-up transformer is connected to the AC side of the inverter at the PCC. At the PCC, an uncontrolled bridge rectifier nonlinear load is connected. To minimize the load current harmonics, an inverter control is being utilized and transfers the DG power flow to the PCC.
1.1 Primary Aim and Structure of the Paper
In this paper, total harmonic distortion (THD) reduction under nonlinear load and unbalanced load without the filter, with the passive filter, and with APF using a PI controller and the proposed controller is introduced, which results in the best reduction of harmonics under various load conditions.
The following is the paper’s primary contribution:
• The DG is the combination of PV, wind, and batteries as storing devices. Energy can be stored in the batteries when an excess amount is generated and can be used to compensate for the required load under various conditions.
• The system is an integrated system. The dynamic performance is observed under various load conditions when connected at the PCC. This integration creates the harmonics, which causes the affect the system’s stability
• A metaheuristic algorithm known as the Gray wolf optimization (GWO) technique is introduced, which generates the best optimal pulse for the proposed fractional order proportional integral (FOPI) controller, which effectively functions to mitigate the PQ issues and reduce THD.
The following sections of the papers are categorized as follows: Section 2 describes the proposed system and design, Section 3 proposes the mathematical modeling of the controller, Section 4 describes the proposed HSHAPF, Section 5 illustrates the GWO technique and FOPI controller, Section 6 deals with results and discussion, and Section 7 is the conclusion.
2 Proposed Test System
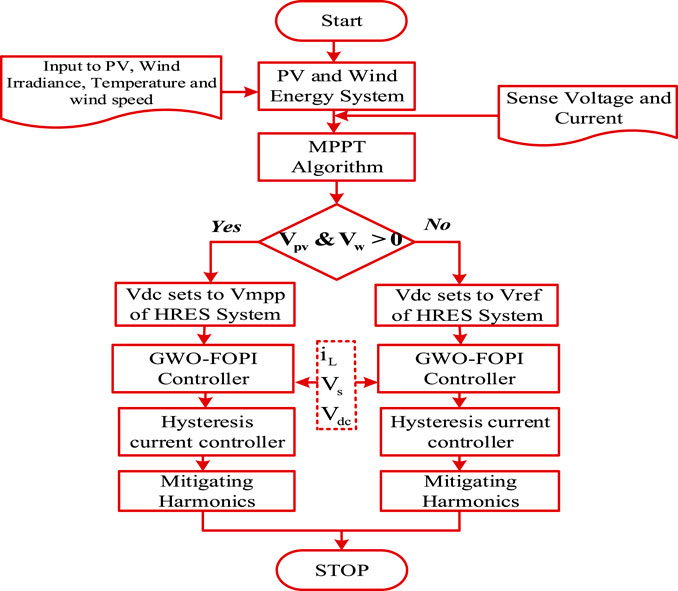
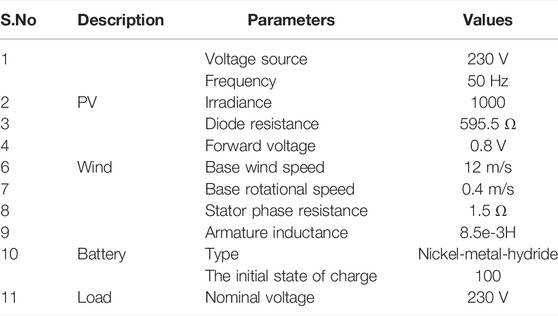
The proposed modeling is designed using both passive and active filters. The designed model improves the compensation characteristics of the filter, which reduces the disadvantages of both active and passive filters. Figure 1 represents the flow chart of the proposed system. Section 2 describes the detailed construction of the system design. In this proposed paper, HSHAPF is implemented with the combination of the LC passive filter and voltage source PWM converter illustrated in Figure 2, which illustrates the renewable energy resources (RES) and HSHAPF connected to the grid. Table 2 illustrates the design parameters. Figure 3 depicts the basic structure of SHAPF. This design is tested at various loads such as nonlinear loads and unbalanced loads. The characteristics of both filters are designed in providing the best performance under various operating conditions. To filter out the harmonics, the designed structure is modeled with storage systems using the battery, DC link, and switches with antiparallel diodes (Goud and Rao, 2021). At PCC, compensating current is injected using a voltage source converter to mitigate the harmonics. To overcome the power rating required for the PWM converter, the system is modeled using both active and passive filters to mitigate the harmonics. Here, power MOSFETs are used in designing the PWM converters, which is cost-effective. To eliminate the harmonic at the PCC, equal and opposite magnitude harmonic current has to be injected, which also improves the PQ in the distribution system.
2.1 Equivalent Circuit of the Photovoltaic
The structure of PV is depicted in Figure 4, whose panel terminal current and voltage are computed based on the below equation (Mosobi et al., 2015; Dash et al., 2018)
where k is Boltzmann’s constant, Q is the electron charge,
where Npv (t) are several cells in the PV array, Ppv (t) is the power of PV,
2.2 Modeling of the Wind Turbine
The wind turbine (WT) generates the output power, which was determined by wind speed as well as the hub’s height. The WT is reliant on wind speed, which is calculated using the below equation (Amir and Srivastava, 2019)
where PR is the electrical power rating,
2.3 Modeling of the Battery as an Energy Storing System
The battery size is computed and developed using the reference autonomy day in the event of a required power requirement (AD) shown in the below equation (Goud and Reddy, 2020)
where ηB is the efficiency of the battery, DOD is the depth of discharge rate of the battery, PL is the demand power, and
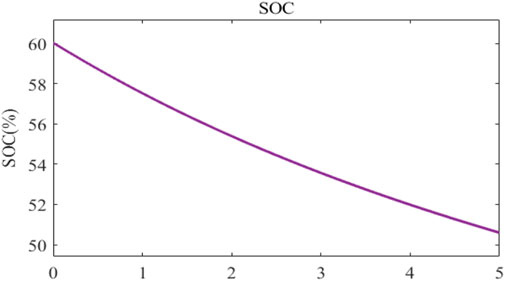
where BP is the battery power. In the battery, PL(t) is the load demand of the system. As stated below, state of charge (SOC) is a critical parameter in HRES that is linked to additional energy creation and energy shortage. Figure 5 depicts SOC
where µ is the battery self-discharge rate.
3 Mathematical Modeling of the Proposed System
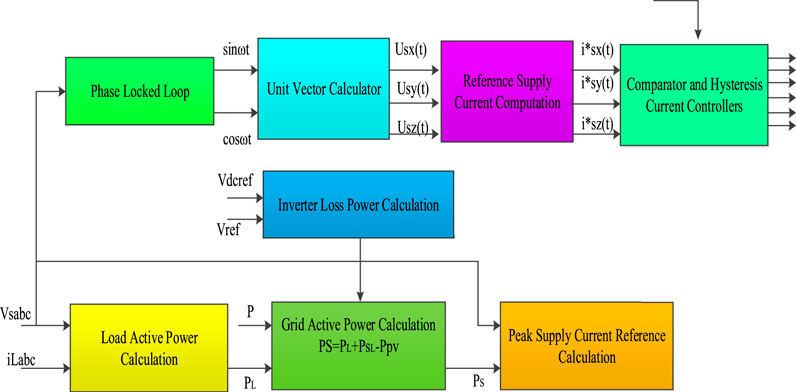
A set of n harmonics with n = {1,2,3,….N} is proposed. At the same position, components are found, and they are current IL (t) and Voltage Vs (t), which can be expressed as the equation that follows (Pang et al., 2019 and Aljendy et al., 2019). Figures 6, 7 depict the mathematical modeling of the controller
(ILn1, ILn2, ILn3) are load current peak values; (Vsn1, Vsn2, Vsn3) are PCC voltage peak values; and
The real power delivered by the grid Ps should be similar to the grid power provided for compensating at a high power factor using the below equation (Aljendy et al., 2019)
where the real loss of power is Pl, the actual power delivered by the RES is P, and the real power of the load is PL; as a result, the maximum value of the basic aspect of typical point voltage is a key component, and Is* is an essential component and is the source current component expressed in the below equation (Ravinder and Bansal, 2019)
where ua (t) = sinωt and ub (t) = cosωt as expressed by the equations (Bhupesh et al., 2019; Reddy et al., 2021) indicate the distance between adjacent reference currents. The current inverter and standard inverter current errors are sent to the HCC (
Determined by the difference between the real and perceived currents of the inverter, the hysteresis regulator regulates and modulates pulse in both gate actuators of a grid-connected adapter. In phase A of the inverter, the S1 switch is on, while
4 Hybrid Shunt Active Power Filter Control Structure
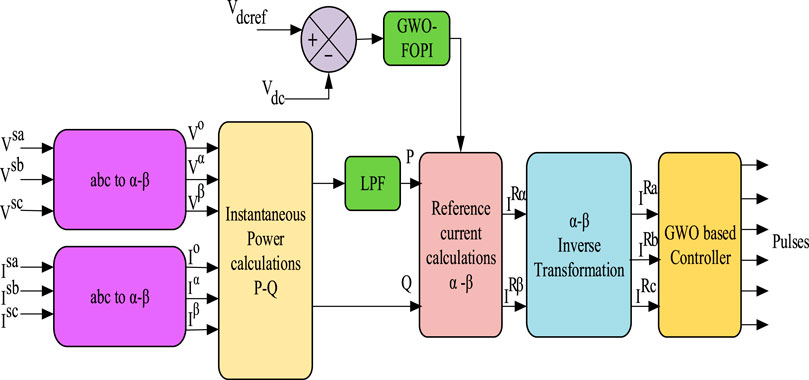
The p-q theory is used, which is mainly based on a-b-c conversion into α-β-0 coordinates and α-β-0 conversation into a-b-c parameters, which are familiarly known as Clark’s transformation and inverse transformation, respectively (Durairasan and Balasubramanian, 2020; Hari Prabhu and Sundararaju, 2020; Sureshkumar and Ponnusamy, 2020). The transformation is shown in Figures 6, 7, from which compensating currents are generated.
In this transformation, three-phase source voltage and load current are converted to stationary reference frame α-β-0 using the below equations (Mohamed and El-Saadany, 2009; Imam et al., 2020)
where Ilα and Ilβ are phase-neutral currents, while ILa, ILb, and ILc are three-phase load currents. Three-phase supply voltages are VSa, VSb, and VSc, whereas the phase-neutral voltages are VSα, VSβ. The instantaneous values of actual and unconsidered powers are determined using phase neutral voltages and load currents (Hari Prabhu and Sundararaju, 2020; Sureshkumar and Ponnusamy, 2020). In the shunt active filter, the actual and reactive power is determined using the below equation (Dashtdar et al., 2021a)
Using the below equation (Sharaf et al., 2010), the reference currents are evaluated
IRa, IRb, and IRc represent the reference currents of an HSHAPF. The reference current is used to calculate the erroneous current, which must be modified using the GWO-optimized PI controller. Based on system error reduction, the SHAPF creates optimal pulses. The GWO is utilized to compute the optimal solution and the best pulses for adjusting the FOPI controller. The next section describes a detailed description of the recommended strategy as well as a flow chart.
5 Gray Wolf Optimization Technique
GWO is new optimization that is supported by the swarm intelligence which is inspired by the psychology of GW to hunt prey illustrated in Figure 8. GWs are always in groups and adjusted in a location during the hunting process. To model the hunting procedure mathematically, the optimal best solution is given to the alpha group act following beta and delta packs (Goud et al., 2020). GWs create a kink around the injured to start hunting the prey, generally written as
‘t’ in Eq. 19 indicates the current iteration. The vectors x and xp indicate the GW and the wound location, respectively, and coefficient vectors X and Y are framed from the below equations (Naresh et al., 2018; Goud and Rao, 2020)
r1 and r2 indicate the random vector, which varies between (0, 1), while the component “a” falls from 2 to 0 throughout the iteration. Using the below equations (Durairasan and Balasubramanian, 2020; Kuchibhatla et al., 2020; Goud and Rao, 2021), the hunting process is calculated
Using the below equation (Durairasan and Balasubramanian, 2020), the α, β, and γ mean value positions are found
The procedure of the suggested approach is as follows:
Step 1: Create the populations.
Step 2: Using Eqs 21, 22, calculate the values of Y, a, and Z.
Step 3: A random location is created from the Search agent.
Step 4: The fitness values of Gray wolves are computed using an objective function.
Step 5: The position of the Gray wolves as well as the parameters A, a, and C, are changed.
Step 6: Using fitness calculations, the optimal option for the next generation is selected.
Step 7: xα, xβ, and xγ are all updated.
Step 8: If the halting condition is not met, the preceding steps are repeated.
Step 9: The controller’s optimal settings are determined.
5.1 Fractional Order Proportional Integral Controller
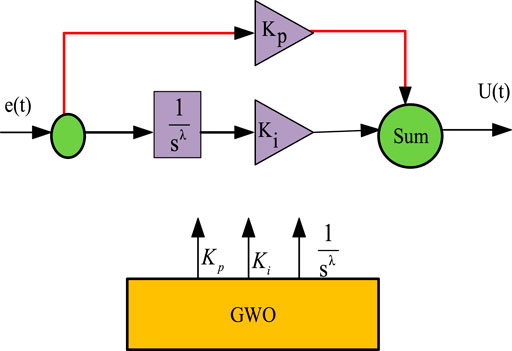
The FOPI controller’s transfer function is represented by the below equation (Goud et al., 2021a; Dashtdar et al., 2021b; Goud et al., 2021b; Goud et al., 2021c). The FOPI controller design is seen in Figure 9
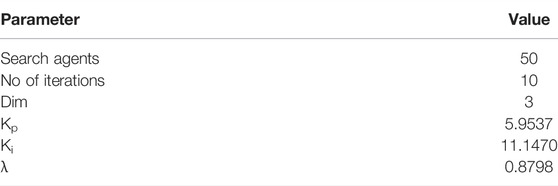
The values of the controller depend on Kp, Ki, and fractional-order λ and are represented in Table 3.
6 Simulation Results
HSHAPF performance is analyzed in MATLAB/Simulink. Two different loads are considered: nonlinear load and unbalanced load. Without the filter, the THD was 27.43%, and after HSHAPF with the GWO-based FOPI controller, the THD is reduced to 1.74%. Similarly, with a passive filter, the THD is 7.67%, and with APF with the PI controller, the THD is 5.85%.
6.1 Case I: Without the Filter for Nonlinear Load
At PCC, nonlinear load is connected, which is generally time-varying and difficult to observe system dynamic performances. At the first diode, the rectifier load is connected to the PCC. During t = 0.01 s to t = 0.2 s, an additional RL segment is added. The figure shows that the inputs to PV and wind are 800–1000 w/m2 and 12–15 m/s, respectively.
In this case, the system dynamic performance of the system without using the filter is analyzed. Figure 10 shows that the harmonics are not eliminated. It represents the source voltage (Vs.), source current (Is), and load current (IL). During time intervals t = 0.01 s to t = 0.04 s, harmonics are observed in both the source current and load current when the design is employed without the filter. Figure 8 represents the THD of about 27.43%. For the sudden change in load at the PCC, it is observed that the system has high dynamic performance.
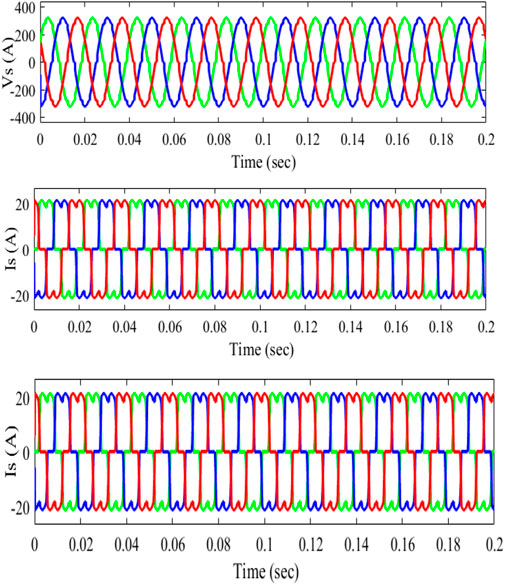
FIGURE 10. Without the filter for nonlinear load source voltage (Vs), source current (Is), and load current (IL).
6.2 Case II: Without the Filter for Unbalanced Load
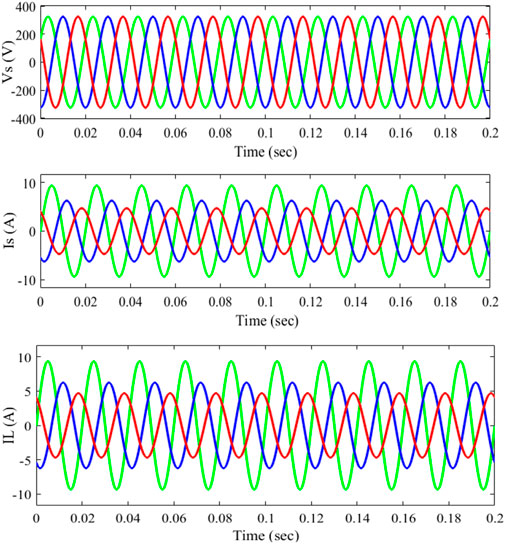
Initially, the load connected at the PCC is the diode rectifier which is then replaced with a single-phase diode rectifier which behaves as an unbalanced load during t = 0.01 s and is removed at t = 0.2 s. From Figure 11, PCC voltage Vs, supply current Is, and unbalanced current IL show the dynamic performances of the system.
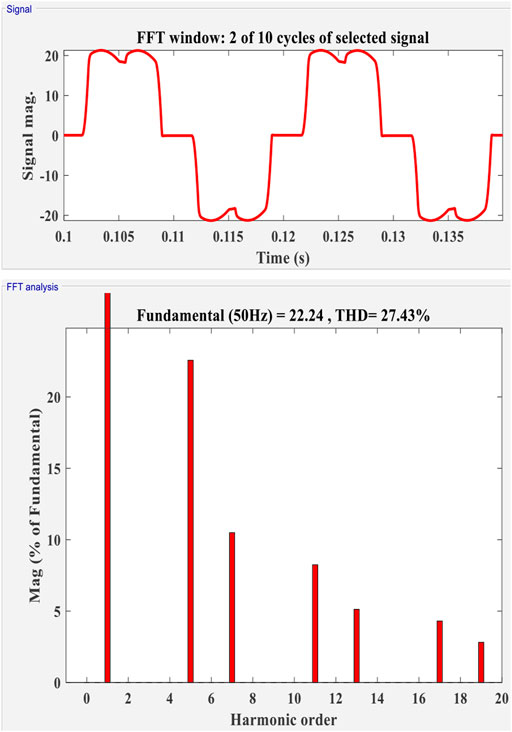
FIGURE 11. Without the filter for unbalanced load source voltage (Vs), source current (Is), and load current (IL).
6.3 Case III: With the Passive Filter for Nonlinear Load
Sudden changes in loads are nonlinear, so it is important to analyze the system’s dynamic characteristics. A diode rectifier load is first connected to the PCC. From t = 0.01 s to t = 0.04 s, an extra load of the RL circuit is added to the previous load. During the nonlinear load, the current decreases from 45A to 5A at time t = 0.01 s and then climbs from 5 to 45A at time t = 0.04 s. The voltage at PCC Vs, supply current Is, variable load current IL, and compensating current Ic between t = 0.01 s and t = 0.04 s are shown in Figure 12. The findings show that nonlinear control has high dynamic performance for fast-changing loads.
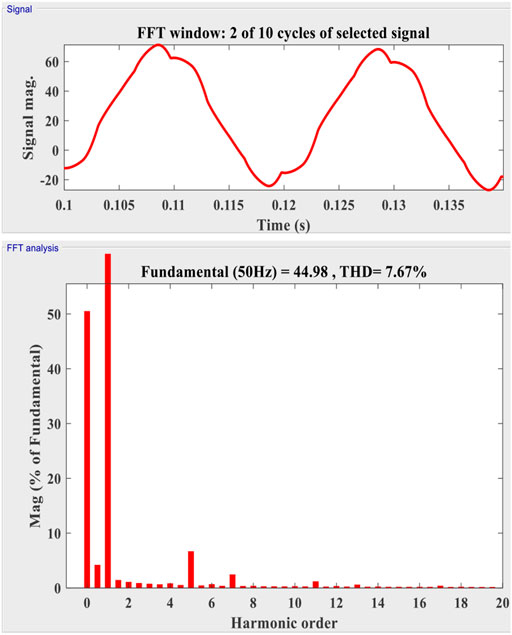
FIGURE 12. With the passive filter for nonlinear load source voltage (Vs), source current (Is), and load current (IL).
6.4 Case IV: With Passive Filter Unbalanced Load
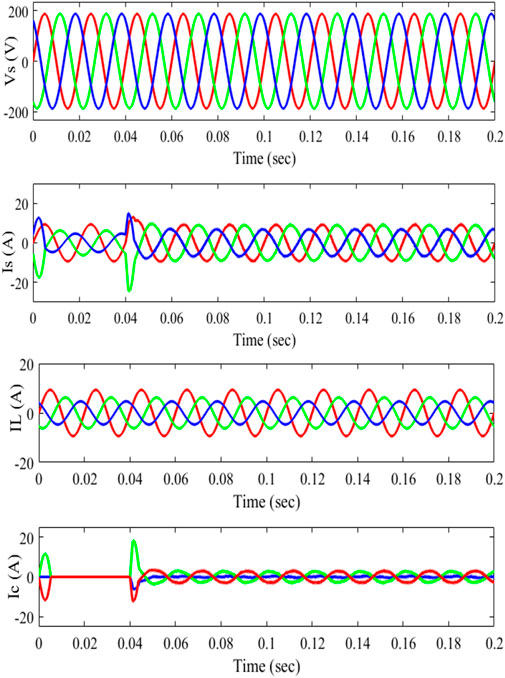
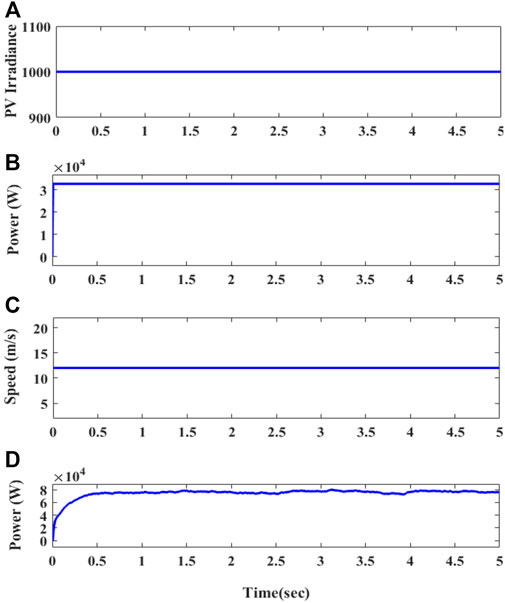
The imbalance, harmonics, and reactive power of an unbalanced nonlinear load must be rectified at PCC. A three-phase diode is used as the load at first. At t = 0.01 s, a one-phase rectifier is connected in series to the PCC and removed at t = 0.04 s. The input values for PV are 1000 w/m2 and a wind speed of 12 m/s, depicted in Figure 13. Between t = 0.01 s and t = 0.04 s, the PCC is connected to a resistor between phases a and b and then withdrawn. In Figure 14, Vs represents the PCC voltage, Is represents the source current, IL represents the current at load, and Ic represents the inverter. Even with erratic supply currents, PCC’s source currents are balanced. As a consequence, the recommended control may be able to balance line currents while simultaneously correcting for reactive and harmonic components of a load. Figure 15 shows that the THD is 7.67%, which is lowered by using a passive filter.
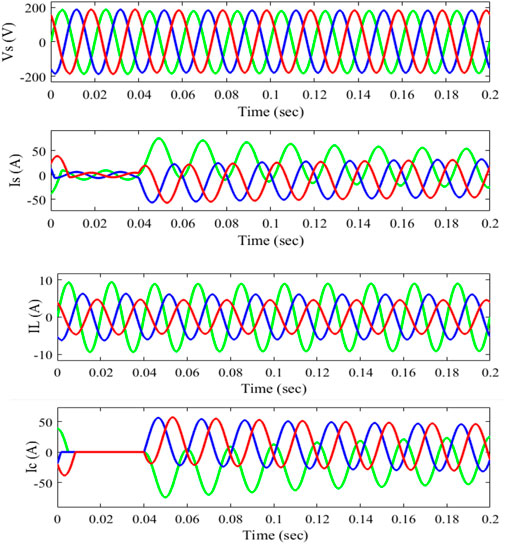
FIGURE 14. With the passive filter for unbalanced load source voltage (Vs), source current (Is), and load current (IL).
6.5 Case V: With the Shunt Active Power Filter for Nonlinear Load
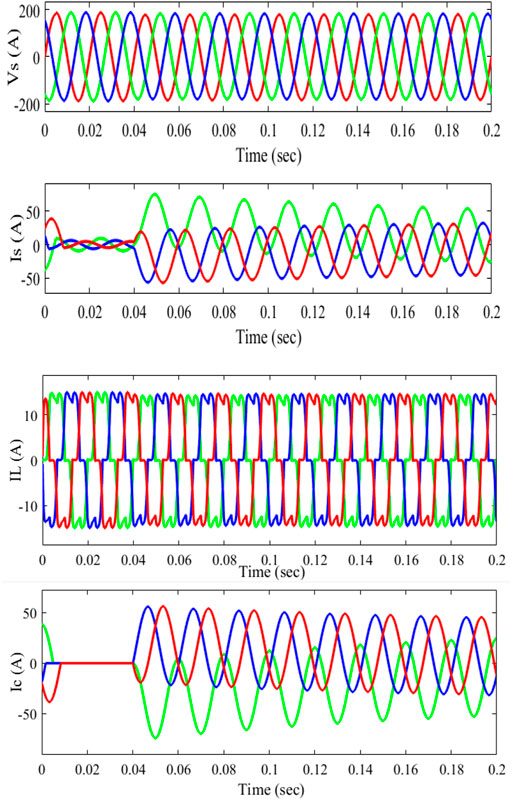
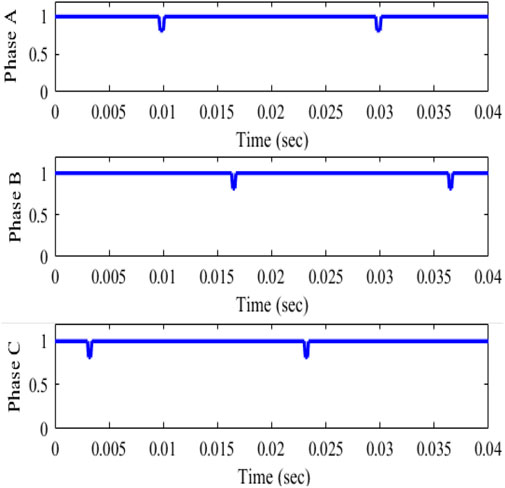
Because rapid change loads are nonlinear, time-varying loads, it is critical to analyze the system’s dynamic characteristics. The PCC is initially linked to a three-phase diode rectifier load. An extra load of the RL circuit is added to the current load from t = 4 s to t = 5 s. At time t = 0.01 s, the nonlinear load current rises from 45A to 5A, and at time t = 0.04 s, it climbs from 5 to 45A. Figure 16 represents the voltage at PCC Vs, the supply current Is, the variable load current IL, and the compensating current Ic between periods t = 0.01 s and t = 0.04 s. The findings show that nonlinear control has high dynamic performance for fast-changing loads. As the PCC load current increases, the THD value rises. The THD is 27.43%, depicted in Figure 17 without the filter, 7.67% depicted in Figure 15 with the passive filter, and 1.74% with the suggested GWO-FOPI controller with SHAPF depicted in Figure 18. The power factors for phases A, B, and C are all 0.99, as shown in Figure 19.
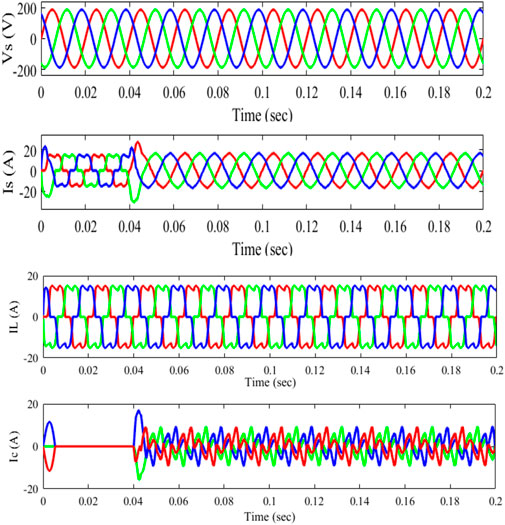
FIGURE 16. With SHAPF for nonlinear load source voltage (Vs), source current (Is), load current (IL), and compensating current (Ic).
6.6 Case VI: With Hybrid Shunt Active Power Filter Unbalanced Load
The variations, reactive power, and harmonics of an unbalanced load must be rectified at PCC. In the beginning, a single-phase diode is used as the load. A single-phase rectifier is connected in series to the PCC at = 0.01 s. Between t = 0.01 s and t = 0.04 s, the PCC is connected to a resistor between phases a and b and then withdrawn. Figure 20 represents the voltage at PCC Vs, the supply current Is, the variable load current IL, and the inverter current Ic. The supply current is balanced at PCC even during irregularities. As a consequence, the recommended control may be able to balance line currents while simultaneously correcting for reactive and harmonic load current components. Table 4 compares THDs without a filter to THDs with a filter.
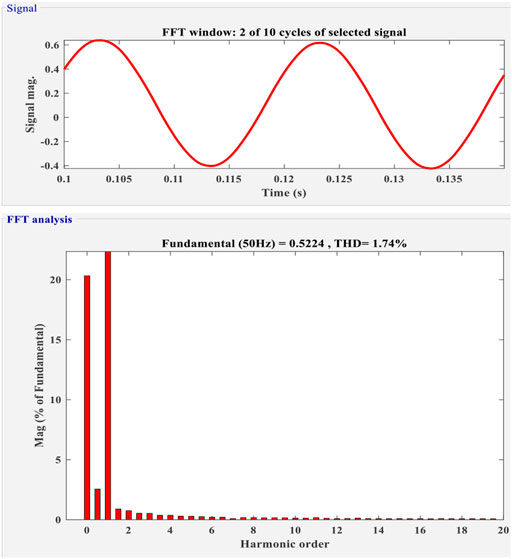
FIGURE 20. With SHAPF for unbalanced linear load source voltage (Vs), source current (Is), load current (IL), and compensating current (Ic).
Finally, under the IEEE 519 standards, the suggested GWO-based FOPI controller with decreased THD is proposed. With the suggested controller, the THD is decreased by 1.74%.
7 Conclusion
PQ in a grid-connected hybrid system with the battery as an energy storing device is proposed with the GWO-based FOPI controller with SHAPF circuit to mitigate the issues. The optimal pulses required for the FOPI controller are attained with the GWO technique. This system has been considered in three different practices: without a filter, the THD is 27.43%; with a passive filter, the THD is 7.67%; the APF with the PI controller is 5.85%, and with the proposed GWO-FOPI controller, it resulted in 1.74% total harmonic reduction. The recommended method’s simulation results are then validated in the MATLAB/Simulink software. The final results of the hybrid system proved the GWO controller’s practicality and effectiveness in decreasing PQ concerns including THD.
Data Availability Statement
The original contributions presented in the study are included in the article/supplementary material; further inquiries can be directed to the corresponding author.
Author Contributions
All authors listed have made a substantial, direct, and intellectual contribution to the work and approved it for publication.
Conflict of Interest
The authors declare that the research was conducted in the absence of any commercial or financial relationships that could be construed as a potential conflict of interest.
Publisher’s Note
All claims expressed in this article are solely those of the authors and do not necessarily represent those of their affiliated organizations or those of the publisher, the editors, and the reviewers. Any product that may be evaluated in this article or claim that may be made by its manufacturer is not guaranteed or endorsed by the publisher.
Abbreviations
APF, active power filter; BESS, battery as the energy storing system; CC-VSI, current controlled voltage source inverter; DG, distributing generation; FOPI, fractional order proportional integral; GWO, Gray wolf optimization; HPFC, hybrid power filter compensation; HSHAPF, hybrid shunt active power filter; PCC, point of common coupling; PV, photovoltaic; PWM, pulse width modulation; PQ, power quality; RES, renewable energy sources; THD, total harmonic distortion.
References
Aljendy, R., Nasyrov, R. R., Abdelaziz, A. Y., and Diab, A. A. Z. (2019). Enhancement of Power Quality with Hybrid Distributed Generation and FACTS Device. IETE J. Res., 1–12. doi:10.1080/03772063.2019.1698321
Amir, M., and Srivastava, S. K. (2019). “Analysis of Harmonic Distortion in PV-Wind-Battery Based Hybrid Renewable Energy System for Microgrid Development,” in Applications of Computing, Automation and Wireless Systems in Electrical Engineering (Singapore: Springer), 1223–1231. doi:10.1007/978-981-13-6772-4_107
Arkhangelski, J., Roncero-Sánchez, P., Abdou-Tankari, M., Vázquez, J., and Lefebvre, G. (2019). Control and Restrictions of a Hybrid Renewable Energy System Connected to the Grid: A Battery and Supercapacitor Storage Case. Energies 12, 2776. doi:10.3390/en12142776
Bhupesh, N. K., Kotaiah Chowdary, K., and Subrahmanyam, V. (2019). Renewable Energy Hybrid Power System with Improvement of Power Quality in Grid by Using DVSI. Renew. Energy 6, 1300.
Dash, S. K., Ray, P. K., and Ray, P. K. (2018). Power Quality Improvement Utilizing PV Fed Unified Power Quality Conditioner Based on UV-PI and PR-R Controller. Cpss Tpea 3, 243–253. doi:10.24295/cpsstpea.2018.00024
Dashtdar, M., Bajaj, M., Hosseinimoghadam, S. M. S., Sami, I., Choudhury, S., Rehman, A. U., et al. (2021a). Improving Voltage Profile and Reducing Power Losses Based on Reconfiguration and Optimal Placement of UPQC in the Network by Considering System Reliability Indices. Int. Trans. Electr. Energy Syst. 31 (11), e13120. doi:10.1002/2050-7038.13120
Dashtdar, M., Nazir, M. S., Hosseinimoghadam, S. M. S., and Bajaj, M. (2021b). Improving the Sharing of Active and Reactive Power of the Islanded Microgrid Based on Load Voltage Control. Smart Sci. 10, 1–16. doi:10.1080/23080477.2021.2012010
Durairasan, M., and Balasubramanian, D. (2020). An Efficient Control Strategy for Optimal Power Flow Management from a Renewable Energy Source to a Generalized Three-phase Microgrid System: A Hybrid Squirrel Search Algorithm with Whale Optimization Algorithm Approach. Trans. Inst. Meas. Control 42, 1960–1976. doi:10.1177/0142331220901628
Goud, B. S., and Rao, B. L. (2021). Power Quality Enhancement in Grid-Connected PV/wind/battery Using UPQC: Atom Search Optimization. J. Electr. Eng. Technol. 16, 821–835. doi:10.1007/s42835-020-00644-x
Goud, B. S., and Rao, B. L. (2020). Power Quality Improvement in Hybrid Renewable Energy Source Grid-Connected System with Grey Wolf Optimization. Int. J. Renew. Energy Res. (IJRER) 10, 1264–1276. doi:10.20508/ijrer.v10i3.11318.g8004
Goud, B. S., Rao, B. L., Reddy, B. N., Rajesh, N., Anjan, B., and Reddy, C. R. (2020). “Optimization Techniques in PV-Wind Based Distribution Generation-A Brief Review,” in 2020 IEEE 17th India Council International Conference (INDICON), India, 10-13 Dec. 2020, 1–6.
Goud, B. S., Rao, B. L., and Reddy, C. R. (2021a). An Intelligent Technique for Optimal Power Quality Reinforcement in a Grid‐connected HRES System: EVORFA Technique. Int. J. Numer. Model. Electron. Netw. Devices Fields 34, e2833. doi:10.1002/jnm.2833
Goud, B. S., Reddy, C. R., Bajaj, M., Elattar, E. E., and Kamel, S. (2021b). Power Quality Improvement Using Distributed Power Flow Controller with BWO-Based FOPID Controller. Sustainability 13, 11194. doi:10.3390/su132011194
Goud, B. S., and Reddy, C. R. (2020). Essentials for Grid Integration of Hybrid Renewable Energy Systems: a Brief Review. Int. J. Renew. Energy Res. (IJRER) 10, 813–830. doi:10.20508/ijrer.v10i2.10772.g7950
Goud, B. S., Reddy, C. R., Rakesh, T., Rajesh, N., Reddy, B. N., and Aymen, F. (2021c). Grid Integration of Renewable Energy Sources Using GA Technique for Improving Power Quality. Int. J. Renew. Energy Res. (IJRER) 11 (3), 1390–1402. doi:10.20508/ijrer.v11i3.12292.g8283
Hari Prabhu, M., and Sundararaju, K. (2020). Power Quality Improvement of Solar Power Plants in Grid Connected System Using Novel Resilient Direct Unbalanced Control (RDUC) Technique. Microprocess. Microsystems 75, 103016. doi:10.1016/j.micpro.2020.103016
Hussain, J., Hussain, M., Raza, S., and Siddique, M. (2019). Power Quality Improvement of Grid Connected Wind Energy System Using DSTATCOM-BESS. Int. J. Renew. Energy Res. 9, 1388–1397. doi:10.20508/ijrer.v9i3.9802.g7717
Imam, A. A., Sreerama Kumar, R., and Al-Turki, Y. A. (2020). Modeling and Simulation of a PI Controlled Shunt Active Power Filter for Power Quality Enhancement Based on P-Q Theory. Electronics 9 (4), 637. doi:10.3390/electronics9040637
Jamil, E., Hameed, S., Jamil, B., and Qurratulain, (2019). Power Quality Improvement of Distribution System with Photovoltaic and Permanent Magnet Synchronous Generator Based Renewable Energy Farm Using Static Synchronous Compensator. Sustain. Energy Technol. Assessments 35, 98–116. doi:10.1016/j.seta.2019.06.006
Kuchibhatla, S. M., Padmavathi, D., and Rao, R. S. (2020). An Elephant Herding Optimization Algorithm-Based Static Switched Filter Compensation Scheme for Power Quality Improvement in Smart Grid. J. Circuit Syst. Comp. 29, 2050066. doi:10.1142/s0218126620500668
Meral, M. E., and Celik, D. (2018). DSOGI-PLL Based Power Control Method to Mitigate Control Errors under Disturbances of Grid Connected Hybrid Renewable Power Systems. Adv. Electr. Electron. Eng. 16, 81–91. doi:10.15598/aeee.v16i1.2485
Mohamed, Y. A.-R. I., and El-Saadany, E. F. (2009). A Control Method of Grid-Connected PWM Voltage Source Inverters to Mitigate Fast Voltage Disturbances. IEEE Trans. Power Syst. 24 (1), 489–491. doi:10.1109/tpwrs.2008.2006996
Mosobi, R. W., Chichi, T., and Gao, S. (2015). Power Quality Analysis of Hybrid Renewable Energy System. Cogent Eng. 2, 1005000. doi:10.1080/23311916.2015.1005000
Muthukumar, R., and Balamurugan, P. (2019). A Model Predictive Controller for Improvement in Power Quality from a Hybrid Renewable Energy System. Soft Comput. 23, 2627–2635. doi:10.1007/s00500-018-3626-7
Naresh, M., Soni, U. K., and ripathi, R. K. (2018). Power Flow Control and Power Quality Improvement in DFIG Based Wind Energy Conversion System Using Neuro Fuzzy System. Int. J. Appl. Eng. Res. 13, 5236–5243.
Pang, M., Shi, Y., Wang, W., and Pang, S. (2019). Optimal Sizing and Control of Hybrid Energy Storage System for Wind Power Using Hybrid Parallel PSO-GA Algorithm. Energy Explor. Exploitation 37, 558–578. doi:10.1177/0144598718784036
Rahmani, S., Mendalek, N., and Al-Haddad, K. (2010). Experimental Design of a Nonlinear Control Technique for Three-phase Shunt Active Power Filter. IEEE Trans. Ind. Electron. 57 (10), 3364–3375. doi:10.1109/tie.2009.2038945
Rambabu, E., Praveena, E., and Kishore, P. V. (2011). Mitigation of Harmonics in Distribution System Using D-STATCOM. Int. J. Sci. Eng. Res. IJSER 2, 1–5.
Ravinder, K., and Bansal, H. O. (2019). Investigations on Shunt Active Power Filter in a PV-Wind-FC Based Hybrid Renewable Energy System to Improve Power Quality Using Hardware-In-The-Loop Testing Platform. Electr. Power Syst. Res. 177, 105957. doi:10.1016/j.epsr.2019.105957
Reddy, C. R., Goud, B. S., Aymen, F., Rao, G. S., and Bortoni, E. C. (2021). Power Quality Improvement in HRES Grid Connected System with FOPID Based Atom Search Optimization Technique. Energies 14 (18), 5812. doi:10.3390/en14185812
Sharaf, A. M., Wang, W., and Altas, I. H. (2010). A Novel Hybrid Active Filter Compensator for Stabilization of Wind-Utility Grid Interface Scheme. Euro. Trans. Electr. Power 20 (3), 306–326. doi:10.1002/etep.313
Keywords: hybrid shunt active power filter, Gray wolf optimization, fractional-order PI controller, renewable energy sources, power quality, harmonic compensation
Citation: Goud BS, Rami Reddy C, Naga Sai kalyan C, Udumula RR, Bajaj M, Abdul Samad B, Shouran M and Kamel S (2022) PV/WT Integrated System Using the Gray Wolf Optimization Technique for Power Quality Improvement. Front. Energy Res. 10:957971. doi: 10.3389/fenrg.2022.957971
Received: 07 June 2022; Accepted: 22 June 2022;
Published: 08 August 2022.
Edited by:
Hadi Taghavifar, UiT The Arctic University of Norway, NorwayReviewed by:
Hamid Taghavifar, Urmia University, IranMohd Ashraf Ahmad, Universiti Malaysia Pahang, Malaysia
Copyright © 2022 Goud, Rami Reddy, Naga Sai kalyan, Udumula, Bajaj, Abdul Samad, Shouran and Kamel. This is an open-access article distributed under the terms of the Creative Commons Attribution License (CC BY). The use, distribution or reproduction in other forums is permitted, provided the original author(s) and the copyright owner(s) are credited and that the original publication in this journal is cited, in accordance with accepted academic practice. No use, distribution or reproduction is permitted which does not comply with these terms.
*Correspondence: Bdereddin Abdul Samad, YWJkdWxzYW1hZGJmQGNhcmRpZmYuYWMudWs=
 B. Srikanth Goud
 Ch. Rami Reddy
 Ch. Naga Sai kalyan
 Ramanjaneya Reddy Udumula
 Mohit Bajaj
 Bdereddin Abdul Samad
 Mokhtar Shouran
 Salah Kamel