 Mark Rafferty
 Xueqin Liu
 John Rafferty3
- 1Smarter Grid Solutions, Glasgow, United Kingdom
- 2School of Electronics, Electrical Engineering and Computer Science, Queen’s University Belfast, Belfast, United Kingdom
- 3ESB International, Muscat, Oman
- 4State Key Laboratory of Industrial Control Technology, Institute of Cyber-Systems and Control, Zhejiang University, Hangzhou, China
The increasing penetration of intermittent, non-synchronous generation has led to a reduction in total power system inertia. Low inertia systems are more sensitive to sudden changes and more susceptible to secondary issues that can result in large-scale events. Due to the short time frames involved, automatic methods for power system event detection and diagnosis are required. Wide-area monitoring systems (WAMS) can provide the data required to detect and diagnose events. However, due to the increasing quantity of data, it is almost impossible for power system operators to manually process raw data. The important information is required to be extracted and presented to system operators for real/near-time decision-making and control. This study demonstrates an approach for the wide-area classification of many power system events. A mixture of sequential feature selection and linear discriminant analysis (LAD) is adopted to reduce the dimensionality of PMU data. Successful event classification is obtained by employing quadratic discriminant analysis (QDA) on wide-area synchronized frequency, phase angle, and voltage measurements. The reliability of the proposed method is evaluated using simulated case studies and benchmarked against other classification methods.
1 Introduction
Globally, electrical power systems are significantly changing, primarily driven by the goal of reducing carbon emissions. In order to achieve renewable energy objectives, generation from traditional synchronous power stations is being replaced with low carbon alternatives. Renewable generation is often viewed as a supplement to traditional generation, but as penetration increases, its effects need to be considered with regard to power system operation and protection. The renewable generators being installed are typically small and decentralized (compared to conventional plants). This, coupled with a loss of control of dispatchable power (e.g., wind power is considered highly intermittent and non-dispatchable) and system services, means power system dynamics are changing (Mukherjee et al., 2021).
Distributed generators (DG) can benefit power systems (Morozovska et al., 2021). For example, when generating power close to distributed loads, they can reduce transmission losses and congestion and can defer investment in transmission lines and substations. However, significant generation at the peripheries of a network will lead to reverse power flows, meaning traditional control and protection schemes can be less effective. Another concern with the increasing installation of DGs is the reduction of system inertia. The natural inertia contributed by synchronous generators helps maintain system frequency. Therefore, the reduction of synchronous generation yields a system with increased sensitivity to sudden changes. Coupling this with the requirement to operate power systems close to their limit to meet demand increases its susceptibility to the occurrence of system-wide events. Therefore, schemes to detect, diagnose, and contain events in a timely manner are required to minimize potential damage and downtime.
Many countries have invested in smart grid technologies to combat large-scale events, with an emphasis on installing a network of Phasor Measurement Units (PMUs) arranged to form a wide-area monitoring system (WAMS). This improves legacy SCADA systems by providing sub-second analysis of transient behavior, with sub-second latency and granularity, which opens a new window on power system dynamics. PMUs provide precise, time-synchronized local measurements of system frequency and rate of change of frequency (ROCOF) along with voltage and current phasors for each bus bar and line measured. These data are typically streamed to a central server, where it is combined to give a wide-area perspective of the system. At this level, long-standing power system challenges such as system-wide frequency monitoring can quickly be solved (Liu et al., 2013). Our previous work (Liu et al., 2015; Liu et al., 2016; Rafferty et al., 2016; Rafferty et al., 2017) investigated the application of advanced methods for rapid event detection on PMU data. Presently, these methods are demonstrated on the historical and modeled PMU data, but the intention is to utilize live PMU data in a control room environment.
The volume of PMU data is to increase exponentially as the number of PMUs and their reporting rates increase. Even at present data streaming rates, it is a challenge to extract real-time information. Consequently, tools from the field of “Big Data” (Syed et al., 2021) are necessary to condense large amounts of data into information useful to system operators. This motivates the need to develop intelligent, automated techniques for the wide-area monitoring and control (WAMC) of the system in real time.
Building on our previous work (Liu et al., 2015; Liu et al., 2016; Rafferty et al., 2016; Rafferty et al., 2017; Rafferty and Liu, 2020), this study presents a novel method to address the problem of distinguishing between several power system events utilizing wide-area PMU data. A combination of dimensionality reduction techniques is adopted to combat the high-dimensional PMU data and reduce computation time.
To summarize, high event classification accuracy was achieved through the following: 1) the development of a power system event database, which was built on wide-area PMU measurements of known event types; 2) utilizing the database in conjunction with previously developed event detection tools (Rafferty et al., 2016) to identify new events, data encapsulated for analysis; 3) linear discriminant analysis (LDA) utilized as a feature extraction technique to reduce the dimensionality of the database while maximizing the discriminatory information between the different event types; 4) a sequential forward selection (SFS) technique employed to identify the most important features necessary for the classification algorithms, enabling the classifiers to train faster and making it easier to interpret; 5) quadratic discriminant analysis (QDA) employed in the event classification model due to its ability to efficiently handle the nonlinear boundaries in the reduced event training data set; and 6) the approach benchmarked against alternative classification techniques, namely, decision trees (DT), k-nearest neighbor (K-NN), LDA, and SVM.
2 Literature review
In machine learning, classification is the assignment of data sets to categories, distinguished by some metric within the data set or extrapolated from it. Many methods have been investigated for the identification of power system events, including DT (Bykhovsky and Chow, 2003; Dahal and Brahma, 2012; Pandey et al., 2020), k-NN (Gaouda et al., 2002; Biswal et al., 2016a; Biswal et al., 2016b; Brahma et al., 2017), support vector machines (SVM) (Biswal et al., 2016a; Brahma et al., 2017), neural networks (Gaouda et al., 2002; Biswal et al., 2016b), unsupervised clustering methods (Dahal et al., 2014; Klinginsmith et al., 2016), energy similarity measure approach (Yadav et al., 2019), and Best Worth Method (Vosughi et al., 1996).
Some methods focus exclusively on local measurements of system frequency (Bykhovsky and Chow, 2003), whereas others consider local voltage measurements (Gaouda et al., 2002). Focusing on singular measurements is a method of reducing dimensionality; however, using frequency and voltage measurements can refine results (Dahal and Brahma, 2012; Dahal et al., 2014; Biswal et al., 2016a; Biswal et al., 2016b; Brahma et al., 2017). Often, the use of current or power measurements is avoided as these are either inapplicable to a wide-area study or require very specific connections.
K-NN and SVM methods were compared by Biswal et al. (2016a) and Brahma et al. (2017). This analysis addressed testing accuracy but did not consider training speed and prediction. When considering the suitability of a method for on-line applications, training speed and prediction accuracy are crucial. These studies also employed a strong signal-based approach, which can be problematic during large disturbances. This instability arises due to inaccuracies in PMU measurements during transient conditions, especially those close to the source of the event.
Although the method by Brahma et al. (2017) showed excellent classification accuracy, only two classes were considered; this accuracy dropped with the addition of extra classes. The methods by Biswal et al. (2016a) and Brahma et al. (2017) employed a defined 2 s window, 0.5 before and 1.5 s after event. A predefined event window is not desirable for real-time event detection and classification. Finally, a significant constraint of SVM-based methods is computational inefficiency, leading to long training times (Nalepa and Kawulok, 2018).
Bykhovsky and Chow (2003) used frequency data in a rule-based decision tree to distinguish between different types of events. Firstly, a historical data set was employed to cluster events and determine decision tree rules. Secondly, the decision tree was applied to pseudo-live data to test live event classification performance. The magnitude of frequency change and ROCOF were found to give the best event differentiation. However, this study was limited as only a small selection of disturbances were considered, and events that have a small effect on frequency will go undetected or incorrectly classified. Dahal and Brahma (2012) expanded the decision tree approach to include voltage measurements. It was applied to generation loss, line trip, and line to ground fault events; however, only seven events were tested. Clustering takes a more probabilistic approach than classification. Events can therefore spread across more than one cluster, often occurring during large events with multiple consequences. The clustering methods by Dahal et al. (2014), Klinginsmith et al. (2016), and Gharavi and Hu (2018) observed the generation of unknown clusters. User expertise was required to link a cluster of power system events to the underlying causes and consequences. A further challenge is that dimensionality increases with the number of event clusters. More recently, deep learning-based methods involving long short-term memory neural networks or convolutional neural networks are employed for power system event classification (Ahmed et al., 2021; Li et al., 2021; Ehsani et al., 2022). The deep learning-based neural networks are excellent in dealing with large data sets but suffer from significant computation costs due to the large number of parameters turning at the training stage.
Because there is no theoretical conclusion on which machine learning classifier method is superior, several methods are required to be evaluated to determine which classification algorithm is more appropriate in predicting the event types from the obtained PMU event database. For the construction of an on-line power system event classifier, utilizing a significant number of PMU variables recorded from multiple locations simultaneously, which can be trained (and retrained after successful classification) in a timely manner with a low misclassification rate, dimensionality reduction techniques are required. Techniques for reducing dimensionality have many benefits, such as reducing time and space complexity and allowing more interpretable data by the removal of noise and less important features. An optimal number of variables is required for model construction, and a trade-off between speed and accuracy is required. In contrast to existing literature, the rejection of power system variables is not used as a method to reduce the dimensionality of the problem. Systematic consideration of the frequency, voltage, and phase angle signals and the difference and rate of change to these variables between buses is proposed. The desired computation efficiency is achieved via a combination of LAD and sequential forward selection to extract and select the variables contributing most to classification accuracy. Also, in this investigation, the window length is determined by the event detection algorithm in Rafferty et al. (2016). The detection algorithm captures the event data and separates them from those recorded under normal operating conditions, providing a crucial step for event classification.
3 Methodology
3.1 Dimensionality reduction
Construction of an on-line power system event classifier, utilizing a significant number of PMU variables recorded from multiple locations simultaneously, which can be trained rapidly, requires dimensionality reduction techniques to be implemented. Dimensionality reduction (Van Der Maaten et al., 2009) is the process of using statistical techniques to reduce the number of features (or variables) in a data set by transforming the original data set into a lower subspace.
Typical applications of dimensionality reduction include data compression for storage purposes and as a pre-processing step to machine learning algorithms. An optimal number of dimensions is required for model construction; the inclusion of too many can decrease performance with respect to computation efficiency and prediction accuracy. However, the inclusion of too few can also result in lower accuracy.
3.1.1 Feature extraction
LAD is a feature extraction technique whose objective is to find a linear combination of features that preserves as much of the class discriminatory information as possible. The resultant combinations can be utilized for linear classification (this application is presented in Section B) or dimensionality reduction purposes. LDA is a supervised learning technique that reduces the dimensionality in the data set to C − 1 dimensions, where C = number of classes.
Denote a matrix of PMU data X, where X ∈ I Rn×m, consisting of m measurement variables, with each row representing a sample (n = number of samples), which is attributed to one of C-classes of event type, where C > 2. The objective of LDA is to obtain C − 1 projections of y by means of multiple projection vectors wi, where i = 1 …C − 1:
where wi can be arranged by columns into a projection matrix, W. The distance, d, between the projected class means, is a good starting point to maximize the difference between the centers of both classes. However, this measurement does not consider the variance of the data within each class and can cause overlapping between classes.
Therefore, Fisher’s proposed method (McLachlan, 2004) maximizes the distance, d, between the classes but also minimizes the variance v within them:
when C = 2, where SB and SW represent the between-class scatter matrix and the within-class scatter matrix, respectively. Therefore, a projection that maximizes SB while minimizing SW is sought. When C > 2, the projection is now C − 1 dimensions, and the determinant of the scatter matrices is used to obtain a scalar objective function, transforming Eq. 2 to
with SB and SW given, respectively, as
and
where ni represents the total number of samples in the ith class, C the number of classes, μi the mean of the samples in the ith class, and μ the overall mean of the data.
The optimal projection matrix W* is given as the one whose columns are the eigenvectors that correspond to the largest eigenvalues of the generalized eigenvalue problem:
or
where λi = J (wi) and i = 1 …C − 1. The optimal projection matrix, W*, is given by
3.1.2 Feature selection
There are three different types of feature selection techniques: filter methods (e.g., Euclidian distance, t-test), wrapper methods (e.g., SFS, Genetic algorithms), and Embedded methods (e.g., DT and SVM) (Ladha and Deepa, 2011). Sequential forward selection (Ladha and Deepa, 2011) is employed here as the simplest greedy search algorithm compared to machine learning-based methods. This method starts with zero features selected and tests each one individually against an objective function. This process is repeated using the previously selected feature(s) and the remaining unselected features in the data set until a stopping criterion is reached. For this methodology, the stopping criteria are based on the cross-validation error of the classifier. Therefore, features are selected consecutively until the cross-validation error ceases to decrease or increases again.
Cross-validation is a method used to evaluate the accuracy of classifiers by employing the classifier on the training data to allow the misclassification rate, E, to be determined. k-fold cross-validation (Kohavi, 1995) is implemented to assess the generalization performance of different classifier configurations. The K-fold method works by dividing the training data set into K subsets (folds) and uses all, bar 1, of the folds for training the classifier, with the remaining fold used for testing. This process is repeated until all the folds have been used for testing. The cross-validation error, CVE, is calculated using
where Ek is the misclassification rate for each fold, and K are the total number of folds. This method allows all samples in the data set to be used for both training and validation, with each sample used for validation only once. A common value for the number of folds, K, is 10.
3.2 Classification: discriminant analysis
An on-line, adaptive event classifier consists of three main stages: separation, allocation, and update. In the separation stage, the objective is to find functions that maximize the difference between the event type classes in the labeled training data set, X. The focus of the allocation stage is to assign unclassified samples (from newly detected events) into one of the known classes, C, based on the functions obtained in the separation stage. Finally, the update stage adds the successfully classified event to the training data set, X, and retrains the classifier for when it is required again.
Discriminant analysis (DA) (Fisher, 1936) is a supervised machine learning technique used to find linear combinations of features in a data set that best discriminates between mutually exclusive groups on the basis of predefined features. A common method for generating the discriminant functions is by using linear methods, such as LDA and QDA, presented in Section B.1 and Section B.2, respectively.
3.2.1 Linear discriminant analysis
The objective of LDA for classification is to determine the maximum posterior probability (denoted as
where X is the training data set, which is assumed to follow a multivariate normal distribution (James et al., 2013). The class-conditional density function, fc1 (xi), is given as
where μc1 and Σc1 are the mean vector and covariance matrix for class c1, respectively. An underlying assumption of LDA is that all classes share a common covariance matrix, Σc1 = Σ∀C. Thus, the linear discriminant function for each class C can be expressed as (James et al., 2013)
Sample xi is determined as the class C, which maximizes
3.2.2 Quadratic discriminant analysis
QDA is an extension of LDA and again assumes multivariate data, following a normal distribution. However, unlike LDA, it is assumed that each class, c1, c2, …, cn, has a separate covariance matrix. This yields the quadratic discriminant function for each class C as (James et al., 2013)
with classification determined by maximizing
3.3 Power system event classifier
The process for the proposed wide-area power system event classifier (PSEC) scheme involves three main stages: off-line classifier construction, on-line wide-area event classification, and classifier retraining. A process flowchart of PSEC is depicted in Figure 1. A fourth stage, on-line monitoring (Rafferty et al., 2016; Rafferty et al., 2017), is also included in Figure 1.
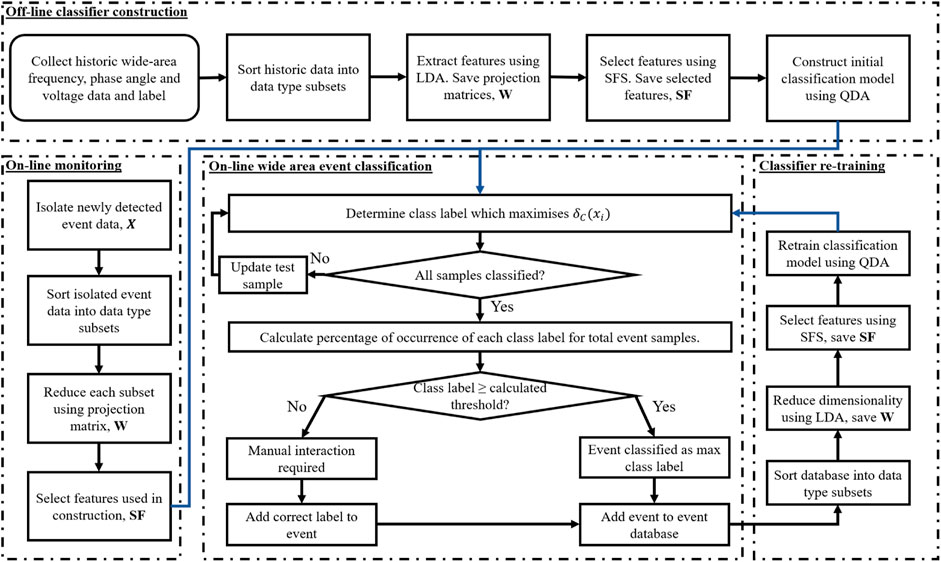
FIGURE 1. Power system event classification (PSEC) process flowchart.
The off-line construction of the initial event classifier requires a sample of historical data of past events, with corresponding event type label recorded from a wide-area network consisting of n PMUs. The labeled, historical event data are used to train the initial PSEC model by determining the boundaries between each event type class. The trained model is applied to newly detected events to allow the event to be classified. Denoting fi, ϕi, and vi as the current sample of frequency, phase angle difference, and voltage recorded from a single PMU, respectively, the change in each variable, Δf, Δϕ, and Δv can be calculated by subtracting the i – th from its corresponding previous sample (fi−1, ϕi−1, and vi−1). The rate of change (ROC) for each variable over time,
In order to compile the training data set, the event database is split into smaller subsets relating to each variable recorded. In the case of this investigation, there are nine subsets, as detailed in the previous paragraph, including all the relevant samples, m, from the n PMUs arranged to form a m × n matrix. LDA is employed on each subset, reducing the dimensionality from n to a C − 1 subspace while maximizing separability between each event type. The calculated projection matrix, W, for each subset is saved to allow newly detected events to be reduced to the same space. The extracted features from the nine subsets are combined before employing the CVE-based SFS technique to select the features which best contribute to the accuracy of the classifier. Finally, to conclude the off-line training process for PSEC, QDA is employed on the reduced event training data set to calculate the class boundaries.
Once trained, PSEC can be used to classify newly detected events on the power system. During the on-line monitoring process, the change and rate-of-change values for each measurement variable are continuously calculated. Once an event has been detected on the system, the data from all connected PMUs are isolated from nonevent data and used to classify the event type occurring. During training, the same subset splitting is adhered to before dimensionality reduction is conducted. In order to extract features that will be in the same subspace as before, each subset is reduced using its corresponding projection matrix, W. The same selected features, SF, are again chosen to classify the end.
Each sample in the event is classified iteratively by maximizing
A confusion matrix is often utilized to evaluate a classification model’s performance, which leads to the calculation of many metrics according to the values in the confusion matrix, such as accuracy, precision, recall, Specificity, and F1 score. A more detailed explanation can be found in Singh et al. (2021). Accuracy as a measure of all the correctly identified events is employed due to its simplicity. In order to reduce the likelihood of misclassification, a threshold is implemented based on the accuracy of the current classifier model, with accuracy determined by
where TP, TN, and Total represent the true positive, true negative, and the total number of samples in the training data, respectively. The initial threshold is calculated during the off-line classifier construction phase and automatically recalculated during each classifier retraining phase. If an event type achieves ≥ the threshold, the event is automatically added to the database. Otherwise, the event cannot be classified, and manual user interaction is required to add the event to the database before retraining occurs.
4 Evaluation with wide-area PMU data
4.1 Data acquisition
In order to demonstrate the capability of PSEC, several dynamically simulated case studies were conducted on the standard IEEE-39 Bus Test System (Athay et al., 1979) using DigSilent PowerFactory. This test system represents part of the US power system and consists of 10 synchronous generators, 19 loads, and 36 transmission lines. In order to simulate capacitor switching and motor start events, each was connected, via a circuit breaker, to each bus in the system. A PMU was placed at each bus in the system not directly connected to a generator, equating to 29 PMUs in total. Each connected PMU has a sampling rate of 100 Hz. For this investigation, it was assumed that all connected PMUs in the system are on-line and do not experience any noise or information loss.
Case studies consisted of 133 generation dip (GD), 114 loss of load (LL), 33 line trip (LT), 78 capacitor switching (CS), and 39 synchronous motor start (MS) events, 397 events in total. Of the simulated events, an 80%–20% split between training (322 events) and test (75 events) events was implemented for each event type. Typical waveforms for each event type under consideration are illustrated in Figure 2. As event locality dictates severity on system measurements, it is important to include data from each PMU for the duration of the event.
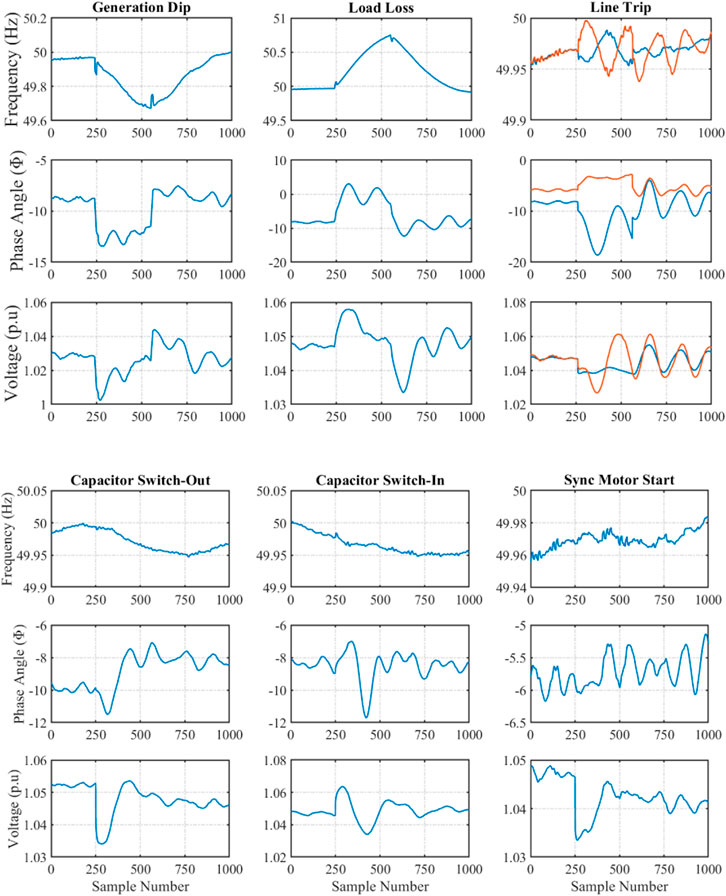
FIGURE 2. PMU recordings for different event types.
4.2 Construction and evaluation of PSEC
In order to construct the initial PSEC model, 80% of the event database consisting of the six aforementioned event types was utilized as input data. The remaining 20% will be used to test the accuracy of the PSEC model for data it does not have experience with. In this study, the event database contains measurements from each installed PMU, which equates to 261 features (29 installed PMUs × 9 measurement variables per PMU). Following the measurement subset creation procedure described in Section C, each subset consists of 29 features. By employing LDA on each individual subset, the dimensionality will be reduced from 29 to 5 features (equating to C-1, where, in this study, C = 6). Therefore, the dimensionality of the event database has been reduced from 261 to 45 features (5 extracted features per subset × 9 subsets).
To further reduce dimensionality, the k-fold cross-validation-based SFS technique was utilized. This technique selected the features that contribute the most information for classification, thus yielding the lowest cross-validation error CVE. The results for the SFS process are illustrated in Figure 3, which highlights that the optimal number of features from the reduced event database to be used for PSEC training is 8, as, beyond this, CVE begins to increase. The combined LDA and SFS process reduces the dimensionality of the original event database from 261 features to a smaller event training data set of eight features. The eight selected features, SF, are presented in Table 1. The subscript number relates to the feature extracted using LDA for that variable. In other words, f3 relates to the third feature extracted from the frequency subset. The features were chosen in the following order: f1, Δϕ1, Δf1, Δf2, f3, Δv5,
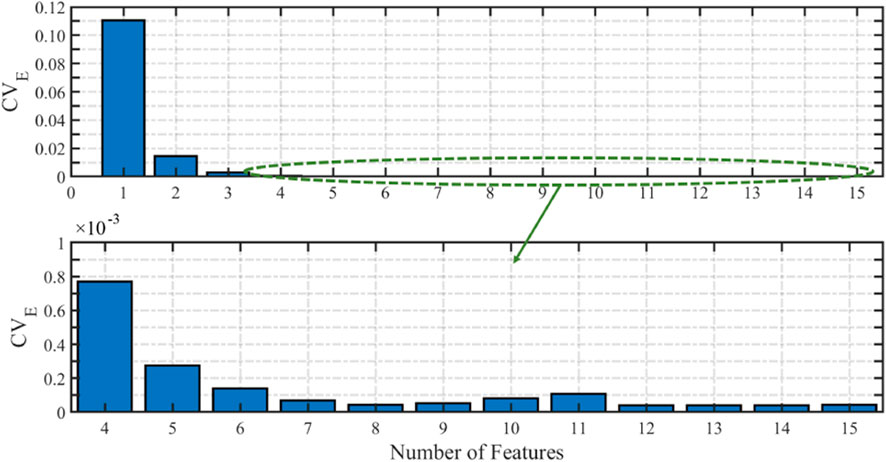
FIGURE 3. Cross-validation error for the number of features included in the classifier.

TABLE 1. Selected Features (SF) using CVE-based SFS method for training data consisting of 80% of the data (322 events).
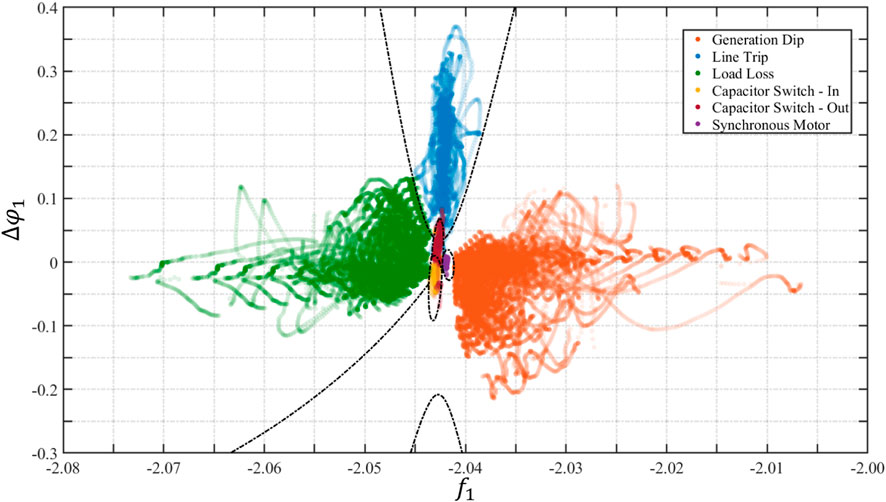
FIGURE 4. Conceptual two-dimensional results for the calculated event type class boundaries for the six event types included in the event database.
Numerical results for PSEC evaluation with regard to the training time and accuracy are highlighted in bold typeface in Table 2. Additionally, several different configurations of the event training data set are presented, including the proposed combination of LDA and SFS (eight features), the raw event database (261 features), and LDA only (45 features). All simulations were carried out in MATLAB 9.3 (R2017b) on a third-generation Intel Core i5 processor with 12 GB RAM.
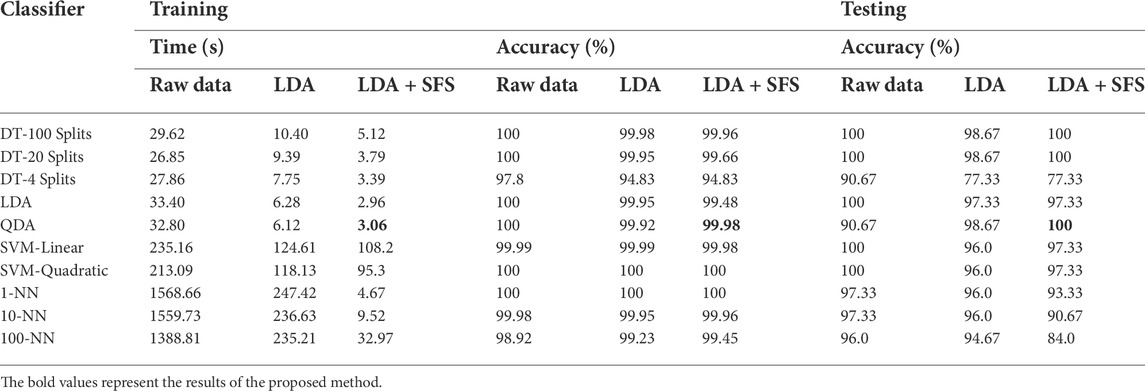
TABLE 2. Comparative study, evaluating the speed and accuracy of multiple classification techniques with different dimensionality reduction techniques using 80% of the data (322 events) for training and 20% of the data (75 events) for testing.
From the results for the QDA-based PSEC presented in Table 2, it can be observed that training time significantly decreases from 32.8 s, using the raw event database, to 6.12 s, when solely LDA is employed. As expected, the fastest configuration occurs when a combination of LDA and SFS is employed on the event database, which yields a time of 3.06 s. Regarding classification, it can be observed that there is a loss of 0.02% in accuracy between using the raw event database and the proposed combination of LDA and SFS, which is minimal. Accuracy in this investigation is determined by the number of correct classifications as a percentage of the total number of classifications utilizing the training event data set.
As there is no theoretical conclusion on which classification algorithm is superior, many algorithms are required to be evaluated using the training data set. Therefore, Table 2 presents a comparative study of numerical results for several classification algorithms. These algorithms include DT, LDA, SVM, and K-NN.
As the proposed method adopts an adaptive training approach, which involves retraining after a successful classification, the training speed is very important. Therefore, as observed from Table 2, when using the raw event database, all of the evaluated algorithms are too computationally expensive but return highly accurate models (>97.8%). The DT and DA approaches are comparable in computation speed and accuracy. The computation cost for SVM and k-NN algorithms is very high, greater than 3.5 min for the SVM approaches and substantially over 20 min for each k-NN approach. This reinforces the requirement of dimensionality reduction techniques as a pre-processing step for on-line PSEC.
When LDA was employed on the event database, it can be observed from Table 2 that the computation time for each classifier reduces significantly. However, in the case of the DA and DT, this reduction in computation cost comes with a reduction in accuracy. This loss is minimal (<0.1%) except for a four-split DT (2.97% decrease). It should be noted that the accuracy of the SVM and k-NN either stay the same or increase slightly, but these still experience high computation costs, ≈ 2 and 4 min, respectively, and therefore could not update PSEC in a desirable time frame.
Finally, when a combination of LDA and SFS was implemented, it can be observed that the discriminant analysis techniques, LDA and QDA, are the fastest for model construction, ≈ 3 s. Although these returned slightly lower accuracy (0.02 and 0.52% for QDA and LDA, respectively) compared to quadratic SVM and 1-NN, the computation time is less. The DT approaches all offer similar computation costs to QDA and LDA. However, their accuracy has reduced. Finally, although QDA is marginally slower than LDA for training (0.1 s), it has benefits over it with regard to its training accuracy (0.5%) and was, therefore, chosen to be implemented in PSEC.
4.3 Classification of new events
After the construction of the initial PSEC model, it can now be used to classify newly detected events in the power system. Once an event has been detected in the system, the event data are isolated at each PMU in the power system. During the training stage, each sample from the newly detected event for each PMU is arranged into measurement variable subsets. Using the projection matrices, W, obtained in the training process, each variable subset is reduced from 29 to 5 features. The features, SF, selected in the training process using the SFS technique are selected again and utilized as inputs to PSEC to predict the class of each individual sample, xi, in the event, with each event sample determined by the event type class which maximizes the function
Full classification results achieved with PSEC for a number of each simulated event type are displayed in Table 3. A further column (I) has been added to the table to indicate the percentage of events tested that returned inconclusive (i.e., the max percentage of samples is
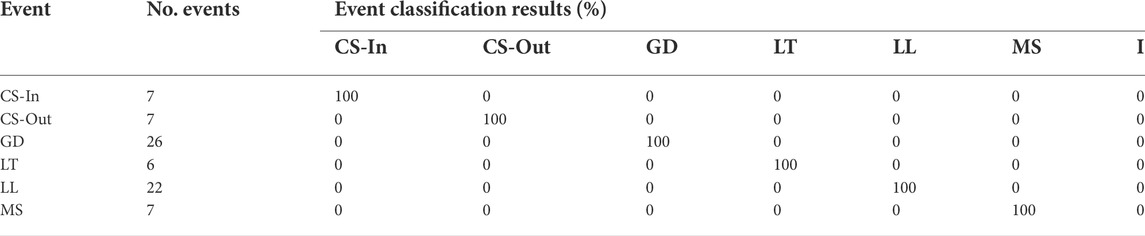
TABLE 3. PSEC results using 80% of the data (322 events) for training and 20% of the data (75 events) for testing.
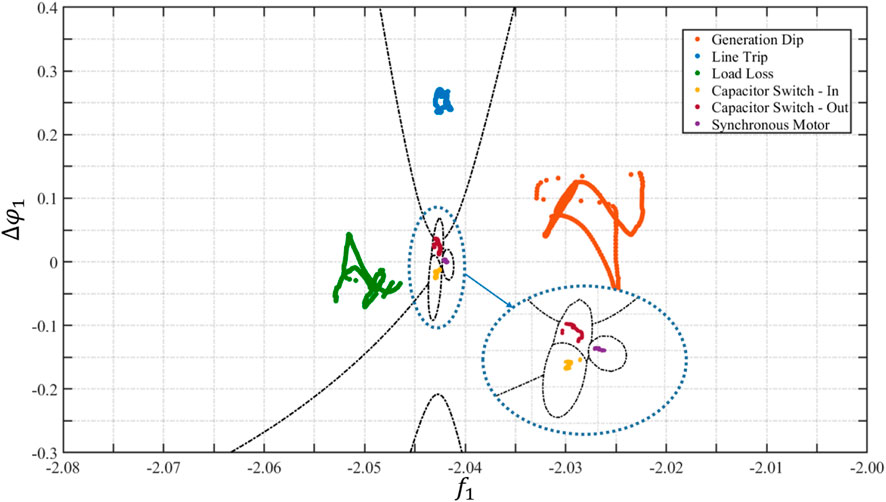
FIGURE 5. PSEC classification results for six simulated case studies.
For completeness, the benchmarking evaluations on the classification algorithm and dimensionality reduction techniques conducted in Section B were also conducted to classify newly detected events. This is provided in the testing column of Table 2. As dimensionality is reduced, the accuracy for newly detected events experiences a decrease except for QDA, which experiences an increase (from 90.67 to 98.67%). This rate is further increased when incorporating SFS with LDA for dimensionality reduction. Classification accuracy increases in an SVM, 100 and 20 split decision tree-based approaches, when incorporating SFS with LDA. LDA and a four-split decision tree classification approach remain the same. Finally, as the dimensionality is reduced, all the k-NN-based approaches decrease in accuracy.
The results in Table 2 show that when using a reduced data set, QDA provides the greatest accuracy for testing (100%) and can be trained in 3.06 s. This is 0.1 s slower than the quickest classifier to be trained, LDA, but returns higher accuracy using the training data set (0.5%) and testing data set (2.67%). Considering computation cost and accuracy, QDA has the potential to be improved and implemented in real time on live PMU data.
5 Discussion
The proposed systematic approach for classifying power system events has several advantages; namely, the implementation of an adaptive method that allows the event database to be updated and self-trained after the successful classification of an event occurs. Also, the introduction of dimensionality reduction techniques has been shown to reduce the computational speed during the training of PSEC with a minimal loss in classifier accuracy, 0.02%. It should be noted that a detailed inspection of individual PMU signals would allow the discrimination between each type of event. However, if there are many PMUs to monitor, this becomes cumbersome. Furthermore, determining an accurate threshold between each of the events to allow automatic classification in real time is not an easy task. The proposed automatic approach for event classification has the potential to be used as input knowledge for an intelligent control system to assist real-time decision-making.
As mentioned previously, all PMUs in the system will experience some disruption to power system measurements during an event, with PMUs located closer to the event experiencing greater change. Therefore, by using a representation of data from the whole system, local inaccuracies are smoothed, making classification independent of PMU locations. Also, the utilization of data from multiple PMUs simultaneously increases the reliability of the method compared to an individual PMU approach. Additionally, as each event sample is determined, PSEC allows automatic classification to begin as received at the PDC, where the data transportation is in the sub-second range. This could be beneficial as an early warning system to predict the type of event occurring in the first number of samples before final determination utilizing full event data.
An investigation into event severity on successful classification is presented in Figure 6, where a large load loss represents a loss of 993.6 MW of load; a small load loss represents a loss of 112.4 MW of load; a large generation dip represents a loss of 628 MW of generation; and a small generation dip represents a loss of 98.7 MW of generation. Figure 6 shows that a small loss leads to the power system measurements varying less and thus being closer to other event-type classes. However, the larger the loss, the easier the classification due to its location in relation to the class boundaries. This makes the classification of smaller events more challenging.
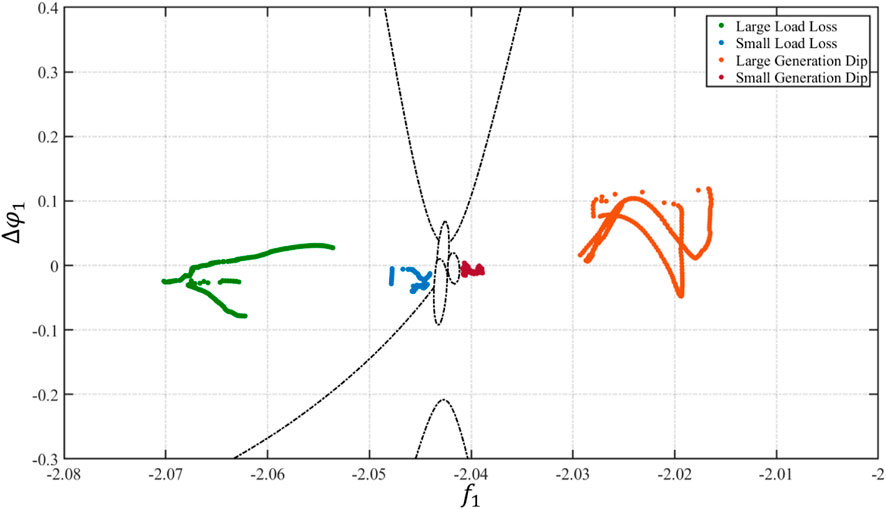
FIGURE 6. PSEC results highlighting the effect of event severity.
6 Conclusions and future work
This study presents a proposed methodology for classifying wide-area power system events for several regularly occurring power system events. The methodology was based on QDA and utilized a statistically obtained subset of wide-area synchronized measurements collected from a network of PMUs located on a power system. The methodology is extensively tested for a large number of simulated case studies. Results are presented and compared with other classifiers, including SVM, k-NN, DT, and LDA.
The proposed method utilizes a systematic consideration of the frequency, voltage, and phase angle signals, as well as the difference and rate of change to these variables between buses, to achieve successful classification. In order to optimize performance, with respect to speed and accuracy, a combination of LDA (to maximize the discriminatory information between event classes) and SFS (to select variables that contribute the most information) techniques are utilized. By considering the results for accuracy and training speed presented in Tables 2,3, the QDA-based PSEC method has the potential to be improved and implemented in real time in future work.
It is worth noting that the sequential forward selection method can identify the most important features and buses (eight features and five buses in this case) that are necessary for the classification algorithms. These simulation results demonstrated that there is no need to have PMU installed in each bus in a practical power system for event classification purposes.
More specifically, future work will look at enhancing some aspects of the classifier. Firstly, the focus should be on improving and expanding the simulated power system event database by including other events, such as transformers energizing, BESS charging/discharging, and the simulation of specific faults in the power system. Secondly, the training time for the construction of the initial PSEC model is presented in Table 2, illustrating a training time of
Data availability statement
All data created during this research is openly available from Zenodo open data repository at DOI: 10.5281/zenodo.6874618.
Author contributions
MR and XL contributed to the conception and design of the study. MR organized the database, performed the statistical analysis, and wrote the first draft of the manuscript. XL and JR wrote sections of the manuscript. XL, DL, SM, and LX contributed to manuscript revision and supervision and read and approved the submitted version.
Funding
This work was supported by EPSRC Supergen Networks Hub (EP/S00078X/2)—SEN Hub Sub-Project Award for a project entitled “Challenges and Opportunities of Machine Learning and BESS for Oscillations Mitigation in Low Inertia Power Networks.” All data created during this research are openly available. The names of the repository and accession number can be found in the article upon publication.
Conflict of interest
The authors declare that the research was conducted in the absence of any commercial or financial relationships that could be construed as a potential conflict of interest.
Publisher’s note
All claims expressed in this article are solely those of the authors and do not necessarily represent those of their affiliated organizations or those of the publisher, the editors, and the reviewers. Any product that may be evaluated in this article, or claim that may be made by its manufacturer, is not guaranteed or endorsed by the publisher.
References
Ahmed, A., Sajan, K. S., Srivastava, A., and Wu, Y. (2021). Anomaly detection, localization and classification using drifting synchrophasor data streams. IEEE Trans. Smart Grid 12 (4), 3570–3580. doi:10.1109/tsg.2021.3054375
Athay, T., Podmore, R., and Virmani, S. (1979). A practical method for the direct analysis of transient stability. IEEE Trans. Power Apparatus Syst. (2), 573–584. doi:10.1109/tpas.1979.319407
Biswal, M., Hao, Y., Chen, P., Brahma, S., Cao, H., and De Leon, P. (2016a). “Signal features for classification of power system disturbances using PMU data,” in Power Systems Computation Conference (PSCC), 2016 (IEEE), 1–7.
Biswal, M., Brahma, S. M., and Cao, H. (2016b). Supervisory protection and automated event diagnosis using PMU data. IEEE Trans. Power Deliv. 31 (4), 1855–1863. doi:10.1109/tpwrd.2016.2520958
Brahma, S., Kavasseri, R., Cao, H., Chaudhuri, N., Alexopoulos, T., and Cui, Y. (2017). Real-time identification of dynamic events in power systems using PMU data, and potential applications—Models, promises, and challenges. IEEE Trans. Power Deliv. 32 (1), 294–301. doi:10.1109/tpwrd.2016.2590961
Bykhovsky, A., and Chow, J. H. (2003). Power system disturbance identification from recorded dynamic data at the northfield substation. Int. J. Electr. Power & Energy Syst. 25 (10), 787–795. doi:10.1016/s0142-0615(03)00045-0
Dahal, O. P., Brahma, S. M., and Cao, H. (2014). Comprehensive clustering of disturbance events recorded by phasor measurement units. IEEE Trans. Power Deliv. 29 (3), 1390–1397. doi:10.1109/tpwrd.2013.2285097
Dahal, O. P., and Brahma, S. M. (2012). “Preliminary work to classify the disturbance events recorded by phasor measurement units,” in Power and Energy Society General Meeting, 2012 IEEE. IEEE, 1–8.
Ehsani, N., Aminifar, F., and Mohsenian-Rad, H. (2022). Convolutional autoencoder anomaly detection and classificationbased on distribution PMU measurements. IET Gener. Transm. Distrib. 16, 2816–2828. doi:10.1049/gtd2.12424
Energy, P. (2013). Rate of change of frequency (ROCOF) - review of TSO and generator submissions final report. Guildford: Commission for Energy Regulation CER.
Fisher, R. A. (1936). The use of multiple measurements in taxonomic problems. Ann. Eugen. 7 (2), 179–188. doi:10.1111/j.1469-1809.1936.tb02137.x
Gaouda, A., Kanoun, S., Salama, M., and Chikhani, A. (2002). Pattern recognition applications for power system disturbance classification. IEEE Trans. Power Deliv. 17 (3), 677–683. doi:10.1109/tpwrd.2002.1022786
Gharavi, H., and Hu, B. (2018). Space-time approach for disturbance detection and classification. IEEE Trans. Smart Grid 9 (5), 5132–5140. doi:10.1109/tsg.2017.2680742
James, G., Witten, D., Hastie, T., and Tibshirani, R. (2013). An introduction to statistical learning, 112. New York, NY: Springer.
Klinginsmith, E., Barella, R., Zhao, X., and Wallace, S. (2016). “Unsupervised clustering on PMU data for event characterization on smart grid,” in Smart Cities and Green ICT Systems (SMARTGREENS), 2016 5th International Conference on. IEEE, 1–8.
Kohavi, R. (1995). “A study of cross-validation and bootstrap for accuracy estimation and model selection” in Proceedings of the 14th International Joint Conference Artificial Intelligence. Montreal, Canada, 1137–1145.
Ladha, L., and Deepa, T. (2011). Feature selection methods and algorithms. Int. J. Comput. Sci. Eng. 3 (5), 1787–1797.
Li, Z., Liu, H., Zhao, J., Bi, T., and Yang, Q. (2021). Fast power system event identification using enhanced lstm network with renewable energy integration. IEEE Trans. Power Syst. 5, 4492–4502. doi:10.1109/tpwrs.2021.3064250
Liu, W., Lin, Z., Wen, F., and Ledwich, G. (2013). A wide area monitoring system based load restoration method. IEEE Trans. Power Syst. 28 (2), 2025–2034. doi:10.1109/tpwrs.2013.2249595
Liu, X., Kennedy, J. M., Laverty, D. M., Morrow, D. J., and McLoone, S. (2016). Wide-area phase-angle measurements for islanding detection—An adaptive nonlinear approach. IEEE Trans. Power Deliv. 31 (4), 1901–1911. doi:10.1109/tpwrd.2016.2518019
Liu, X., Laverty, D., Best, R., Li, K., Morrow, D., and McLoone, S. (2015). Principal component analysis of wide-area phasor measurements for islanding detection-a geometric view. IEEE Trans. Power Deliv. 30 (2), 976–985. doi:10.1109/tpwrd.2014.2348557
McLachlan, G. (2004). Discriminant analysis and statistical pattern recognition, 544. Hoboken: John Wiley & Sons.
Morozovska, A. V. M. K., Heleno, M., and Hilber, P. (2021). Including dynamic line rating into the optimal planning of distributed energy resources. IEEE Trans. Smart Grid 6, 5052–5059. doi:10.1109/tsg.2021.3109130
Mukherjee, S., Chakrabortty, A., and Babaei, S. (2021). Modeling and quantifying the impact of wind penetration on slow coherency of power systems. IEEE Trans. Power Syst. 36 (2), 1002–1012. doi:10.1109/tpwrs.2020.3022832
Nalepa, J., and Kawulok, M. (2018). Selecting training sets for support vector machines: A review. Artif. Intell. Rev. 52 (2), 857–900. doi:10.1007/s10462-017-9611-1
Pandey, S., Srivastava, A. K., and Amidan, B. G. (2020). A real time event detection, classification and localization using synchrophasor data. IEEE Trans. Power Syst. 35 (6), 4421–4431. doi:10.1109/tpwrs.2020.2986019
Rafferty, M., and Liu, X., (2020). “Automatic power system event classification using quadratic discriminant analysis on PMU data,” in General Meeting, 2020 IEEE PES, USA.
Rafferty, M., Liu, X., Laverty, D., and McLoone, S. (2016). Real-time multiple event detection and classification using moving window PCA. IEEE Trans. Smart Grid 7 (5), 2537–2548. doi:10.1109/tsg.2016.2559444
Rafferty, M., Liu, X., Laverty, D., Xie, L., and McLoone, S., “Adaptive islanding detection using wide area phase angle monitoring,” in 7th IEEE International Conference on Innovative Smart Grid Technologies, 2017, pp. pp. 1–6.
Singh, P., Singh, N., Singh, K. K., and Singh, A. (2021). “Chapter 5 - diagnosing of disease using machine learning,” in Machine learning and the internet of medical things in healthcare. Editors Singh K. K., Elhoseny M., Singh A., and Elngar A. A. (Academic Press), 89–111.
Syed, D., Zainab, A., Ghrayeb, A., Refaat, S., Abu-Rub, H., and Bouhali, O. (2021). Smart grid big data analytics: Survey of technologies, techniques, and applications. IEEE Access 9, 59564–59585. doi:10.1109/ACCESS.2020.3041178
Van Der Maaten, L., Postma, E., and Van den Herik, J. (2009). Dimensionality reduction: A comparative review. J. Mach. Learn Res. 10, 66–71.
Vosughi, A., Sadanandan, S. K., and Srivastava, A. K. (1996). Synchrophasor-based event detection, classification, and localization using koopman, transient energy matrix, best worth method, and dynamic graph. IEEE Trans. Power Deliv. 37 (3), 19862022. doi:10.1109/tpwrd.2021.3102148
Yadav, R., Pradhan, A. K., and Kamwa, I. (2019). Real-time multiple event detection and classification in power system using signal energy transformations. IEEE Trans. Ind. Inf. 15 (3), 1521–1531. doi:10.1109/tii.2018.2855428
Keywords: event classification, dimensionality reduction, PMU data, machine learning, power system monitoring
Citation: Rafferty M, Liu X, Rafferty J, Xie L, Laverty D and McLoone S (2022) Sequential feature selection for power system event classification utilizing wide-area PMU data. Front. Energy Res. 10:957955. doi: 10.3389/fenrg.2022.957955
Received: 31 May 2022; Accepted: 20 July 2022;
Published: 31 August 2022.
Edited by:
Xue Lyug, University of Wisconsin-Madison, United StatesReviewed by:
Huayi Wu, Hong Kong Polytechnic University, Hong Kong SAR, ChinaZhengmao Li, Nanyang Technological University, Singapore
Copyright © 2022 Rafferty, Liu, Rafferty, Xie, Laverty and McLoone. This is an open-access article distributed under the terms of the Creative Commons Attribution License (CC BY). The use, distribution or reproduction in other forums is permitted, provided the original author(s) and the copyright owner(s) are credited and that the original publication in this journal is cited, in accordance with accepted academic practice. No use, distribution or reproduction is permitted which does not comply with these terms.
*Correspondence: Xueqin Liu, eC5saXVAcXViLmFjLnVr