 Shuaiwei Shi1,2
 Qingru Sun
- 1School of Economics, Hebei University, Baoding, China
- 2Research Center for Resource Utilization and Environmental Protection, Hebei University, Baoding, China
- 3School of Foreign Studies, Hebei University, Baoding, China
Cobalt is a key resource for the global energy transition, and the differences in the natural endowment of cobalt have led to frequent cobalt trade among countries. This study aims to reveal the dependence patterns of cobalt trade among countries and the impact of country risks (including political and economic risks) on the patterns. First, a cobalt import dependence network (CIDN) and a cobalt export dependence network (CEDN) are established using the network analysis method. Furthermore, this study uses network indicators to reveal the dependence patterns of cobalt trade among countries, and construct diversification indices of trade relations to further analyze the import source risk and the market concentration of cobalt trade. The results indicate that most cobalt importers have a high import source risk, and most cobalt exporters have a high market concentration. Finally, based on the panel regression methods, we reveal an interesting result showing that the dependence patterns of cobalt trade are significantly influenced by country risks. Specifically, on the one hand, for importers, an increase in political risk or economic risk has a negative impact on their dependence patterns of cobalt trade. On the other hand, for exporters, an increase in political risk or economic risk has different effects on their dependence patterns of cobalt trade. This study suggests that countries should pay more attention to the role of country risks in driving the dependence patterns when making cobalt trade policies.
1 Introduction
Against the backdrop of decarbonization of the global economy, cobalt is a crucial resource in the transition from fossil fuels to clean energy. Therefore, cobalt is listed as strategic metal by many countries. As an important primary raw material in industrial production, cobalt is mainly used in many industrial production fields, such as battery electrodes, metallurgy, catalysts and so on (Rachidi et al., 2021; van der Meide et al., 2022). Global growth in demand for electric vehicles is significantly driving cobalt demand, which is likely to increase 37-fold in 2030, judging by the criterion of cobalt demand in 2015 (Jones et al., 2020). The highly concentrated distribution of cobalt resources and the differences in cobalt consumption capacity among countries lead many countries to participate in the global cobalt trade market. The cobalt trade relations among countries form a complex system based on trade dependence between countries. For example, most of the cobalt mines in the world are mined in the Democratic Republic of the Congo (COD), but refined in China (US Geological Survey, 2022). In 2019, China imported 90,600 tons of cobalt ore and concentrate, of which 95.02% came from the COD. In the same year, the COD exported 96,200 tons of cobalt ore and concentrate, 89.49% of which flowed to China. This shows that the import dependence and export dependence of cobalt between the two countries are extremely high. However, the cobalt trade is easily affected by country risks (Sun X. et al., 2019; Liu S. et al., 2020). The unstable national environment could impact cobalt mining and consumption, cobalt transport process, cobalt prices, as well as other related factors, further influencing the economic development of both importers and exporters. Therefore, it is of great significance to explore the dependence patterns of international cobalt trade and the influence of country risks, which could provide references for countries to implement appropriate cobalt trade policies and ensure the aim of energy transformation.
Nowadays, the globalization of the economy and the complexity of international trade relations have become ever more diversified, and numerous scholars have employed network analysis methods to investigate international energy trade (Ji et al., 2014; Xi et al., 2019; Liu L. et al., 2020), agricultural trade (Shutters and Muneepeerakul, 2012; Leem and Won, 2020; Sun et al., 2022b) and mineral resources trade (Liang et al., 2020; Tian et al., 2021; Shi et al., 2022). For the global trade system, the network analysis method can analyze the complicated trade relations among countries and the structural features of the trade network, which help us better perceive the trading system’s function (Sun Q. et al., 2019; Sun et al., 2020). The existing studies on cobalt trade mainly focused on the international cobalt trade patterns and the stability of cobalt trade (Chen et al., 2019; Becker, 2021; Shao et al., 2022; Shi et al., 2022). For example, Liu S. et al. (2020) first constructed a cobalt trade network, and in this network, the nodes represented countries, the edges reflected the direction of trade flow and the weight of the edges showed the trade volumes, and then predicted the potential cobalt trade relations. In addition, some studies created cobalt trade networks based on trade dependence. Specifically, combined with trade dependence theory and complex network theory, Zhao et al. (2020) constructed a cobalt trade dependence network to explore the structural characteristics of the dependence network and elaborated the impacts of each country’s structural role on cobalt trade prices. Liu H. et al. (2021) explored the overall patterns of global cobalt trade and countries with high trade dependence and identified high-risk countries or regions. Nevertheless, the above-mentioned researches ignored the differences in dependence patterns of cobalt trade between importers and exporters. Cobalt trade is used to boost the economy of exporting countries. Conversely, it is used to meet the energy transition needs of importing countries (Leon et al., 2021; Sun X. et al., 2022). Given that importers and exporters hold varied trade goals and different dependence on other countries in international cobalt trade, it is vital to reveal the dependence patterns of cobalt trade from importers and exporters. On this basis, this study examines the dependence patterns of cobalt trade among countries from the perspectives of importers and exporters, respectively.
Many researches have focused on the influencing factors of international trade (Subramanian and Wei, 2007; Campi and Duenas, 2019; Liu A. et al., 2020). On the one hand, based on the gravity model (Linnemann, 1966; Sun and Shi, 2022), geographical distance (Martinez-Zarzoso and Nowak-Lehmann, 2004), market size (Gopinath and Echeverria, 2004), trade openness (Cavallo and Frankel, 2008), cultural similarity (Kristjansdottir et al., 2020), and exchange rate (Bahmani-Oskooee, 1986; Kang and Dagli, 2018) are identified as significant factors in international trade. On the other hand, using the panel regression methods, Zhang et al. (2021) found that country risks significantly impact energy trade patterns. In terms of mineral resources trade, Zheng et al. (2017) examined the factors influencing the import and export trade of nonferrous metals in China and found that political risk is one of the important factors. Owing to different resource endowments, most cobalt resources are distributed in a few countries with unstable political or economic environments, such as the COD and Cuba (US Geological Survey, 2022). This has directly led to a significant impact on the global supply of cobalt resources (Sun X. et al., 2019; Liu S. et al., 2020). Therefore, country risks may become an important factor influencing the international trade of cobalt. Then, whether country risks have an impact on the dependence patterns of cobalt trade among countries remains to be studied.
In this study, we use the cobalt ore and concentrate trade to represent the cobalt trade. In the cobalt trade, the import dependence of country A on country B is defined as the proportion of the cobalt trade volumes of country A importing from country B in the volumes of country A importing from the world. Similarly, the export dependence of country B on country A is defined as the proportion of the cobalt trade volumes of country B exporting to country A in the volumes of country B exporting to the world. Then, we construct a cobalt import dependence network (CIDN) and a cobalt export dependence network (CEDN) due to the different trading goals of importers and exporters. Based on the network analysis method, this study uses network indicators to reveal the dependence patterns of cobalt trade among countries, and construct diversification indices of trade relations to analyze the import source risk and the market concentration of cobalt trade. Moreover, based on the panel regression method, we explore the impacts of country risks (including political risk and economic risk) on the import and export dependence patterns of cobalt trade. Finally, this study proposes policy implications for countries with different cobalt trade dependence patterns from the perspective of trade security.
Our key contributions are twofold. First, this paper constructs new indicators to examine the diversification of trade relations, including IHHI and EHHI. These indicators provide a close observation of import source risk and the market concentration of cobalt trade. Second, this study is the first to explore the factors influencing cobalt trade dependence relations in combination with network indicators. We mainly reveal the impact of country risk on the pattern of cobalt trade dependence among countries.
The structure of this study is as follows: Section 2 introduces the data and methodology, Section 3 presents the results and relates discussions, and research conclusions and policy implications are underlined in Section 4.
2 Methodology and Data
2.1 Data
The data of trade flow of cobalt ores and concentrates among 171 countries and regions (hereafter, countries) from 2000 to 2019 are downloaded from UN Comtrade (https://comtrade.un.org/), of which the product code is “HS 2605”1. The data of country risks are collected from the International Country Risk Guide (https://www.prsgroup.com/). The GDP and population data are obtained from the World Bank database (https://data.worldbank.org.cn/).
2.2 Methodology
2.2.1 Construction of Cobalt Trade Dependence Network
This study constructs a CIDN and a CEDN. In the networks, nodes represent countries involved in cobalt trade, edges represent the dependence relations of cobalt trade and the direction of the edges is the trade flows. Therefore, CIDN and CEDN are directed and weighted, and the network matrixes are defined as Eqs 1, 2 (Sun et al., 2022a).
In these above two equations,
In these above two equations,
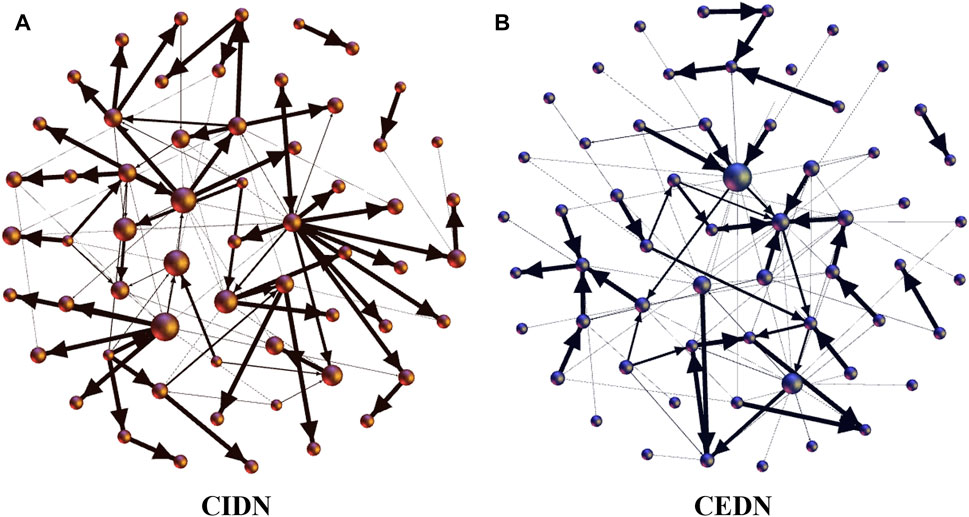
FIGURE 1. The cobalt trade dependence network in 2019 ((A) and (B) represent the cobalt import dependence network and the cobalt export dependence network respectively).
2.2.2 Measurement Indicators of Trade Dependence Pattern
To measure the dependence patterns of cobalt trade among countries, this study mainly uses network indicators of CIDN and CEDN, and the diversification indices of trade relations constructed on the basis of trade dependence theory and the Herfindahl-Hirschmann index.
(1) The number of trading partners. In CIDN and CEDN, the degree of node i represents the number of cobalt trading partners of country i, defined as
(2) The total trade volumes. In CIDN and CEDN, the total trade volumes (TTV) of country i can be divided into two indicators, including the total import volumes (TIV) and total export volumes (TEV). The calculation methods of these indicators are Eqs 8–10. When the value of the TIV of country i is large, it means that the country has a high demand for cobalt. TTV can reflect each country’s trade share in the global cobalt trade market.
(3) Betweenness centrality. Betweenness centrality (BC) reflects the ability of countries to control cobalt resources in the network. Its power, as an intermediary in the networks, is expressed by measuring the number of shortest paths through this country in the network (Goh et al., 2003). The calculation method of betweenness centrality of country i shows in Eq 11 (Freeman, 1977; Boccaletti et al., 2006).
In Eq 11,
(4) Closeness centrality. The cobalt trade distance of a country to other countries is expressed by measuring the average length of the path established with other countries in the network, which is measured by closeness centrality (CC) (Sabidussi, 1966; Xi et al., 2019). The calculation method of closeness centrality of country i is in Eq 12 (Freeman, 1978; Boccaletti et al., 2006). The higher the closeness centrality of country i, the shorter the cobalt trade distance.
In Eq 12,
(5) Herfindahl-Hirschmann index. To analyze the diversification of trade relations of each country, this study uses Herfindahl-Hirschmann Index (HHI) proposed by Hirschmann and Herfindahl, which value ranges from 0 to 1 (Hirschman, 1964; Rhoades, 1993). The HHI can be used not only to assess the import source risk of cobalt from the perspective of diversification of import relations, but also to measure the market concentration of cobalt trade according to export relations (Achzet and Helbig, 2013; Vivoda, 2019; Althaf and Babbitt, 2021). Thus, based on trade dependence and the Herfindahl-Hirschmann index, this paper constructs the diversification indices of trade relations (THHI). THHI includes the diversification index of import relations (IHHI) and diversification index of export relations (EHHI), defined as Eqs 13, 14 respectively. When the
2.3 Variables Analysis
This research selects countries with the total cobalt trade volumes more than 150,000 tons from 2000 to 2019, and due to the availability of the data, 62 countries are selected (referring to Supplementary Table S1). The cobalt trade of these countries accounts for over 99% of the global cobalt trade, including 32 importers and 30 exporters. A country that acts primarily as a demander (supplier) with a large amount of cobalt is classified as an importer (exporter)2 (Zhang et al., 2021).
(1) Independent variables. This study aims at exploring the impact of country risks on the dependence patterns of cobalt trade. Therefore, the country risks act as independent variables. The country risks include political and economic risks, consisting of 12 components and five components respectively3. We use Eqs 15, 16 to adjust the political risk index and the economic risk index. In this study, the higher the values of political and economic risk indices are, the higher the political and economic risks are.
In Eqs 15, 16,
(2) Dependent variables. Network indicators could provide a clear picture of the dependence pattern of cobalt trade among countries. Therefore, the dependent variables are the network indicators of CIDN and CEDN and the THHI. For importers, we choose the in-degree, total import volumes, closeness centrality and IHHI as dependent variables. For exporters, we choose out-degree, total trade volumes, betweenness centrality and EHHI as the dependent variables (Zhang et al., 2021).
(3) Control variables. On the one hand, since economic development can reflect both demand and supply in a country, the size of the trading partner’s economy is generally considered as a major determinant of international trade flows. A higher level of economic development in a country means that it tends to have greater international trade flows. On the other hand, the more population a country has, the greater potential domestic demand it enjoys. Moreover, the population also affects each country’s supply and is believed to affect the flow of international trade. Therefore, this study uses GDP and the total population to measure the economic scale and population of each country separately (Zheng et al., 2017; Dong et al., 2018).
2.4 Regression Model
After the above analysis, variables in Table 1 are selected to establish regression models. Logarithmic processing of total import volumes, total trade volumes, GDP, and the total population are conducted to make the data more stable (Zhang et al., 2021).
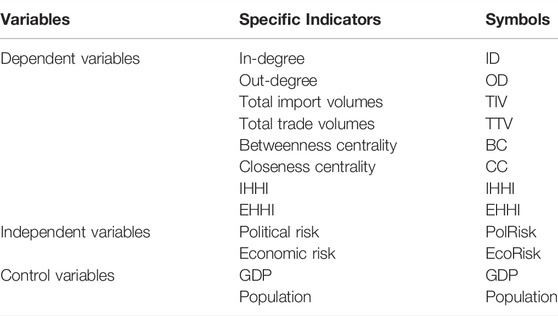
TABLE 1. Variables in the regression models.
This study mainly focuses on the impact of country risks (including political risk and economic risk) on the dependence patterns of cobalt trade. Volatile economic and political environments, such as war, ethnic conflicts and economic depression, could affect the production or consumption of cobalt-related industries in the countries. Meanwhile, increased political and economic risks could also impact cobalt transportation, prices, etc. The aspects mentioned above could affect the cobalt trade between countries and further influence the dependence pattern of cobalt trade among countries. Since there are glaring distinctions in the dependence patterns of cobalt trade between importers and exporters, we construct different regression models. We use Eq 17 to explore the impact of country risks on import dependence patterns of cobalt trade. Four regression models are constructed using the in-degree, total import volumes, closeness centrality and IHHI as dependent variables
In Eq 17, m represents importers, and t represents year.
Likewise, Eq 18 is used to study the impact of country risks on export dependence patterns of cobalt trade. Four regression models are constructed using the out-degree, total trade volumes, betweenness centrality and EHHI as dependent variables
In Eq 18, n represents exporters.
3 Results and Discussion
3.1 The Dependence Patterns of International Cobalt Trade
3.1.1 The General Evolution Characteristics of CIDN and CEDN
The basic topological structure of CIDN and CEDN can reflect their general evolutionary characteristics. The number of countries and trade relations in CIDN and CEDN are counted, whose evolution trends are shown in Figure 2. The number of countries and trade relations follow roughly the same trend over time, and there was an upward trend from 2000 to 2007 and a downward trend from 2007 to 2019.

FIGURE 2. The number of countries and trade relations in CIDN and CEDN from 2000 to 2019.
To analyze the dependence patterns of cobalt trade in detail, we divide the trade relations in CIDN and CEDN into ten groups according to the value of import dependence
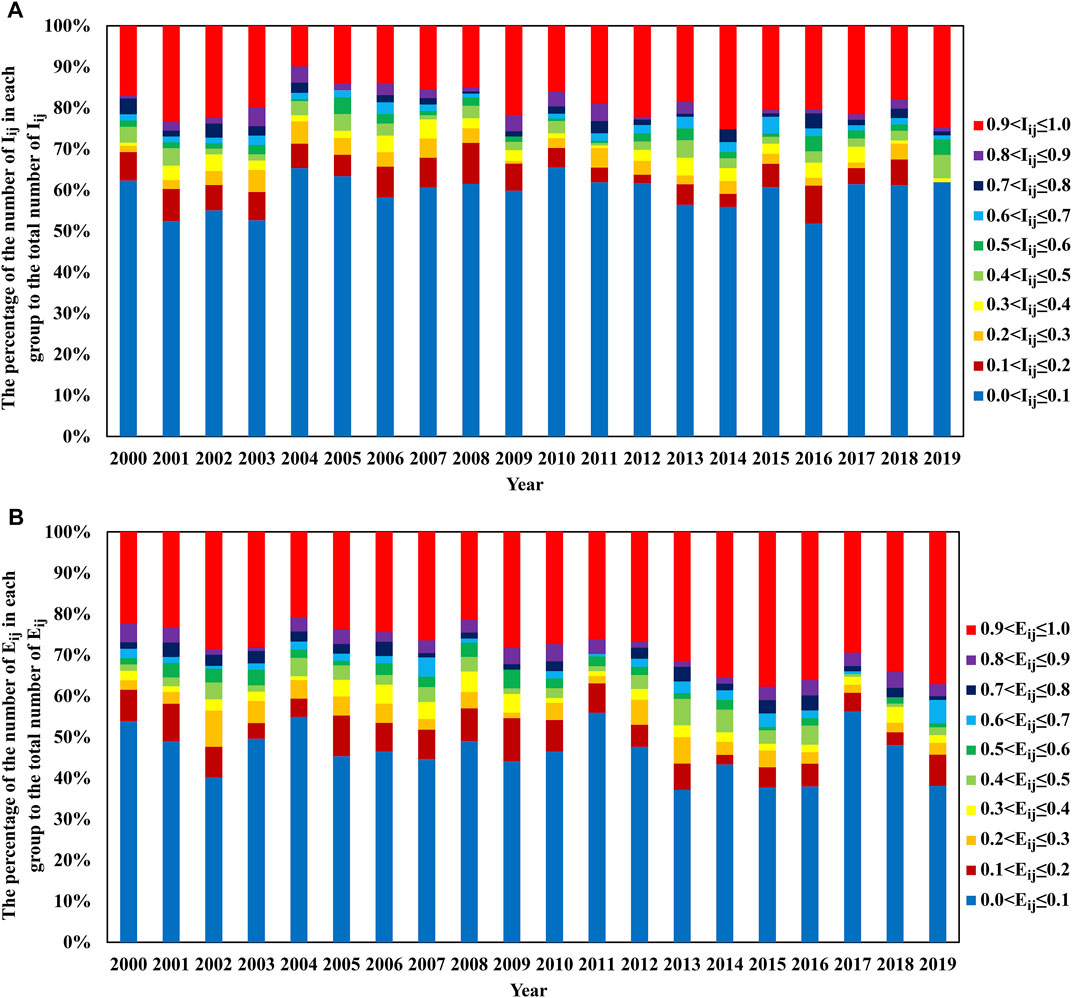
FIGURE 3. The percentage of the number of trade relations in each group to the total number of trade relations in CIDN and CEDN from 2000 to 2019 ((A) reflects the percentage related to import dependence in CIDN, and (B) reflects the percentage related to export dependence in CEDN).
3.1.2 Import Dependence Patterns of Cobalt Trade
(1) The import volumes
We choose importers with the high import volumes of cobalt, including China (CHN), Zambia (ZMB), Finland (FIN), India (IND), the United Arab Emirates (ARE), Switzerland (CHE), Japan (JPN), and the United Kingdom (GBR). Figure 4 shows the percentages of each importer’s import volumes of cobalt to the global import volumes. For example, the orange bars indicate China’s cobalt import volumes, which accounted for 66% of global import volumes in 2000. The sum of import volumes of these eight importers accounted for 79–99% of the global import volumes each year, indicating that these countries play a decisive role in the global market for cobalt resources demand. Additionally, since 2003, China’s import volumes have exceeded Finland’s and ranked first in the world, due to China’s transformation of its industrial structure to become the world’s largest producer of refined cobalt, with global production of refined cobalt being concentrated in China. The result is in line with Zhao et al. (2020).
(2) The role of importers in international cobalt trade
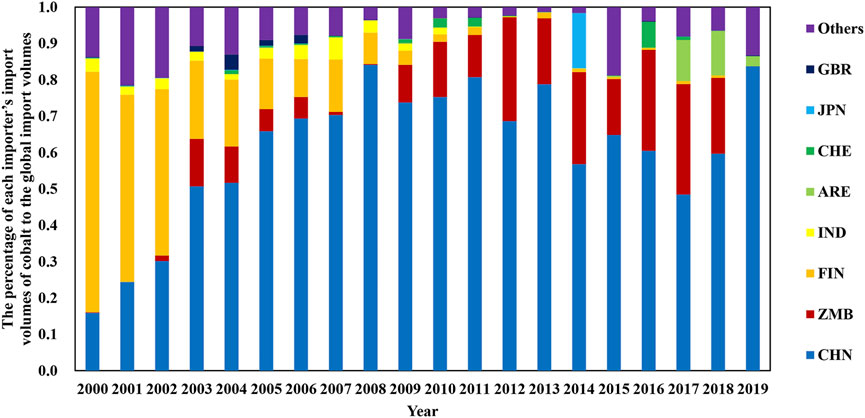
FIGURE 4. The percentage of each importer’s import volumes of cobalt to global import volumes in CIDN from 2000 to 2019.
According to the average closeness centrality of each importer from 2000 to 2019, the United Kingdom has the highest average ranking for closeness centrality, which shows that the United Kingdom plays an important role and has the shortest cobalt trade distance with other countries in the trade network. We select the top four countries in terms of average closeness centrality rankings, namely the United Kingdom (GBR), Zambia (ZMB), Spain (ESP) and Belgium (BEL), and their annual rankings of closeness centrality are shown in Figure 5. It can be found that the closeness centrality ranking of the United Kingdom fluctuated greatly from 2000 to 2003, as most of the United Kingdom’s import partners were different every year. And it also clearly changed the import dependence between the United Kingdom and other countries. Besides, since 2004 the import partners of the United Kingdom have consisted mainly of the United States, Zambia, Ireland, and Poland, and the United Kingdom has high import dependence on these four countries, which has resulted in a stable closeness centrality ranking for the United Kingdom.
(3) The diversification of import relations
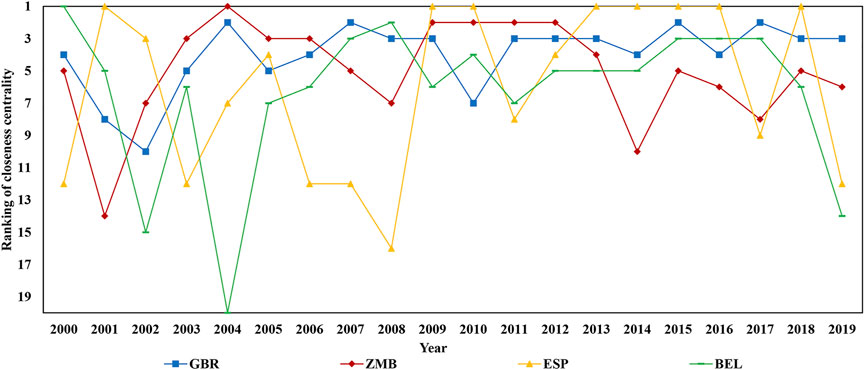
FIGURE 5. The rankings of closeness centrality from 2000 to 2019.
Generally speaking, for cobalt importers, a large number of importing partners may reduce the import dependence on the individual country and the import source risk of cobalt. However, if an importer has lots of importing partners, and most of the cobalt is imported from one country, then it has high import dependence on this partner, causing a high import source risk of cobalt. More specifically, when its import partner with high import dependence suddenly cuts off the supply, the importer will be significantly influenced. To better understand the import source risk of cobalt in each country, we draw a scatter plot between the number of import partners and the IHHI for importers, which is shown in Figures 6A–E where the horizontal axis represents IHHI, and the vertical axis represents in-degree. The fitting curve of the scatter plot shows a negative correlation between the number of import partners and the IHHI, which means that the import relationship is more diversified when the importer has more importing partners. It is worth noting that many of the dots are distributed in the bottom right corner, which indicates that most importers have fewer import partners and lower diversification of import relations. Therefore, most importers have a high import source risk of cobalt. Besides, it can be observed that China always acts as an outlier, with a downward trend in its number of import partners and an upward trend in the IHHI, which means that its import source risk of cobalt is increasing.
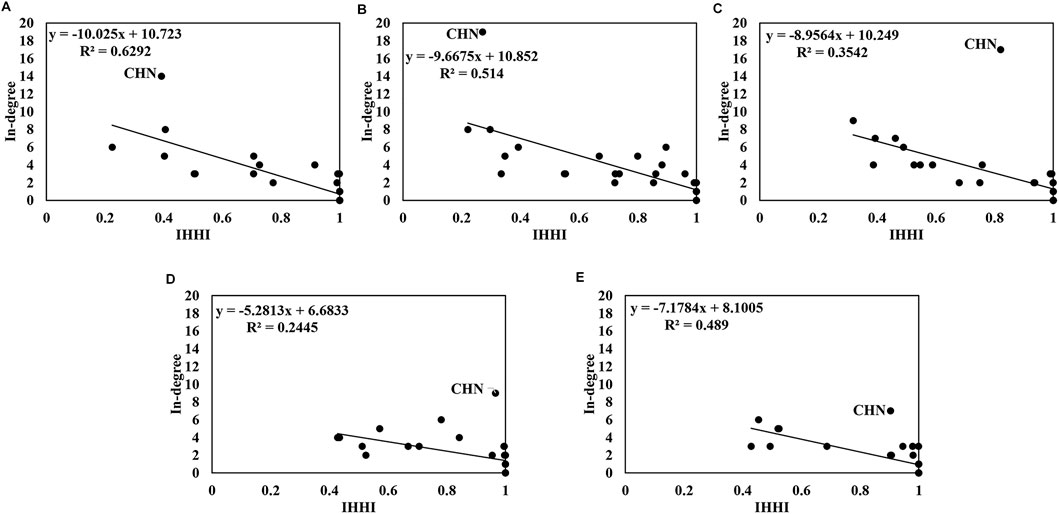
FIGURE 6. The scatter plot between the number of import partners and the IHHI ((A–E) correspond to the years of 2000, 2005, 2010, 2015, and 2019 respectively).
3.1.3 Export Dependence Patterns of Cobalt Trade
(1) The export volumes
Similar to importers, we choose exporters with high export volumes, including the COD, South Africa (ZAF), Congo (COG), Indonesia (IDN), Cuba (CUB), Russia (RUS), Thailand (THA), and Canada (CAN). Figure 7 shows the percentage of the eight exporters’ export volumes of cobalt to the global export volumes. For example, the red bars indicate that South Africa’s cobalt export volumes, which accounted for 12% of global export volumes in 2000. The sum of export volumes of these eight countries accounted for 72–98% of the global export volumes each year. Therefore, these eight countries play a decisive role in the global supply market for cobalt resources. In terms of export volumes, the COD has been ranked first in the world, as the country has 46% of the global cobalt resources. In 2018, the COD implemented a new mining law that increased taxes and royalties for cobalt mining companies and raised the export tax on cobalt resources. This might lead to a significant drop in export volumes from the COD in 2019.
(2) The analysis of the role of exporters
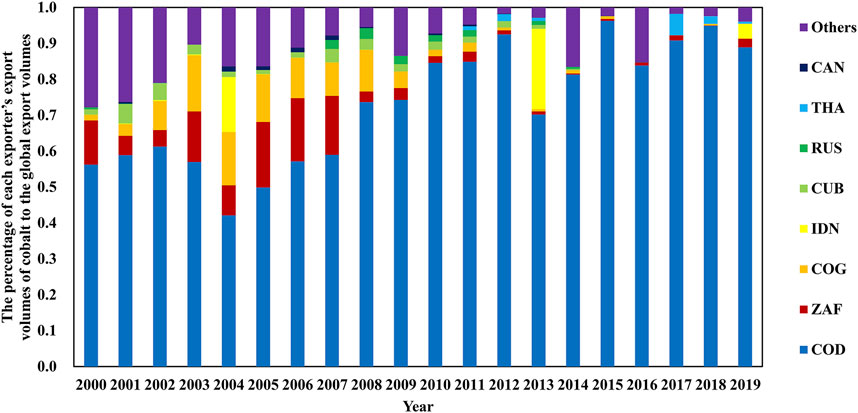
FIGURE 7. The percentage of each exporter’s export volumes of cobalt to global export volumes in CEDN from 2000 to 2019.
Based on the average betweenness centrality for each exporter from 2000 to 2019, the top four countries, including the United States (United States), South Africa (ZAF), Germany (DEU) and France (FRA) are selected in terms of average betweenness centrality, and the betweenness centrality rankings of these countries in each year are shown in Figure 8. It can be found that in most years, the United States and South Africa ranked higher than Germany and France in betweenness centrality, which means that they have a stronger ability to control cobalt resources than other countries and play an important role in the trade network. This is mainly mirrored in the intermediary role of the two countries in the cobalt trade network. Specifically, most cobalt in the United States is imported from South Africa and then exported to many countries in Asia, Europe, and North America. And South Africa mainly imports from Zambia and the COD, and then exports to many countries in Asia and North America. It has led to a high import dependence between these two countries and their many import partners.
(3) The diversification of export relations
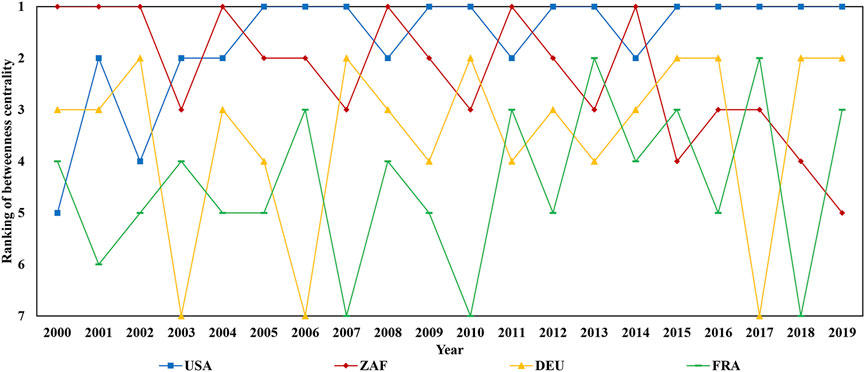
FIGURE 8. The rankings of betweenness centrality from 2000 to 2019.
Usually, cobalt exporters with many export partners may reduce export dependence on the individual country and reduce the market concentration of cobalt trade. If an exporter has many export partners, but most of the cobalt is exported to one country, then it has high export dependence on this partner, causing a high market concentration of cobalt trade. In this case, when its export partner with high export dependence changes importing sources of cobalt, the exporter will be greatly influenced. Therefore, Figures 9A–E shows a scatter plot between the number of export partners and the EHHI for exports, where the horizontal axis represents EHHI, and the vertical axis indicates out-degree. On this basis, three points stand out. First, similar to importers, the fitting curve of the scatter plot shows a negative correlation between the number of export partners and EHHI, which implies that the export relationship is also more diversified when the exporter has more exporting partners. Second, it is important to point out that many of the dots are distributed in the bottom right corner, which means that most exporters have fewer export partners and lower diversification of export relations. Consequently, most exporters have a high market concentration of cobalt trade. Third, with the advantage of a natural port, South Africa has many export partners, but it was the outlier in 2005 and 2010. This might because most cobalt from South Africa is exported to China, which has led to a high export dependence on China, resulting in a high market concentration of cobalt trade.
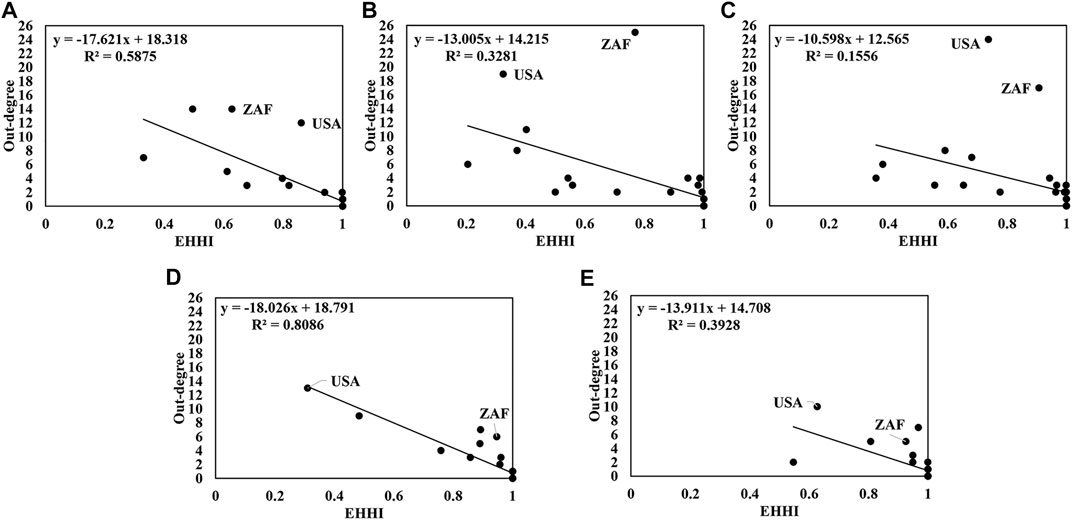
FIGURE 9. The scatter plot between the number of export partners and the EHHI ((A–E) correspond to the years of 2000, 2005, 2010, 2015, and 2019, respectively).
3.2 The Impact of Country Risks on the Dependence Patterns
3.2.1 Descriptive Statistical Analysis
Descriptive statistics for all variables are shown in Table 2. On average, exporters have higher diversification of trade relations, political risk, and economic risk than importers.
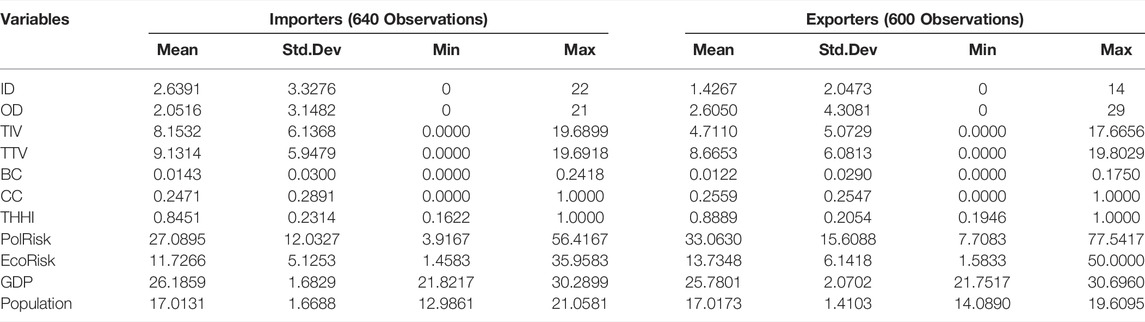
TABLE 2. Descriptive statistics.
3.2.2 The Panel Regression Results
Based on Section 2.4, regression models of the relationship between country risks and the dependence patterns of cobalt trade are constructed, and the results are presented in Table 3. Columns 1) to 4) are related to importers, and columns 5) to 8) are related to exporters.
(1) The regression results related to importers
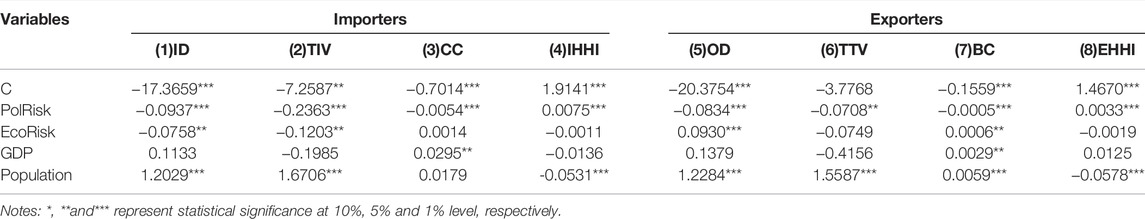
TABLE 3. Panel regression results of the country risks to the dependence patterns of cobalt trade.
The increased political risk of cobalt importers exerts a negative influence on the import dependence patterns of cobalt trade, which is similar to Zheng et al. (2017). An increase in political risk reduces the number of import partners and total import volumes, and meanwhile raises cobalt trade distance and the import source risk of cobalt of importers. High political risk means unstable political rights, poor regulation, and an imperfect legal environment; hence the reasons for the negative impact may be multifaceted. When the domestic political environment of a country is unstable, the instability and cost of trading with the country may grow, which may cause many import partners to stop exporting cobalt to this country. Meanwhile, political crises among importers may bring about warfare, making cargo transportation quite difficult. Besides, a volatile domestic political environment can impair or even interrupt normal production activities in many industries, particularly those heavily relying on imported raw materials, resulting in a lack of demand for cobalt in that country. For importers, cutting-off supply by many exporters and declining domestic demand reduce the number of import partners and total import volumes. This has led to import sources concentrating in a few remaining import partners, resulting in increased import dependence on these countries, which implies an increase in the import source risk of cobalt. For example, in 2018, Japan’s political risk increased markedly. This has negatively impacted Japan’s dependence pattern of cobalt trade. Specifically, Japan’s cobalt trade with countries such as South Africa and Zambia was interrupted. And Japan’s import volumes of cobalt decreased by 48,401 tons and its import dependence on the United States increased from 0.19 in 2017 to 0.98 in 2018, which directly contributed to an increase in Japan’s IHHI to 0.97. This means that Japan’s import source risk of cobalt increased significantly in 2018.
Besides, the increased economic risk of importers negatively impacts the dependence patterns of cobalt trade, reducing the number of import partners and the total import volumes to some extent. High economic risk indicates that the economic society of a country remains unstable. Meanwhile, the country’s aggregate demand is full of uncertainty and is often accompanied by depressed and insufficient demand in most consumer and investment markets. An increase in economic risk could lead to insufficient investment in cobalt-related industries and insufficient consumption of cobalt-related products. In addition, economic risks could lead to exchange rate fluctuations, making the trade cost more indefinite. These reasons could lead to a decrease in the total demand for cobalt and the number of import partners. In terms of import dependence, the unstable economic environment of importers does not increase their import dependence on most import partners, and the import source risk of cobalt does not change significantly, either.
As for control variables, the growth of GDP and the total population of importers have a significant positive impact on the import dependence patterns of cobalt trade. The larger the economic scale of the importer, the more direct trade relations it has, which makes cobalt trade distances shorter. As cobalt is widely used in batteries for all types of electronics, the total population of each importer reflects the size of its demand for cobalt. Therefore, the larger the total population of an importer is, the greater the number of import partners and the total import volumes will be. Furthermore, the huge demand for cobalt encourages importers to reduce the import source risk of cobalt by reducing their import dependence on an individual country.
(2) The regression results related to exporters
For exporters, the increasing political risk has a significant negative effect on their dependence patterns of cobalt trade, which is in line with Zheng et al. (2017). An increase in political risk reduces the number of export partners, total trade volumes, and the ability to control cobalt resources, and raises the market concentration of cobalt trade. The security of resource supply is an issue that importers must consider. In general, importers prefer importing resources from countries that have a stable political environment. As cobalt is a strategic mineral resource, importers are more concerned about the geopolitical environment of the supplying countries. The increasing domestic political risk for exporters could cause their partners to switch import sources, directly resulting in a reduction in the number of export partners and total export volumes. This could lead to a concentration of export channels with the remaining export partners and increased export dependence on other countries, increasing the cobalt trade market concentration. For instance, the decline in military risk of the COD in 2015 led to a decline in political risk, which positively impacted the COD’s export dependence pattern of cobalt trade. In particular, in 2015, the COD established new trade relations with countries such as Luxembourg, the United Arab Emirates, and the United States. In addition, COD’s cobalt trade volumes increased by 65,700 tons, and its export dependence on China and Zambia declined significantly. As a result, the EHHI of the COD declined significantly in 2015, meaning that the country had a lower market concentration of cobalt trade than in 2014.
In addition, the increasing economic risk has a positive influence on the export dependence patterns of cobalt trade, increasing the number of export partners and the exporters’ ability to control cobalt resources. For many mineral resource exporters, especially those with mining as their mainstay industry, the export of mineral resources is one of the most important sources of foreign exchange earnings and fiscal revenue. And for a few countries, it is even the main source of fiscal revenue. When a country’s domestic economic environment is unstable, the government often makes necessary regulations using fiscal policy. As a result, fiscal revenue and expenditure could become an urgent consideration for the government. To a considerable degree, the government may increase the number of export partners for various mineral resources, including cobalt. This measure could support fiscal revenue, thus improving the unstable domestic economic environment.
For the control variables, GDP and total population positively impact the export dependence patterns of cobalt trade. The total population of an exporter reflects its productivity, and usually the larger the population, the greater the productive capacity. Therefore, for exporters, the higher the total population, the higher the volume of cobalt trade and the higher the number of export partners. An exporter’s large cobalt trade volumes could contribute to a reduction in its export dependence on an individual country and reduce the market concentration of cobalt trade. In addition, a greater economic size of the exporter could lead to more trade dependent relations and enhance its ability to control cobalt resources.
4 Conclusion and Policy Implications
4.1 Conclusion
From the perspective of importers and exporters, this study deploys network indicators to reveal the dependence patterns of cobalt trade among countries, and construct diversification indices of trade relations to further analyze the import source risk and the market concentration of cobalt trade. In addition, based on the panel regression model, the impacts of country risks on the dependence patterns of cobalt trade are explored. The main conclusions are as follows.
(1) In the dependence patterns of international cobalt trade, there is a strong trade dependence between many countries. In the CIDN, most importers have a high import source risk of cobalt. Meanwhile, in the CEDN, most exporters have a high market concentration of cobalt trade. Moreover, the United Kingdom has the shortest cobalt trade distance with other countries in the CIDN. Notably, the United States and South Africa have a stronger ability to control cobalt resources than other countries in the CEDN.
(2) Changes in country risks could considerably influence the dependence patterns of cobalt trade among countries. Specifically, for cobalt importers, the increased country risks have a negative effect on the import dependence patterns of cobalt trade. An increase in political risk could reduce the number of import partners and total import volumes, and raise the import source risk of cobalt. Besides, the increased economic risk could reduce the number of import partners and the total import volumes of importers. For cobalt exporters, an increase in political risk or economic risk has different effects on export dependence patterns of cobalt trade. An increase in political risk could reduce the number of export partners, total trade volumes and the ability to control cobalt resources, and raise cobalt trade’s market concentration. In addition, the increased economic risk positively impacts the export dependence patterns of cobalt trade, increasing the number of export partners and the ability to control cobalt resources.
4.2 Policy Implications
Cobalt is an essential primary raw material in industrial production, and its indispensability in battery electrodes makes it a key resource for future energy transitions. Under the background of global economic decarbonization and the scarcity of cobalt resources, we suggest that countries should pay more focus on the cobalt trade. Therefore, it is significant to figure out the dependence patterns of global cobalt trade and the role of national risks in the evolution of different dependence patterns of cobalt trade for formulating cobalt trade policies.
We suggest that cobalt importing countries establish a cobalt reserve system (Shi, 2022). The government could set up a national cobalt reserve scheme, and these reserves could be sold when domestic cobalt supplies run low. Importing countries can also encourage related producers to stockpile cobalt for commercial purposes through financial subsidies. In addition, we suggest that the government develop a cobalt resource monitoring system to track the cobalt’s domestic supply (Shi, 2022). These measures could help importers reduce their import source risk of cobalt and mitigate the influence caused by country risks.
For exporting countries, we suggest that they should improve the cobalt trade cooperation system and extend their domestic cobalt industry chain. For trading partners with high cobalt demand, trade relationships could be stabilized by signing long-term resource supply agreements. Furthermore, exporters can export cobalt resources after deep processing or vigorously develop industries such as batteries and new energy vehicles. This could extend the domestic cobalt industry chain. Taking advantage of suitable production environments abroad, exporters could also expand their cobalt trade by establishing cobalt-related multinational companies and engaging in offshore production activities. These measures could reduce market concentration in the cobalt trade and reduce the impact of country risk on exporting countries.
Moreover, countries are suggested to establish cobalt recycling systems and develop new cobalt-free batteries (Zeng and Li, 2015). As the potential for cobalt recovery is enormous, cobalt recycling could be an important source of cobalt in the future (Liu W. et al., 2021). Thus, we advocate that countries should establish comprehensive battery recycling systems and develop proven recycling technologies to improve the efficiency of resource recovery (Wang and Ge, 2020). Besides, due to the scarcity of cobalt resources, the high cost of production is a bottleneck for the development of new energy vehicles. Therefore, countries with large car demand should cooperate to develop prospective and cobalt-free battery technologies.
4.3 Limitations
Due to the limitation of data, the control variables in this study only include economic scale and population. However, many factors could affect the dependence patterns of cobalt trade, such as resource endowment, geographical distance, and trade openness, which will be further investigated in our future research. Besides, cobalt is mainly used in the production of lithium batteries, and the application of lithium batteries is becoming more and more extensive. In future research, we will also consider the international trade in lithium batteries and compare the differences between the cobalt trade and the lithium battery trade.
Data Availability Statement
The original contributions presented in the study are included in the article/Supplementary Material further inquiries can be directed to the corresponding author.
Author Contributions
SS: Writing–Original Draft, Data Curation, Formal analysis; QS: Conceptualization, Methodology, Writing—Review and Editing Supervision; ZX: Conceptualization, Writing—Review and Editing Supervision; YH: Writing—Review and Editing Supervision; JG: Writing—Review; All authors contributed to the article and approved the submitted version.
Funding
This research is supported by Humanities and Social Science Research Project of Hebei Education Department (BJS2022006); the Humanities and Social Science major Project of Hebei Education Department (ZD201914); Special Funding for Soft Science Research under the Provincial Science and Technology Program of Hebei Province (22557404D); Research subject of Hebei Association for science and technology in 2022 (HBKX 2022D08) and the Scientific Research Initiation Project for High-level Talents of Hebei University (521000981396).
Conflict of Interest
The authors declare that the research was conducted in the absence of any commercial or financial relationships that could be construed as a potential conflict of interest.
Publisher’s Note
All claims expressed in this article are solely those of the authors and do not necessarily represent those of their affiliated organizations, or those of the publisher, the editors and the reviewers. Any product that may be evaluated in this article, or claim that may be made by its manufacturer, is not guaranteed or endorsed by the publisher.
Supplementary Material
The Supplementary Material for this article can be found online at: https://www.frontiersin.org/articles/10.3389/fenrg.2022.951235/full#supplementary-material
Footnotes
1This study chooses 2019 as the end year of this study, since they are the latest available data that are not influenced by the big trade shocks like COVID-19 (Sun X. et al., 2022).
2The ratio of the sum of cobalt import volumes to the sum of export volumes is calculated for each country from 2000 to 2019, with countries between 0 and 0.9 being exporters and those greater than 1.1 being importers. Each country with a ratio between 0.9 and 1.1 is an importer if the sum of its import volumes ranking in the 50th percentile, otherwise it is an exporter.
3Political risk involves 12 components, including the government stability, socioeconomic conditions, investment profile, internal conflict, external conflict, corruption, military in politics, religious tensions, law and order, ethnic tensions, democratic accountability, bureaucracy quality. Economic risk involves five components, including GDP per head, real GDP growth, annual inflation rate, budget balance as a percentage of GDP, current amount as a percentage of GDP. In addition, country risks in the International Country Risk Guide also include financial risk, but the effect of financial risk on dependence patterns of cobalt trade is not significant. Therefore, independent variables do not include financial risk.
References
Achzet, B., and Helbig, C. (2013). How to Evaluate Raw Material Supply Risks-An Overview. Resour. Policy 38 (4), 435–447. doi:10.1016/j.resourpol.2013.06.003
Althaf, S., and Babbitt, C. W. (2021). Disruption Risks to Material Supply Chains in the Electronics Sector. Resour. Conserv. Recycl. 167, 105248. doi:10.1016/j.resconrec.2020.105248
Bahmani-Oskooee, M. (1986). Determinants of International Trade Flows: The Case of Developing Countries. J. Dev. Econ. 20, 107–123. doi:10.1016/0304-3878(86)90007-6
Becker, J. M. (2021). General Equilibrium Impacts on the U.S. Economy of a Disruption to Chinese Cobalt Supply. Resour. Policy 71, 102005. doi:10.1016/j.resourpol.2021.102005
Boccaletti, S., Latora, V., Moreno, Y., Chavez, M., and Hwang, D. (2006). Complex Networks: Structure and Dynamics. Phys. Rep. 424 (4-5), 175–308. doi:10.1016/j.physrep.2005.10.009
Bonacich, P. (1972). Factoring and Weighting Approaches to Status Scores and Clique Identification. J. Math. Sociol. 2 (1), 113–120. doi:10.1080/0022250x.1972.9989806
Campi, M., and Dueñas, M. (2019). Intellectual Property Rights, Trade Agreements, and International Trade. Res. Policy 48 (3), 531–545. doi:10.1016/j.respol.2018.09.011
Cavallo, E. A., and Frankel, J. A. (2008). Does Openness to Trade Make Countries More Vulnerable to Sudden Stops, or Less? Using Gravity to Establish Causality. J. Int. Money Finance 27 (8), 1430–1452. doi:10.1016/j.jimonfin.2007.10.004
Chen, Z., Zhang, L., and Xu, Z. (2019). Tracking and Quantifying the Cobalt Flows in Mainland China during 1994-2016: Insights into Use, Trade and Prospective Demand. Sci. Total Environ. 672, 752–762. doi:10.1016/j.scitotenv.2019.02.411
Dalin, C., Konar, M., Hanasaki, N., Rinaldo, A., and Rodriguez-Iturbe, I. (2012). Evolution of the Global Virtual Water Trade Network. Proc. Natl. Acad. Sci. U. S. A. 109 (16), 5989–5994. doi:10.1073/pnas.1203176109
Dong, D., Gao, X., Sun, X., and Liu, X. (2018). Factors Affecting the Formation of Copper International Trade Community: Based on Resource Dependence and Network Theory. Resour. Policy 57, 167–185. doi:10.1016/j.resourpol.2018.03.002
Freeman, L. C. (1977). A Set of Measures of Centrality Based on Betweenness. Sociometry 40 (1), 35–41. doi:10.2307/3033543
Freeman, L. C. (1978). Centrality in Social Networks Conceptual Clarification. Soc. Netw. 1 (3), 215–239. doi:10.1016/0378-8733(78)90021-7
Goh, K.-I., Oh, E., Kahng, B., and Kim, D. (2003). Betweenness Centrality Correlation in Social Networks. Phys. Rev. E 67 (1), 017101. doi:10.1103/PhysRevE.67.017101
Gopinath, M., and Echeverria, R. (2004). Does Economic Development Impact the Foreign Direct Investment‐Trade Relationship? A Gravity‐Model Approach. Am. J. Agric. Econ. 86 (3), 782–787. doi:10.1111/j.0002-9092.2004.00625.x
Ji, Q., Zhang, H.-Y., and Fan, Y. (2014). Identification of Global Oil Trade Patterns: An Empirical Research Based on Complex Network Theory. Energy Convers. Manag. 85, 856–865. doi:10.1016/j.enconman.2013.12.072
Jones, B., Elliott, R. J. R., and Nguyen-Tien, V. (2020). The EV Revolution: The Road Ahead for Critical Raw Materials Demand. Appl. Energy 280, 115072. doi:10.1016/j.apenergy.2020.115072
Kang, J. W., and Dagli, S. (2018). International Trade and Exchange Rates. J. Appl. Econ. 21 (1), 84–105. doi:10.1080/15140326.2018.1526878
Kristjánsdóttir, H., Guðlaugsson, Þ. Ö., Guðmundsdóttir, S., and Aðalsteinsson, G. D. (2020). Cultural and Geographical Distance: Effects on UK Exports. Appl. Econ. Lett. 27 (4), 275–279. doi:10.1080/13504851.2019.1613495
Leem, B.-H., and Won, E. S. (2020). Analyzing Core-Periphery Structure Among Trade Countries of Agricultural Products. Korea Int. Trade Res. Inst. 16 (4), 121–131. doi:10.16980/jitc.16.4.202008.121
Leon, M. F. G., Blengini, G. A., and Dewulf, J. (2021). Analysis of Long-Term Statistical Data of Cobalt Flows in the EU. Resour. Conserv. Recycl. 173, 105690. doi:10.1016/j.resconrec.2021.105690
Liang, X., Yang, X., Yan, F., and Li, Z. (2020). Exploring Global Embodied Metal Flows in International Trade Based Combination of Multi-Regional Input-Output Analysis and Complex Network Analysis. Resour. Policy 67, 101661. doi:10.1016/j.resourpol.2020.101661
Linnemann, H. (1966). An Econometric Study of International Trade Flows. Can. J. Econ. Political Science/Revue Can. De Econ. Sci. Politique 33 (1), 633–634.
Liu, A., Lu, C., and Wang, Z. (2020a). The Roles of Cultural and Institutional Distance in International Trade: Evidence from China's Trade with the Belt and Road Countries. China Econ. Rev. 61, 101234. doi:10.1016/j.chieco.2018.10.001
Liu, L., Cao, Z., Liu, X., Shi, L., Cheng, S., and Liu, G. (2020b). Oil Security Revisited: An Assessment Based on Complex Network Analysis. Energy 194, 116793. doi:10.1016/j.energy.2019.116793
Liu, S., Dong, Z., Ding, C., Wang, T., and Zhang, Y. (2020c). Do you Need Cobalt Ore? Estimating Potential Trade Relations through Link Prediction. Resour. Policy 66, 101632. doi:10.1016/j.resourpol.2020.101632
Liu, H., Li, H., Qi, Y., An, P., Shi, J., and Liu, Y. (2021a). Identification of High-Risk Agents and Relationships in Nickel, Cobalt, and Lithium Trade Based on Resource-Dependent Networks. Resour. Policy 74, 102370. doi:10.1016/j.resourpol.2021.102370
Liu, W., Liu, W., Li, X., Liu, Y., Ogunmoroti, A. E., Li, M., et al. (2021b). Dynamic Material Flow Analysis of Critical Metals for Lithium-Ion Battery System in China from 2000-2018. Resour. Conserv. Recycl. 164, 105122. doi:10.1016/j.resconrec.2020.105122
Martínez-Zarzoso, I., and Nowak-Lehmann D., F. (2004). Economic and Geographical Distance: Explaining Mercosur Sectoral Exports to the EU. Open Econ. Rev. 15 (3), 291–314. doi:10.1023/b:Open.0000037702.33704.20
Rachidi, N. R., Nwaila, G. T., Zhang, S. E., Bourdeau, J. E., and Ghorbani, Y. (2021). Assessing Cobalt Supply Sustainability through Production Forecasting and Implications for Green Energy Policies. Resour. Policy 74, 102423. doi:10.1016/j.resourpol.2021.102423
Sabidussi, G. (1966). The Centrality Index of a Graph. Psychometrika 31 (4), 581–603. doi:10.1007/bf02289527
Shao, L., Kou, W., and Zhang, H. (2022). The Evolution of the Global Cobalt and Lithium Trade Pattern and the Impacts of the Low-Cobalt Technology of Lithium Batteries Based on Multiplex Network. Resour. Policy 76, 102550. doi:10.1016/j.resourpol.2022.102550
Shi, Q., Sun, X., Xu, M., and Wang, M. (2022). The Multiplex Network Structure of Global Cobalt Industry Chain. Resour. Policy 76, 102555. doi:10.1016/j.resourpol.2022.102555
Shi, Q. (2022). Cobalt Demand for Automotive Electrification in China: Scenario Analysis Based on the Bass Model. Front. Energy Res. 10, 903465. doi:10.3389/fenrg.2022.903465
Shutters, S. T., and Muneepeerakul, R. (2012). Agricultural Trade Networks and Patterns of Economic Development. PLoS One 7 (7), e39756. doi:10.1371/journal.pone.0039756
Subramanian, A., and Wei, S.-J. (2007). The WTO Promotes Trade, Strongly but Unevenly. J. Int. Econ. 72 (1), 151–175. doi:10.1016/j.jinteco.2006.07.007
Sun, X., and Shi, Q. (2022). Factors Influencing Embodied Energy Trade between the Belt and Road Countries: A Gravity Approach. Environ. Sci. Pollut. Res. 29 (8), 11574–11589. doi:10.1007/s11356-021-16457-y
Sun, Q., Gao, X., Wen, S., Feng, S., and Wang, Z. (2019a). Modeling the Impulse Response Complex Network for Studying the Fluctuation Transmission of Price Indices. J. Econ. Interact. Coord. 14 (4), 835–858. doi:10.1007/s11403-018-0231-x
Sun, X., Hao, H., Liu, Z., Zhao, F., and Song, J. (2019b). Tracing Global Cobalt Flow: 1995-2015. Resour. Conserv. Recycl. 149, 45–55. doi:10.1016/j.resconrec.2019.05.009
Sun, Q., Gao, X., Wang, Z., Liu, S., Guo, S., and Li, Y. (2020). Quantifying the Risk of Price Fluctuations Based on Weighted Granger Causality Networks of Consumer Price Indices: Evidence from G7 Countries. J. Econ. Interact. Coord. 15 (4), 821–844. doi:10.1007/s11403-019-00273-2
Sun, Q., Gao, X., Si, J., Xi, X., Liu, S., Zheng, H., et al. (2022a). The Evolution of the Energy Import Dependence Network and its Influencing Factors: Taking Countries and Regions along the Belt and Road as an Example. J. Bus. Econ. Manag. 23 (1), 105–130. doi:10.3846/jbem.2021.15661
Sun, Q., Hou, M., Shi, S., Cui, L., and Xi, Z. (2022b). The Influence of Country Risks on the International Agricultural Trade Patterns Based on Network Analysis and Panel Data Method. Agriculture 12 (3), 361. doi:10.3390/agriculture12030361
Sun, X., Shi, Q., and Hao, X. (2022c). Supply Crisis Propagation in the Global Cobalt Trade Network. Resour. Conservation Recycl. 179, 106035. doi:10.1016/j.resconrec.2021.106035
Tian, X., Geng, Y., Sarkis, J., Gao, C., Sun, X., Micic, T., et al. (2021). Features of Critical Resource Trade Networks of Lithium-Ion Batteries. Resour. Policy 73, 102177. doi:10.1016/j.resourpol.2021.102177
U.S. Geological Survey (2022). Mineral Commodity Summaries. Available at: https://pubs.usgs.gov/periodicals/mcs2022/mcs2022-cobalt.pdf (Accessed May 01, 2022).
van der Meide, M., Harpprecht, C., Northey, S., Yang, Y., and Steubing, B. (2022). Effects of the Energy Transition on Environmental Impacts of Cobalt Supply: A Prospective Life Cycle Assessment Study on Future Supply of Cobalt. J Industrial Ecol. doi:10.1111/jiec.13258
Vivoda, V. (2019). LNG Import Diversification and Energy Security in Asia. Energy Policy 129, 967–974. doi:10.1016/j.enpol.2019.01.073
Wang, Y., and Ge, J. (2020). Potential of Urban Cobalt Mines in China: An Estimation of Dynamic Material Flow from 2007 to 2016. Resour. Conserv. Recycl. 161, 104955. doi:10.1016/j.resconrec.2020.104955
Xi, X., Zhou, J., Gao, X., Liu, D., Zheng, H., and Sun, Q. (2019). Impact of Changes in Crude Oil Trade Network Patterns on National Economy. Energy Econ. 84, 104490. doi:10.1016/j.eneco.2019.104490
Zeng, X., and Li, J. (2015). On the Sustainability of Cobalt Utilization in China. Resour. Conserv. Recycl. 104, 12–18. doi:10.1016/j.resconrec.2015.09.014
Zhang, H., Wang, Y., Yang, C., and Guo, Y. (2021). The Impact of Country Risk on Energy Trade Patterns Based on Complex Network and Panel Regression Analyses. Energy 222, 119979. doi:10.1016/j.energy.2021.119979
Zhao, Y., Gao, X., An, H., Xi, X., Sun, Q., and Jiang, M. (2020). The Effect of the Mined Cobalt Trade Dependence Network's Structure on Trade Price. Resour. Policy 65, 101589. doi:10.1016/j.resourpol.2020.101589
Keywords: cobalt trade, trade dependence, country risks, complex network, panel regression
Citation: Shi S, Sun Q, Xi Z, Hou M and Guo J (2022) The Impact of Country Risks on the Dependence Patterns of International Cobalt Trade: A Network Analysis Method. Front. Energy Res. 10:951235. doi: 10.3389/fenrg.2022.951235
Received: 23 May 2022; Accepted: 20 June 2022;
Published: 13 July 2022.
Edited by:
Xiaoqi Sun, Shenzhen University, ChinaReviewed by:
Zhili Zuo, China University of Geosciences Wuhan, ChinaQiangfeng Li, University of Southern Denmark, Denmark
Copyright © 2022 Shi, Sun, Xi, Hou and Guo. This is an open-access article distributed under the terms of the Creative Commons Attribution License (CC BY). The use, distribution or reproduction in other forums is permitted, provided the original author(s) and the copyright owner(s) are credited and that the original publication in this journal is cited, in accordance with accepted academic practice. No use, distribution or reproduction is permitted which does not comply with these terms.
*Correspondence: Qingru Sun, c3VucWluZ3J1QGhidS5lZHUuY24=