
94% of researchers rate our articles as excellent or good
Learn more about the work of our research integrity team to safeguard the quality of each article we publish.
Find out more
ORIGINAL RESEARCH article
Front. Energy Res., 13 July 2022
Sec. Sustainable Energy Systems
Volume 10 - 2022 | https://doi.org/10.3389/fenrg.2022.945180
 Han Chang1
 Feng-Lin Jing1
 Yao-Long Hou2*Li-Qi Chen3Yi-Jun Yang4Tian-Ye Liu1Chen-Lin Wei5Bin-Qing Zhai1*Cai-Ying Hou6
Solar energy is used in buildings worldwide. However, because the efficiency of photovoltaic power generation varies with environmental fluctuations, it is difficult to control. Therefore, electricity generation from photovoltaics is often poorly matched to the electricity load of the house. The use of storage batteries and photovoltaic panels can effectively improve the stability of the energy supply; however, it also introduces the problem of higher initial costs. Generally, a larger photovoltaic area and battery capacity can lead to higher costs and more renewable energy; therefore, to determine a suitable size of photovoltaic and storage battery for a house, the energy demand of the house must also be considered. The traditional method for sizing photovoltaics and storage batteries mainly considers the daily average electricity demand and the useful area for installing photovoltaics. To size the photovoltaic in a more precise manner, we propose a mathematical model (nonlinear programming) for selecting a relatively optimal solution for the photovoltaic area, battery capacity, and photovoltaic installation angle by considering the hourly and annual demands for electricity from the grid. To validate this mathematical method, a detached house in Zhouzhi county, Shaanxi province, China, was selected to size the devices by the proposed method. Results show that the device sizes determined using the proposed mathematical model are significantly smaller than those determined using the traditional method, without suffering a significant increase in the demand for electricity from the grid. According to our economic analysis, although the proposed method for sizing devices reduces the device cost payback period by half compared to that of the traditional method, the payback period for the devices sized using the proposed method is still 10.6 years. The extremely low electricity price in China may contribute to the extended payback period and thus discourage residents from installing renewable energy devices.
Traditional energy resources, such as fossil fuels, are indispensable for human survival and development. The total life-cycle carbon emissions of buildings in China amounted to 4.93 billion t CO2 in 2018, which accounted for 51.2% of the total national energy carbon emissions (China Building Energy Consumption Annual Report 2020, 2021). The energy used in buildings is mainly derived from fossil fuels, which are non-renewable resources that cause high CO2 emissions. Recently, renewable and clean energy sources have attracted increasing attention. With the continuous reduction in the price of photovoltaic (PV) power generation equipment, solar energy is being widely used in buildings globally (Bilgili et al., 2015).
In practical applications, solar energy is accompanied by uncontrollable problems, and the efficiency of PV power generation varies with environmental fluctuations. The use of batteries in conjunction with PV panels can effectively improve the stability of the energy utilization of a PV power system (Argyrou et al., 2021a; Argyrou et al., 2021b); however, this leads to a further increase in the initial investment. The required PV area for energy consumption is different for different buildings, and the corresponding battery capacities also vary. However, the traditional method for sizing the PV and storage battery for residential houses mainly considers the daily average electricity load of the house. Consequently, a more precise configuration of the appropriate PV and battery size can save device materials and improve overall economic performance.
Many studies have been conducted on the optimization of the sizing of hybrid renewable energy systems. Most studies have focused on the economic and the environmental factors affecting the installation of renewable energy. Singh et al. (2017). developed a hybrid energy system comprising photovoltaic panels, a wind turbine, and a power storage device based on the net present value cost to obtain the best solution. Ekren and Ekren, 2008. obtained the optimal PV area, rotor swept area of a wind turbine, and battery capacity based on the hourly operating cost. Maleki and Askarzadeh (Maleki and Askarzadeh, 2014) optimized the size of a hybrid wind, diesel, and battery energy system in terms of the total present cost and environmental air pollutant emissions and compared it with that of a separate diesel generation system to obtain the optimal size of the hybrid system. Ashok, 2007. identified the optimal mix of renewable energy sources for rural communities based on life-cycle cost minimization. Akram et al. (2018). balanced the stability and cost control of hybrid energy systems and proposed an iterative search algorithm to derive the optimal sizes of PV, wind, and battery materials. Lin Xu et al. (2013). derived the optimal sizes of PV, wind, and batteries based on the power supply stability, cost minimization, and full utilization of renewable energy sources. Ahmadi and Abdi, 2016 sized an energy system based on the total present value cost of optimization. Ogunjuyigbe et al. (2016). sized PV, wind, diesel, and battery systems based on the life-cycle cost, CO2 emissions, and amount of wasted energy. Yang and Nehorai, 2014. optimized renewable energy capacity with battery storage based on the initial investment and operation and maintenance costs. Atia and Yamada, 2016. sized PV, wind, and battery energy systems to meet changes in demand and obtain the best economic efficiency. Some researchers have investigated renewable energy device sizing methods by considering the daily house load. Borowy and Salameh, 1994. calculated the optimal size of a PV array in a hybrid wind and PV system based on the best match with a given load. Lai and McCulloch, 2017 optimized PV, battery, and biopower systems to balance power generation and demand and reduce energy consumption. Kaldellis et al., 2010 optimized the size of an autonomous power generation system combining PV and battery systems based on the maximum available solar potential exploitation and the lowest investment in power generation systems. Most of the studies concentrated on the economic and environmental effects and the analyses in these studies applied only the typical daily load of a house. However, the daily loads, particularly the heating and cooling loads, fluctuate in different environments, such as the ambient temperature and relative humidity in different seasons. Therefore, considering the energy demand in real-time within a year is very crucial to determine the specifications of the devices including the capacity of storage battery and PV angle. With modern hardware and programming language, designing a practical tool to size the PV and storage battery by considering the hourly energy demand pattern within a year can help the engineers to precisely size the devices.
In this study, an enumeration calculation procedure (nonlinear programming) is designed based on the hourly energy demand of a specific house for 1 year to obtain relatively optimized PV and battery sizes and the optimal angle of PV panels for each size combination of devices. Simultaneously, PV, battery, and local grid electricity prices are evaluated to compare the payback periods for devices sized using the traditional and proposed methods. A detached house in Zhouzhi county, China, was used as a case study to validate this approach. There are three contributions of this study. Firstly, a practical tool was created to size the PV and storage battery for the detached house. Secondly, the size of PV and storage battery can be narrowed down to a more suitable range without sacrificing much increase of the electricity usage from grid by using this tool. Lastly, the calculation time is acceptable when the program is run on a device with normal specifications.
Following the introduction, Section 2 illustrated the materials and methods in this study and Section 3 presented the processes of building the mathematical method. The results were analyzed in Section 4. Section 5 discussed the results and Section 6 concluded the findings of this research.
In this study, the DesignBuilder was used for the energy demand prediction. DesignBuilder is a calibrated commercial software based on EnergyPlus, which is a calculation engine mainly for the analysis of heating, cooling, lighting, equipment, and other energy demands in buildings. The DesignBuilder user interface is shown in Figure 1.
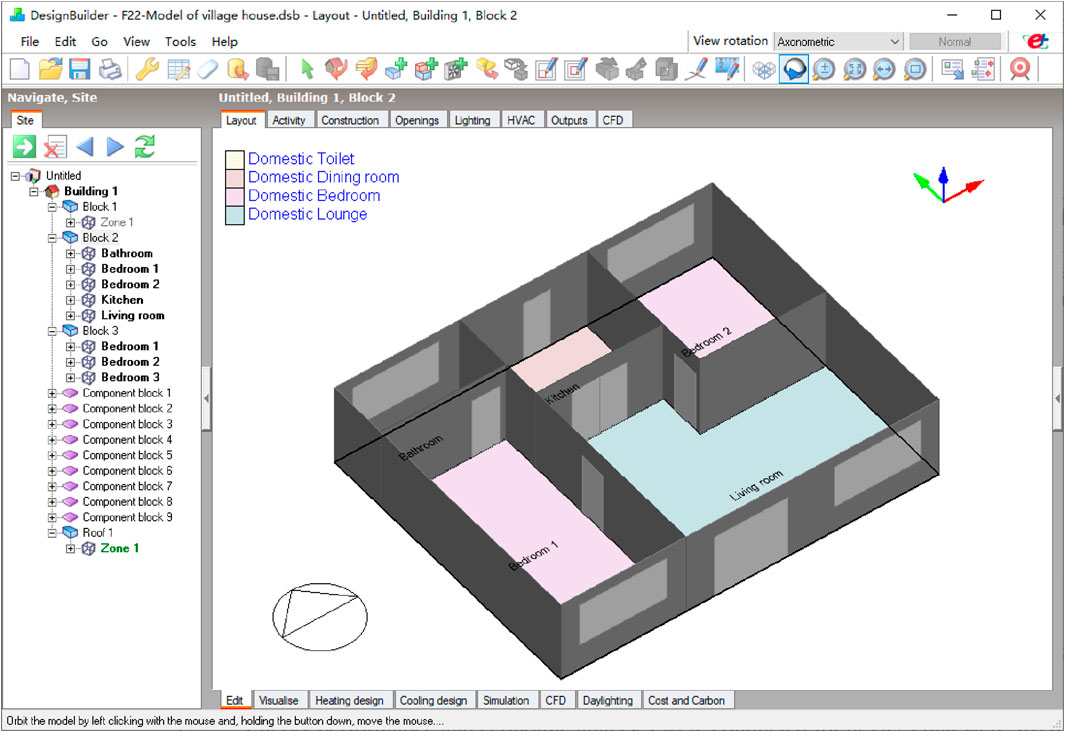
FIGURE 1. User interface of DesignBuilder.
The mathematical model proposed in this study was developed using the Python programming language, and the PyCharm Community Version was used to compile the program. Figure 2 shows the user interface of the PyCharm compiler. Figure 2 also shows the user interface of the nonlinear program created in this study, where the user inputs the size range of the PV and storage battery and the installation angle. The input file, including the hourly ambient temperature, solar radiation, and annual hourly energy demand from the house, is required. When calculation is completed, the elapsed time is displayed.
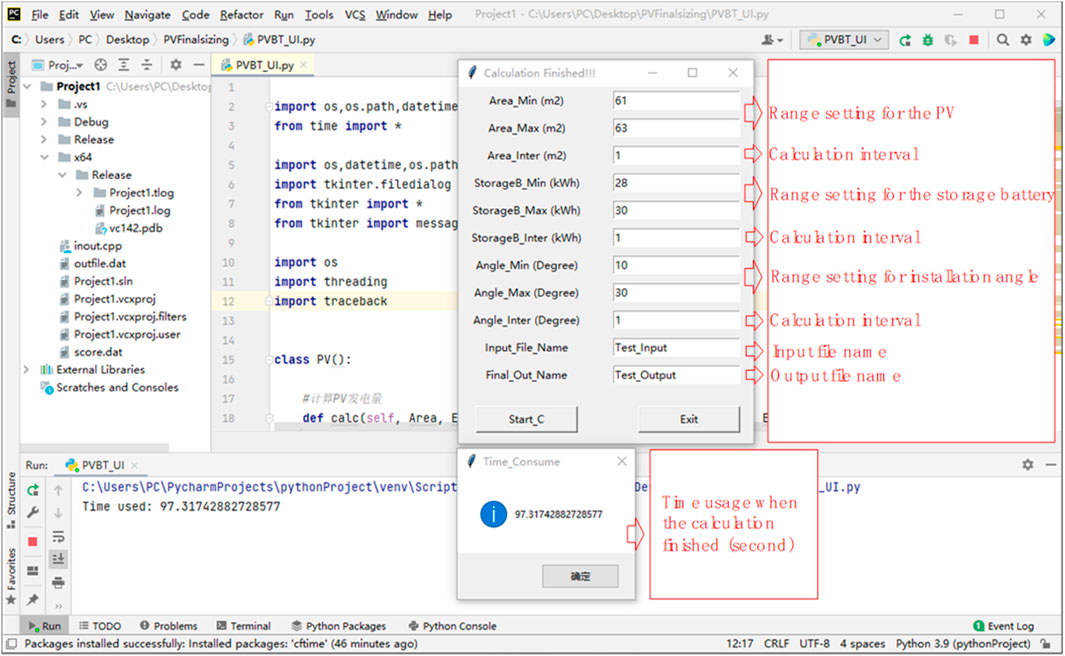
FIGURE 2. User interface of the program and the complier.
Initially, a detached house in Zhouzhi county, Xi’an, China, was selected and modelled based on historical documents and several field surveys, which was used as an example to verify the mathematical model created in this study. Second, to size the PV and storage battery using the proposed algorithm, the hourly energy demand in the house during a year should be predicted. After predicting the hourly energy demand of the house, the size of the PV and storage battery was determined using the traditional and proposed mathematical methods.
Energy performance and economic analyses were conducted for devices that were sized using the traditional and proposed sizing methods. Eventually, the improvement effect of the proposed method was analyzed and concluded.
As the detached house usually located in the suburban or rural area, this study chose a typical detached house in Zhouzhi county in China to validate the mathematical model proposed in this research. Through three field surveys including the measurements and interviewing the local workman of the detached house (Li, 2014), a typical detached house in Zhouzhi county was modeled using DesignBuilder, as shown in Figure 3. This detached house has two floors; the first floor is mainly used for living; even the upper floor also has three bedrooms, the usage of the upper floor is very low because the youth in the family usually went for work in the city and just stayed in the house in the big holidays. Therefore, the energy demand of the first floor was considered as main energy object in this study. To predict the hourly energy demand of the house (first floor) during 1 year, the construction materials and their thermal coefficients (listed in Table 1) were extracted from the thermal design code for civil buildings in China and input into the model (Ministry of construction of People’s Republic of China, 2016). The model was built using DesignBuilder according to the specific characteristics of the materials. Table 2 shows the construction-specific characteristics of the detached house in Zhouzhi. The ventilation rate of the house was referred from the Chinese Indoor Air Quality standard (General Administration of Quality Supervision et al., 2002). The infiltration rate was obtained from (Chen, 2014) and the average measured data was presented in this reference. The specific weather data inputted into the model were extracted from the ASHRAE code (Ashrae, 2010). With these parameters set in the model, the annual hourly energy demand of the detached house was predicted.
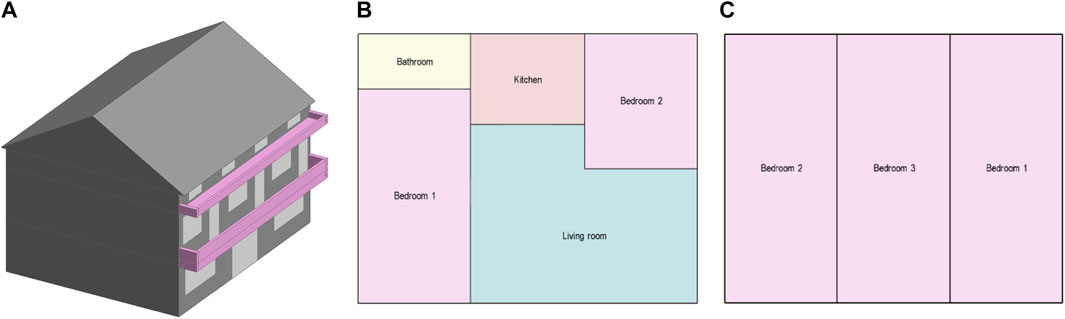
FIGURE 3. Model of the detached house: (A) 3-D model; (B) plan of first floor; (C) plan of second floor.
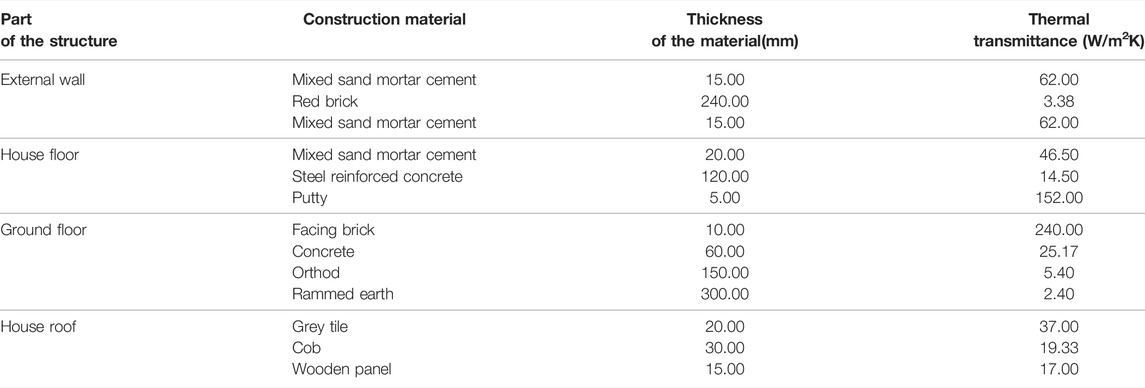
TABLE 1. Materials and their thermal coefficients of the detached house.
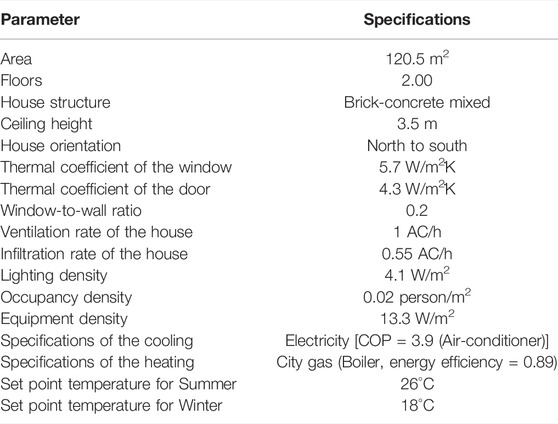
TABLE 2. Specifications of the detached house construction.
As the prediction results of the annual energy demand from the first floor of the house, the heating energy demand is 8,534 kWh; the cooling energy demand is 438 kWh; the lighting energy demand is 1,052 kWh; the hot water energy demand is 1,402 kWh and the energy demand of the equipment is 2,008 kWh. It can be confirmed that the heating energy demand of the detached house is significant owing to the extreme cold weather in winter in the northwest region of China. However, the house’s cooling energy demand in the summer is relatively low because of the relatively cool summer weather in the northwest region of China. The energy demands from other aspects were calculated mainly based on the occupant density of the house, as shown in Table 2.
To conduct this analysis, a mathematical model of the PV system must be developed. In this study, the calculation program for the PV system was modelled based on a previous study by Yoza et al. (2014). Table 3 shows the device specifications of the PV system. The real time electricity production from the PV system can be calculated using Eq. 1, as follows:
where Effcon represents the PV panel electricity conversion efficiency, Numpv is amount of PV panels, Sto represents a single PV panel area, Isk represents the direct solar radiation on the inclined PV panel, and T is the outdoor temperature. According to the traditional method to decide the installation angle of the PV panel, the installation angle can be determined simply by checking the recommended value from the reference, which was 26° for the research area (China energy storage, 2022). Furthermore, the direct solar radiation on the inclined PV panel can be determined through the method created from Erbs (Erbs et al., 1982).
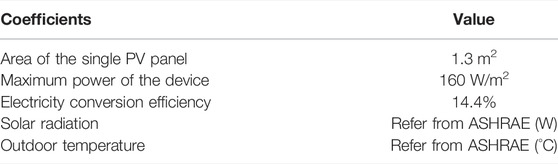
TABLE 3. PV specifications.
Among the different types of storage batteries available in the market, lead-acid batteries were chosen for this research because of their relatively high energy performance and low price. The specific characteristics of the battery selected for this study are organized in Table 4 (Chen et al., 2006).
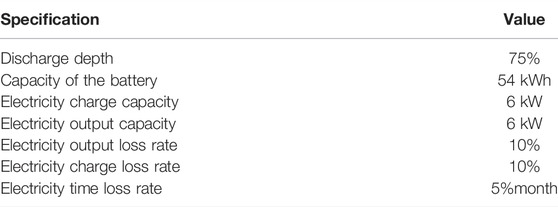
TABLE 4. Specifications of the storage battery.
According to the calculation flowchart of the program shown in Figure 4, appropriate initial size ranges for the PV, storage battery, and PV installation angle were determined based on the traditional method for sizing devices. By inputting the hourly energy demand from the house, the ambient temperature, solar radiation, initial PV size range, storage battery, PV installation angle, calculation interval to the program, and annual, monthly, and hourly calculation results, each device size combination can be obtained. The optimal installation angle of the PV was determined in the angle range for each device size combination based on the minimum demand for electricity from the grid. In summary, this nonlinear program analyses the energy performance of the device size, case by case, from the input size range. When all calculations have been performed, all results are saved in the data output file.
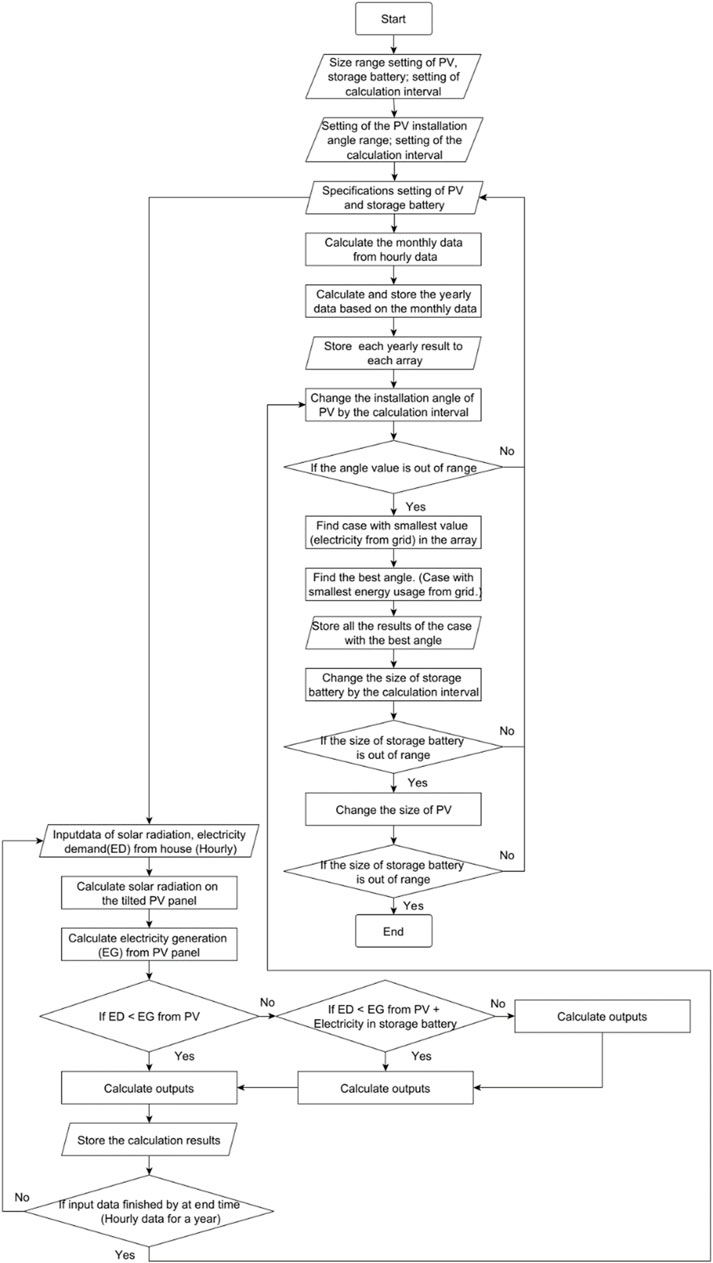
FIGURE 4. Calculation flowchart of the nonlinear program.
In this study, the traditional method was used to determine the initial size range of the PV and storage battery. The effective area available at the house for PV installation was considered to determine the maximum size of the PV. Therefore, the initial maximum size of the PV system was determined as the total area of the south roof of the house. Generally, the traditional method for determining the size of the storage battery is multiplying by 3 and dividing the depth of charge by the average daily load of the house as Equation (Bilgili et al., 2015), because of the fluctuating cooling electricity demand of the house in summer.
Cbt is the capacity of the storage battery determined by the traditional method; 3D_Loadave is the average daily load of the detached house and Depbt is the discharge depth of the storage battery.
Therefore, the initial maximum size of the PV was determined to be 62 m2, and the initial maximum size of the storage battery was determined to be 56 kWh. Based on the initial sizes of the devices, the initial size range of the PV was selected as 30% (19 m2) to 100% (62 m2) of the area of the south roof. Considering the calculation time, the initial size range of the storage battery was determined to be 28 to 56 kWh. According to the recommended PV installation angle for large cities in China, which is 26° (China energy storage, 2022), the range for the PV installation angle was selected as 10–60°. The optimal installation angle was calculated by determining the minimum electricity demand from the grid, as follows:
where AG is the range of the initial PV installation angle, Elmin is the minimum electricity demand from the grid under the specific PV installation angle and Elgrid is the electricity demand from the grid.
The main sizing method for renewable devices comprises creating a nonlinear program to analyze the energy performance of the devices on a case-by-case basis using the size range. First, the traditional method was applied to determine the initial size of the PV and storage battery. Then, reasonable size ranges for the PV and storage battery were determined for initial calculations. Based on the calculation results from the first round, the size range of the PV and storage battery could be narrowed for the second round of calculation. This procedure continues until the user finds the appropriate size of the PV and storage battery for the house. In terms of the recommended installation angle for the representative big cities in China, the range of the PV installation angle is set as 10–60° in the program. As mentioned in Section 2, the hourly electricity demand for the detached house in Zhouzhi county, Xi’an, China, is also inputted into the program. To compare the traditional and proposed methods, the device size was determined through the traditional method and the proposed method, and the hourly and monthly results were obtained based on the energy performance of the devices. Initially, the energy performance of the devices sized though the traditional method was analyzed according to the simulation results, and the hourly results on a representative date in summer are shown in Figure 5. Figure 5A presents the hourly electricity demand, hourly electricity generation from PV and hourly electricity usage from PV and battery; Figure 5B presents the amount of the electricity in the battery. According to this figure, it can be confirmed that the electricity demand for the residential house is mainly in the morning and evening, because residents are typically at work in the daytime. However, PV mainly generates electricity in the daytime, especially at noon, when solar radiation is strongest. Therefore, the storage battery can save the electricity generated from the PV at noon and provide electricity in the morning and evening.
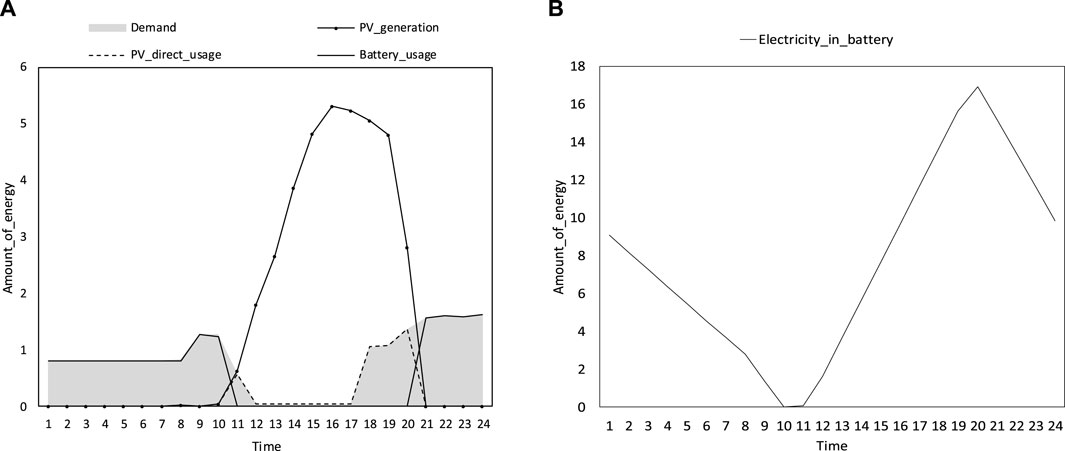
FIGURE 5. Hourly simulation results on 6th August using the traditional method of sizing devices (with 62 m2 area, 26°PV installation angle, and 56 kWh energy of the storage battery): (A) electricity demand, generation, and usage; (B) electricity in battery.
Figure 6 shows the monthly simulation results. From the monthly data, it can be confirmed that the devices can fulfil almost all electricity demand of the house, except for that in December, January, and February. The electricity usage from the storage battery is, on average, 2.7 times more than that from the PV, which means that the storage battery plays a crucial role in this renewable energy system. Furthermore, the electricity generated by the renewable energy system at its current size exceeds the energy demand of the house. Therefore, the size of the devices can be reduced, and by setting an appropriate range for the devices, more suitable size can be selected by running the program several times.
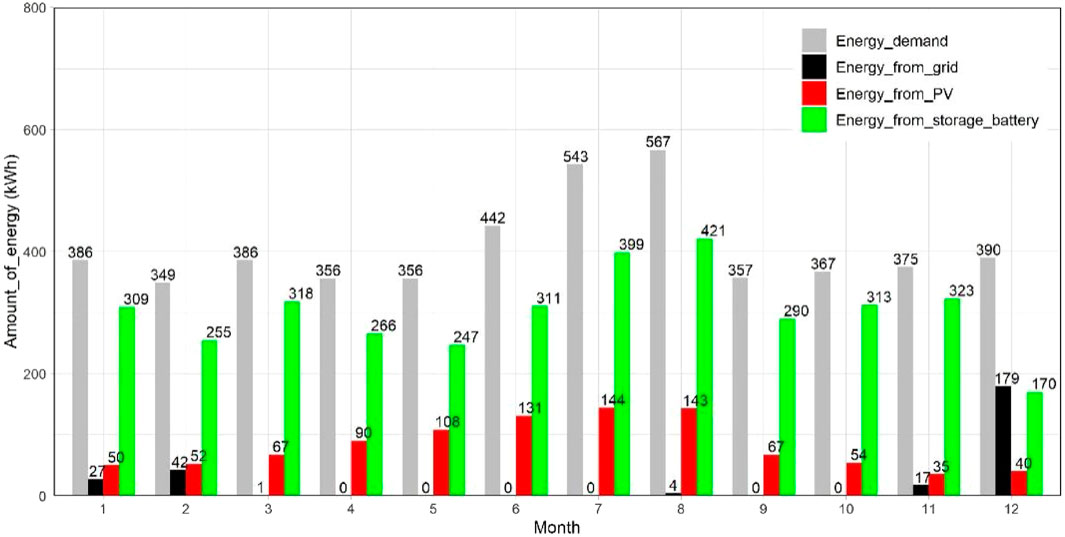
FIGURE 6. Monthly simulation results using the traditional method of sizing devices (with 62 m2 area, 26° PV installation angle, and 56 kWh energy of the storage battery).
As mentioned in Section 3.2, the initial size range of the devices was determined as follows. The area range of the PV is 19–62 m2, capacity range of the storage battery is 28–56 kWh, and installation angle range is 10–60°. The calculation results based on the initial program inputs are shown in Figures 7, 8. Figure 7A shows the demand for electricity from the grid in each case; the data indicate that this demand decreases by only a small amount (0.9–3.6 kWh annually) when the capacity of the storage battery is increased in 1 kWh increments from 28 to 56 kWh, which means that the capacity of the storage battery is large enough for the house in each case. In contrast, the demand for electricity from the grid significantly decreased (50–97 kWh annually) when the PV area was enlarged in 1 m2 increments from 19 to 45 m2. When the PV area was enlarged from 46 to 62 m2, the decrease in the electricity demand was relatively small (13–50 kWh annually). The annual data on energy waste, energy usage from the PV, and energy usage from the storage battery based on the initial program run are shown inFigure 7B–D, respectively; the pattern of the data in these three figures corresponds to the pattern of data shown in Figure 7A. Increasing the capacity of the storage battery does not have a significant impact on the usage of electricity from the PV or the storage battery or on energy waste. The effects of increasing the electricity usage from the PV and storage battery and decreasing the energy waste are relatively significant when the PV area is enlarged from 45 to 62 m2 in 1 m2 increments; under the area range from 19 to 45 m2, the effect is relatively low when the area of the PV is enlarged by 1 m2. The calculated results of the first run can be used to determine the size range of the devices in the second run.
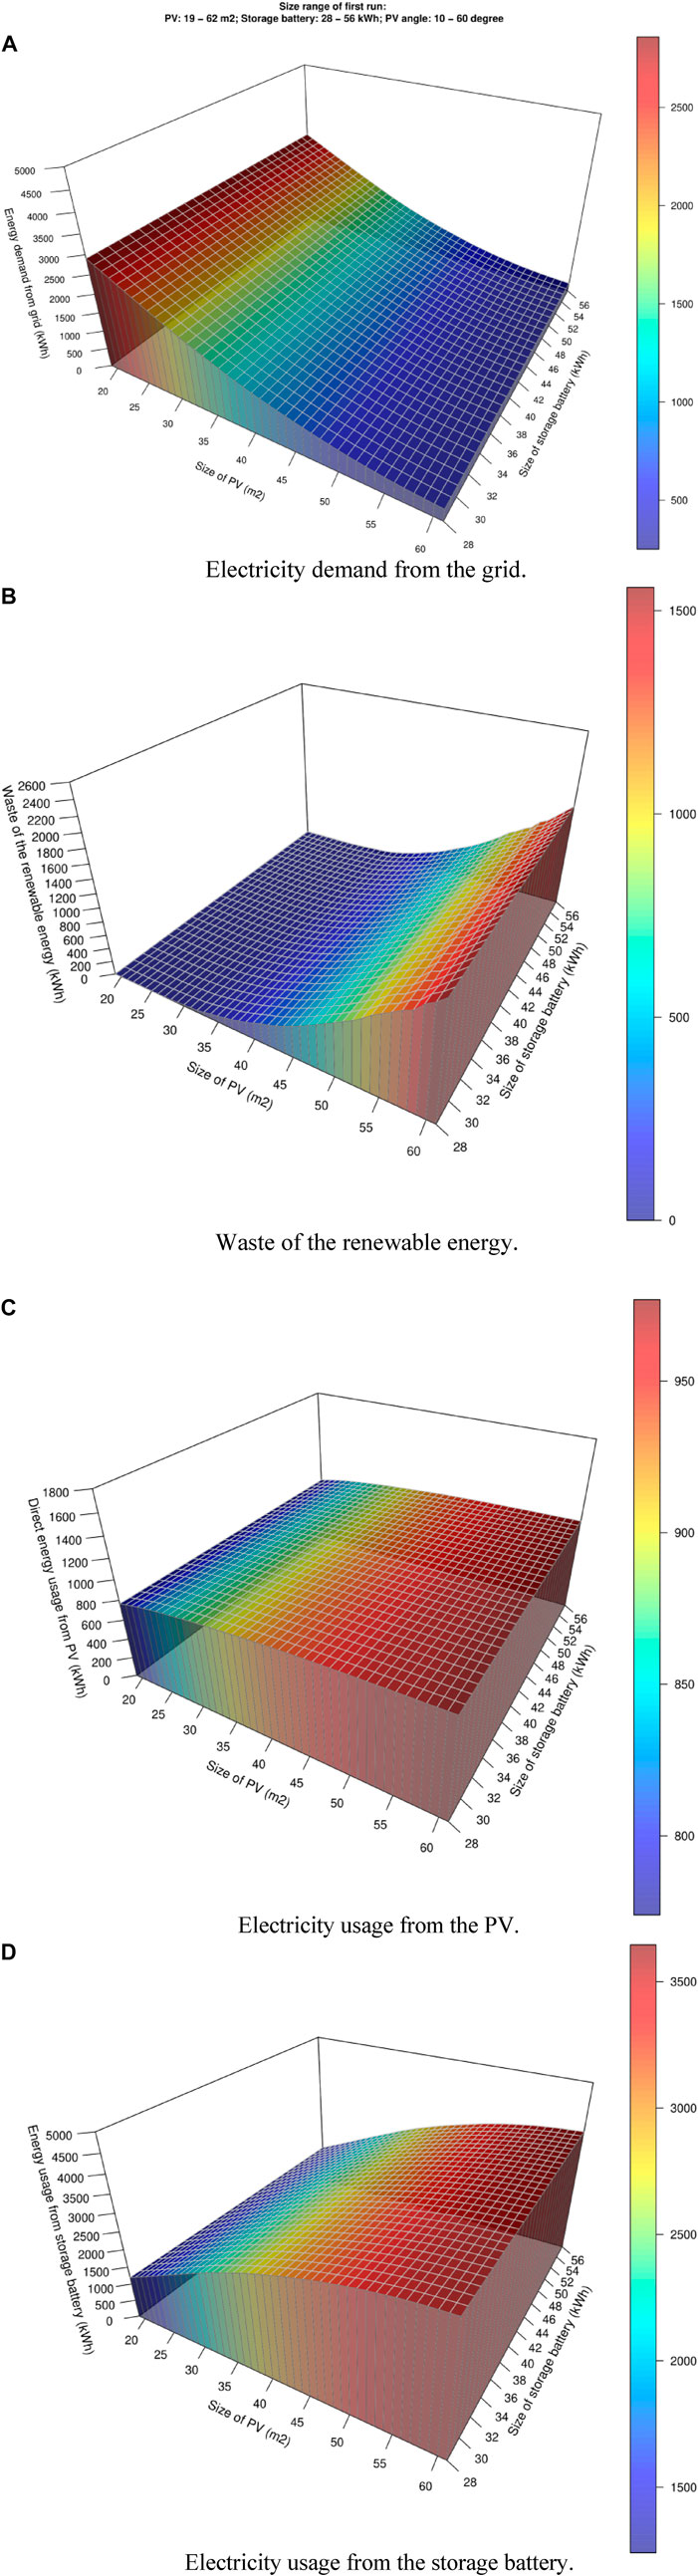
FIGURE 7. Annual simulation results of the first run: (A) electricity demand from the grid; (B) waste of the renewable energy; (C) electricity usage from the PV; (D) electricity usage from storage battery.
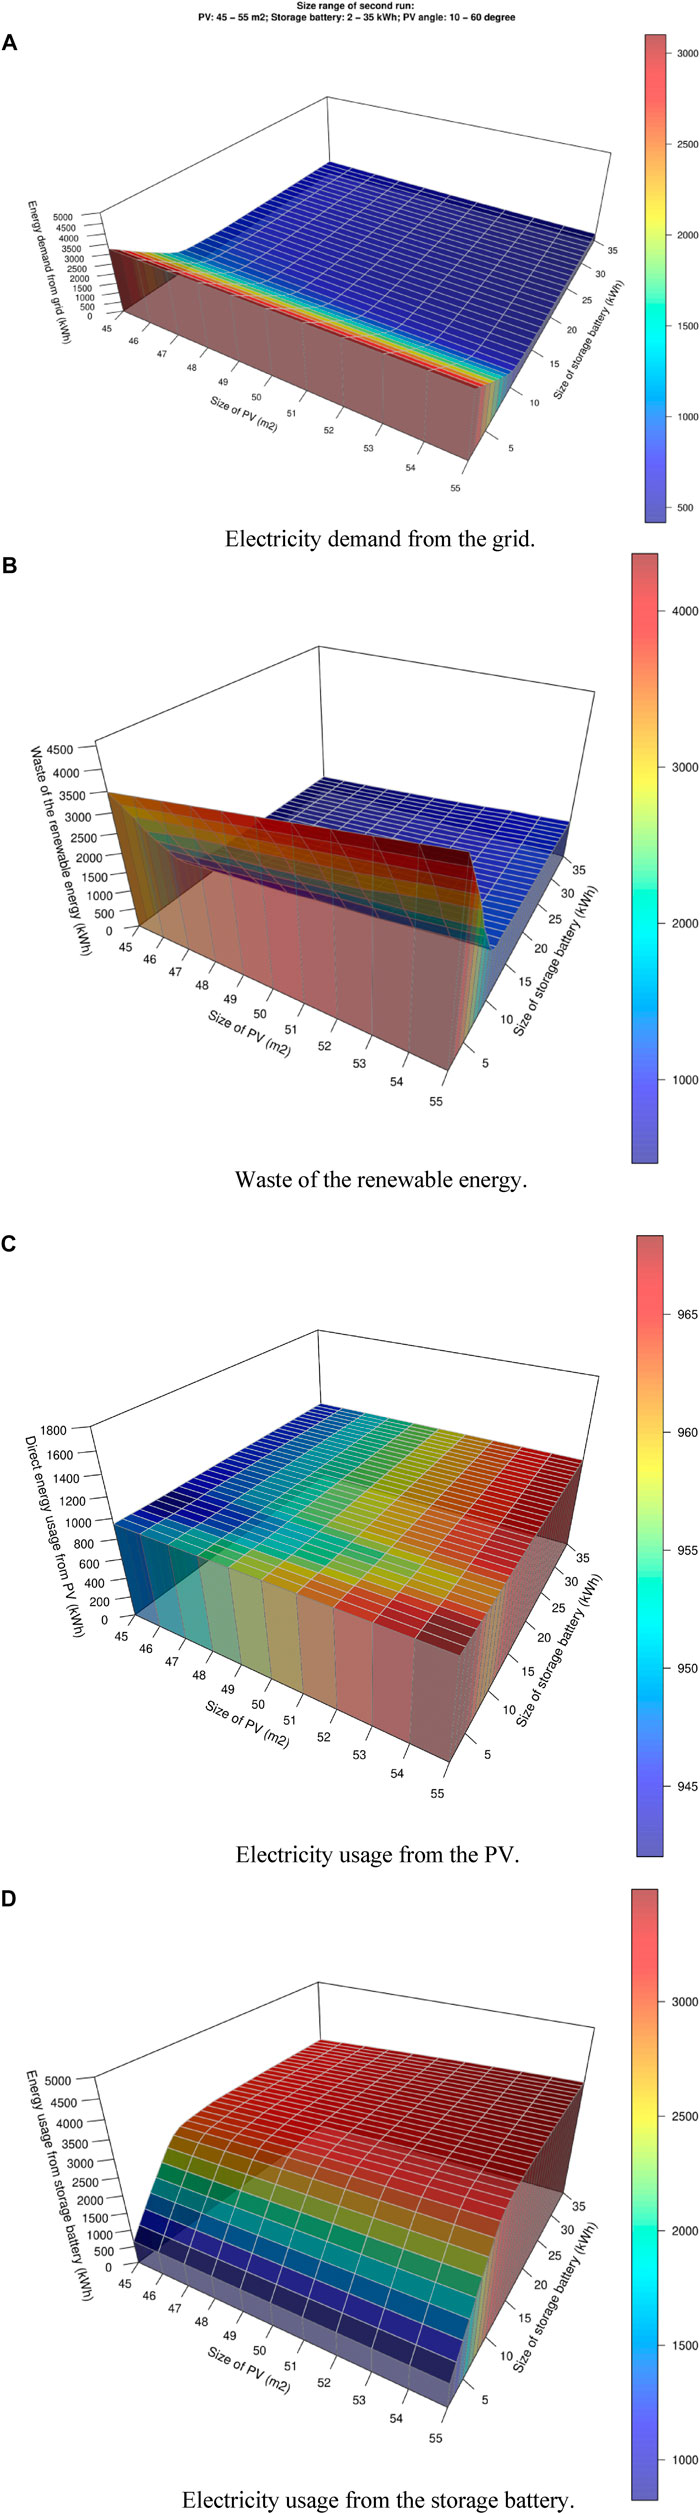
FIGURE 8. Annual simulation results of the second run: (A) electricity demand from the grid; (B) waste of the renewable energy; (C) electricity usage from the PV; (D) electricity usage from storage battery.
Based on the calculated results, the size range of the devices in the second run of the program was determined. Because the demand for electricity from the grid only slightly decreased when the size of the storage battery was enlarged in the first run, the size range of the storage battery in the second run was determined to be 2–35 kWh. However, because the demand for electricity from the grid significantly decreased when the size of the PV increased from 45 m2, this demand only slightly decreased when the size of the PV was enlarged in the range below 45 m2. Therefore, the size range of the PV was determined to be 45–55 m2 in the second program run. The range of the installation angle was determined to be 10–60°, same to that of the first run.
The calculation results of the second run are shown in Figure 8. Figure 8A shows the demand for electricity from the grid for each case, which demonstrates that this demand decreased by a relatively small amount (2–52 kWh annually) when the PV area was enlarged by 1 m2, which means that the size of the PV is sufficiently large for the house. In contrast, the demand for electricity from the grid significantly decreased (70–329 kWh annually) when the storage battery capacity was increased in 1 kWh increments from 2 to 11 kWh; however, the decrease was small (2.7–31 kWh) when the capacity of the storage battery was increased in 1 kWh increments from 13 to 35 kWh. The energy waste, energy usage from the PV, and storage battery in the second run are shown in Figure 8B–D, respectively; the data shown in these three figures corresponds with the data shown in Figure 8A. Enlarging the PV area in the second run does not significantly increase the electricity usage from the PV and storage battery or decrease the electricity waste. The impact is relatively significant when the capacity of the storage battery increases by 1 kWh from 2 to 11 kWh, and the impact is relatively low when the capacity of the storage battery is above 13 kWh. Based on this analysis, the final sizes of the PV and storage battery were determined to be 45 m2 and 12 kWh, respectively. The answer is not unique, and users can choose the size of the devices based on their energy analysis results, financial situation, and so on.
The mathematical model in this study calculates the optimal PV installation angle for each device size combination. For instance, a PV with an area of 45 m2 and a 12 kWh storage battery were selected as the suitable options in this study, and the optimal installation angle of the PV with the selected device sizes was 46°. If the resident chooses another device size combination, the optimal installation angle can also be obtained from the calculation results. Figure 9 shows the optimal installation angle for each case in the second run.
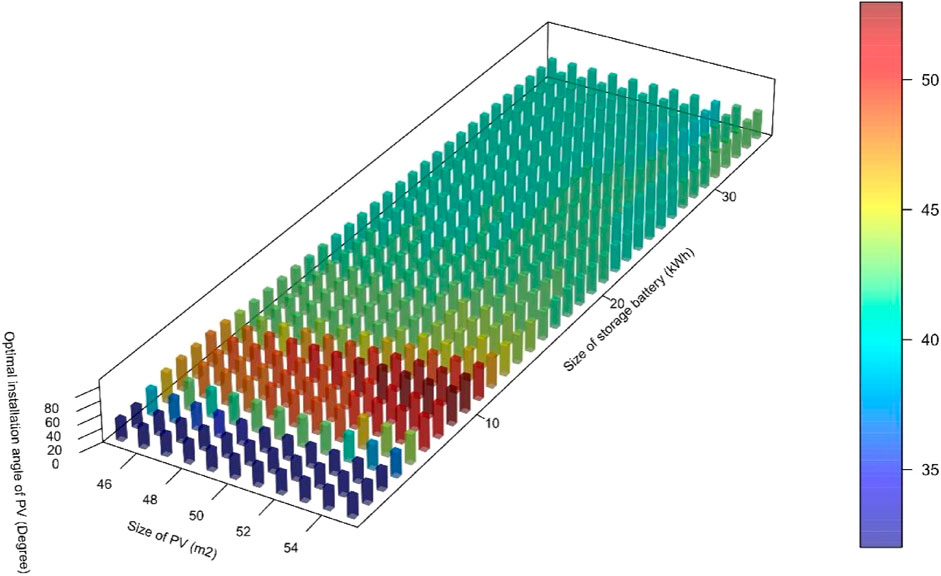
FIGURE 9. Optimal PV installation angle for each case in the second run.
In this section, the traditional and proposed methods for sizing devices are compared. First, the energy performance at the calculated optimal (46°) and recommended PV installation angles (26°) was compared using the traditional device sizing method (62 m2 PV and a 56 kWh storage battery). The annual demand for electricity from the grid of the device with the optimal installation angle was 230 kWh, and that for the recommended installation angle was 270 kWh. Therefore, the energy demand from the grid was relatively reduced with the optimal installation angle. Second, the energy performance of the devices sized using the traditional and proposed methods was compared, as shown in Figure 10. The device sizes for each sizing method are listed in Table 5. Results show that the devices sized using the traditional sizing method can reduce the grid electricity demand from 4,900 to 270 kWh, and those sized using the proposed method can reduce the grid electricity demand from 4,900 to 955 kWh. The devices under each method significantly reduce the electricity demand from the grid. However, the annual electricity demand from the grid is only reduced by 2–32 kWh when the PV area is increased in 1 m2 increment or the capacity of the storage battery is increased in 1 kWh increments, beginning from a 45 m2 PV area or 12 kWh storage battery capacity. Therefore, the device sizes can be significantly reduced without creating a large increase in the energy demand from the grid. Hence, using the nonlinear program developed in this study, more suitable device size and the optimal PV installation angle can be determined.
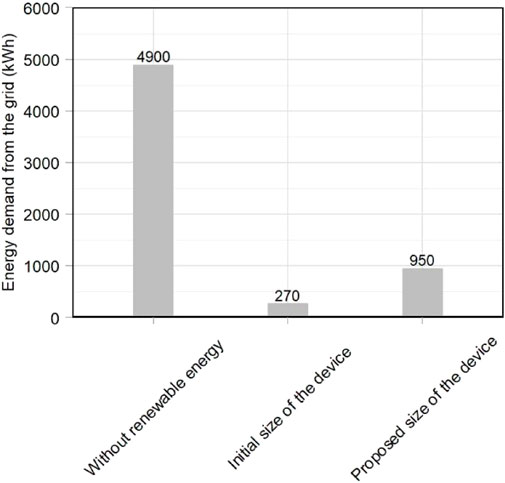
FIGURE 10. Energy demand from the grid under each method for sizing the device.
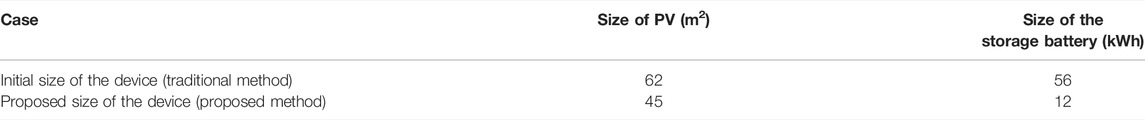
TABLE 5. Device size under the two different sizing methods.
The economic analysis of the proposed method was conducted using the unit prices of the PV, storage battery, and electricity from the grid. In China, the market unit price of a PV is 2.1 Yuan/W (DongTong, 2021010), unit price of a lead-acid storage battery is 600 Yuan/kWh (Zhang et al., 2021), and price of grid electricity is 0.5 Yuan/kWh (State Grid, 2021). If the traditional method is utilized to size renewable energy devices, the PV and storage battery can fulfil 4,930 kWh/year of electricity demand from the grid, which also means it can save 2054 Yuan/year. The total price of the PV and storage battery is 54432 Yuan, and the payback period is 22.6 years. Following the same calculation method, the price of the solar device is 22320 Yuan and the payback period is 10.8 years according to the proposed method of sizing the device. Therefore, although the electricity demand from the grid with devices sized using the proposed method mildly increased relative to the demand with devices sized using the traditional method, the price of the renewable device decreased from 54432 to 22320 Yuan, and the payback period decreased from 22.6 to 10.8 years. Therefore, the proposed method significantly optimizes the size of the PV and storage battery.
According to the economic analysis above, even when using the proposed method to size the device, the payback period is 10.6 years, which is still long. One of the reasons is that even China has made a big progressive on economic condition within recent 30 years, the gap between rich and poor is clearly existing, which makes the extremely low price of grid electricity in China (0.5 Yuan/kWh (0.08 dollar/kWh). Therefore, from a policy perspective, the low price of grid electricity could be one reason that might discourage the installation of renewable energy devices in Chinese homes.
The traditional method of sizing the PV and storage battery for a house is to approximately estimate the size based on the average daily energy demand and the usable area at the house for installing the PV. In this study, an enumeration algorithm (nonlinear program) was designed to more precisely size renewable energy devices according to the hourly energy demand of the house. A detached house in Zhouzhi county, Xi’an, China, was selected to test the proposed mathematical model. To obtain the appropriate device size, the program was run twice according to different size range of the devices in this study. The specific conclusions are summarized below.
1) The first run of the program required 2 h and 13 min, and the second run used 56 min on an Intel i7-8 CPU. Therefore, the appropriate size of the PV and storage battery can be determined within a reasonable timeframe.
2) The mathematical model calculates each case from a large PV installation angle range, and this program can determine the optimal PV installation angle based on the predicted hourly energy demand of the house. According to the case in this research, the installation angle of the PV was changed from 26 to 46°, which can annually save 40 kWh of electricity from the grid.
3) In the case selected for this study (a detached house in Zhouzhi county, Xi’an, China), the device sized using the traditional method can reduce the grid electricity demand from 4,900 to 270 kWh. However, the grid electricity demand can be reduced from 4,900 to 950 kWh with the device sized using the proposed method. Although the demand for electricity from the grid is relatively higher with the device sized using the proposed method versus the traditional method, the proposed sizing method is still optimal due to two reasons. First, enlarging the PV area from 45 m2 or the storage battery capacity from 12 kWh does not significantly increase the electricity usage from the PV and storage battery, decrease the electricity usage from grid or the electricity waste. Second, the price of the device was reduced from 54432 to 22320 Yuan, and the payback period decreased from 20.6 to 10.8 years through the proposed method. In summary, the proposed method can provide valuable instructions for sizing the PV and storage battery for houses.
4 Although the payback period was significantly reduced using the proposed method to size the device, the payback period was still 10.6 years. One reason could be the low grid electricity price (0.5 Yuan/kWh), which could also discourage residents in China from installing renewable energy devices in their houses.
The limit calculation interval is 1 in the current program and it can only use for the system size selection for a single house. The calculation will be larger if the calculation interval is more precise or using the program to plan the renewable energy for several houses in a block. Thus, this could be an NP-Hard problem if the calculation becomes much larger. Therefore, the optimization algorithms or machine learning methods will be applied to solve the NP-Hard problem in the future.
The original contributions presented in the study are included in the article/Supplementary Material, further inquiries can be directed to the corresponding authors.
HC conceived and completed this paper. F-LJ supported the writing and the review of this paper. Y-LH and L-QC supported the software utilization. Y-JY, L-QC, and T-YL supported the program coding. C-LW, B-QZ, and C-YH supported the building modelling.
This work was supported by the National Natural Science Foundation of China (52178057, 12090021, 61872224), the Department of Science and Technology in Shaanxi Province (2022GY-330), the Federation of Social Science in Shaanxi Province (2021HZ1058), and the Key Scientific Research Projects of Colleges and Universities in Henan Province (22B560020).
The authors declare that the research was conducted in the absence of any commercial or financial relationships that could be construed as a potential conflict of interest.
All claims expressed in this article are solely those of the authors and do not necessarily represent those of their affiliated organizations, or those of the publisher, the editors and the reviewers. Any product that may be evaluated in this article, or claim that may be made by its manufacturer, is not guaranteed or endorsed by the publisher.
AG, Range of the initial PV installation angle; Cbt, Capacity of the storage battery determined by traditional method; Depbt, Discharge depth of the storage battery; D_Loadave, Average daily load of the detached house; Elgrid, Electricity demand from the grid; Elmin, Minimum electricity demand from the grid under the specific PV installation angle; Effcon, PV panel electricity conversion efficiency; Isk, Direct solar radiation; Numpv, Amount of PV panels; P, Power generated from PV; PV, Photovoltaic; Sto, A single PV panel area; T, Outdoor temperature.
Ahmadi, S., and Abdi, S. (2016). Application of the Hybrid Big Bang-Big Crunch Algorithm for Optimal Sizing of a Stand-Alone Hybrid PV/wind/battery System. Sol. Energy 134, 366–374. doi:10.1016/j.solener.2016.05.019
Akram, U., Khalid, M., and Shafiq, S. (2018). Optimal Sizing of a Wind/solar/battery Hybrid Grid‐connected Microgrid System. IET Renew. Power Gener. 12 (1), 72–80. doi:10.1049/iet-rpg.2017.0010
Argyrou, M. C., Marouchos, C. C., Kalogirou, S. A., and Christodoulides, P. (2021). A Novel Power Management Algorithm for a Residential Grid-Connected PV System with Battery-Supercapacitor Storage for Increased Self-Consumption and Self-Sufficiency. Energy Convers. Manag. 246, 114671. doi:10.1016/j.enconman.2021.114671
Argyrou, M. C., Marouchos, C. C., Kalogirou, S. A., and Christodoulides, P. (2021). Modeling a Residential Grid-Connected PV System with Battery-Supercapacitor Storage: Control Design and Stability Analysis. Energy Rep. 7, 4988–5002. doi:10.1016/j.egyr.2021.08.001
Ashok, S. (2007). Optimised Model for Community-Based Hybrid Energy System. Renew. Energy 32 (7), 1155–1164. doi:10.1016/j.renene.2006.04.008
ASHRAE (2010). “Energy Efficient Design for Low-Rise Residential Buildings,” in American Society of Heating, Refrigeration, and Air-Conditioning Engineers (Atlanta: ASHRAE. ASHRAE Standard), 90, 2.
Atia, R., and Yamada, N. (2016). Sizing and Analysis of Renewable Energy and Battery Systems in Residential Microgrids. IEEE Trans. Smart Grid 7 (3), 1204–1213. doi:10.1109/TSG.2016.2519541
Bilgili, M., Ozbek, A., Sahin, B., and Kahraman, A. (2015). An Overview of Renewable Electric Power Capacity and Progress in New Technologies in the World. Renew. Sustain. Energy Rev. 49, 323–334. doi:10.1016/j.rser.2015.04.148
Borowy, B. S., and Salameh, Z. M. (1994). Optimum Photovoltaic Array Size for a Hybrid Wind/PV System. IEEE Trans. energy Convers. 9 (3), 482–488. doi:10.1109/60.326466
Chen, D. L. (2014). Theoretical Analysis and Testing Practice Based on Airtightness of Low-Energy Buildings in Hot Summer and Cold Winter Regions. Constr. S&T (18), 71–73. doi:10.16116/j.cnki.jskj.2014.18.052
Chen, W., Shen, H., and Deng, Y. J. (2006). Appling Research of Storage Batteries in Photovoltaic System. Sto Battery 1, 21–27. Available at: http://qikan.cqvip.com/Qikan/Article/Detail?id=21785266&from=Qikan_Search_Index.
China Building Energy Consumption Annual Report 2020 (2021). Build. Energy Effic. 49 (02), 1–6. doi:10.3969/j.issn.2096-9422.2021.02.001
China energy storage (2022). OL. Best Angle of PV. Available at: http://www.escn.com.cn/news/show-442615.html (Accessed December 26, 2020).
DongTong, Z. (2021). Centralized PV Market Remains Sluggish. China E News. doi:10.28693/n.cnki.nshca.2021.002406
Ekren, O., and Ekren, B. Y. (2008). Size Optimization of a PV/wind Hybrid Energy Conversion System with Battery Storage Using Response Surface Methodology. Appl. Energy 85 (11), 1086–1101. doi:10.1016/j.apenergy.2008.02.016
Erbs, D. G., Klein, S. A., and Duffie, J. A. (1982). Estimation of the Diffuse Radiation Fraction for Hourly, Daily and Monthly-Average Global Radiation. Sol. Energy 28, 293–302. doi:10.1016/0038-092X(82)90302-4
General Administration of Quality Supervision, Inspection and Quarantine, Ministry of Health, State Environmental Protection Administration (2002). Indoor Air Quality standard:GB/T 18883.
Kaldellis, J. K., Zafirakis, D., and Kondili, E. (2010). Optimum Sizing of Photovoltaic-Energy Storage Systems for Autonomous Small Islands. Int. J. Electr. Power & Energy Syst. 32 (1), 24–36. doi:10.1016/j.ijepes.2009.06.013
Lai, C. S., and McCulloch, M. D. (2017). Sizing of Stand-Alone Solar PV and Storage System with Anaerobic Digestion Biogas Power Plants. IEEE Trans. Ind. Electron. 64 (3), 2112–2121. doi:10.1109/TIE.2016.2625781
Li, Y. (2014). Study on Heating Pattern of Rural Residences. Doctoral Dissertation from Department of Architectural Design and Theory of Xi'an University of Architecture and Technology.
Lin Xu, L., Xinbo Ruan, X. B., Chengxiong Mao, C. X., Buhan, Z., and Yi, L. (2013). An Improved Optimal Sizing Method for Wind-Solar-Battery Hybrid Power System. IEEE Trans. Sustain. Energy 4 (3), 774–785. doi:10.1109/TSTE.2012.2228509
Maleki, A., and Askarzadeh, A. (2014). Optimal Sizing of a PV/wind/diesel System with Battery Storage for Electrification to an Off-Grid Remote Region: A Case Study of Rafsanjan, Iran. Sustain. Energy Technol. Assessments 7, 147–153. doi:10.1016/j.seta.2014.04.005
Ministry of construction of People's Republic of China (2016). Thermal Design Code for Civil Building. China Planning Press.
Ogunjuyigbe, A. S. O., Ayodele, T. R., and Akinola, O. A. (2016). Optimal Allocation and Sizing of PV/Wind/Split-diesel/Battery Hybrid Energy System for Minimizing Life Cycle Cost, Carbon Emission and Dump Energy of Remote Residential Building. Appl. Energy 171, 153–171. doi:10.1016/j.apenergy.2016.03.051
Singh, G., Baredar, P., Singh, A., and Kurup, D. (2017). Optimal Sizing and Location of PV, Wind and Battery Storage for Electrification to an Island: A Case Study of Kavaratti, Lakshadweep. J. Energy Storage 12, 78–86. doi:10.1016/j.est.2017.04.003
State Grid (2021). State Grid State Grid Shaanxi Province Electric Power Co. OL. Price of the Grid Electricity. Available at: http://www.sn.sgcc.com.cn/html/main/col2810/column_2810_1.html.
Yang, P., and Nehorai, A. (2014). Joint Optimization of Hybrid Energy Storage and Generation Capacity with Renewable Energy. IEEE Trans. Smart Grid 5 (4), 1566–1574. doi:10.1109/TSG.2014.2313724
Yoza, A., Yona, A., Senjyu, T., and Funabashi, T. (2014). Optimal Capacity and Expansion Planning Methodology of PV and Battery in Smart House. Renew. Energy 69, 25–33. doi:10.1016/j.renene.2014.03.030
Keywords: PV, storage battery, sizing method, mathematical model, energy demand
Citation: Chang H, Jing F-L, Hou Y-L, Chen L-Q, Yang Y-J, Liu T-Y, Wei C-L, Zhai B-Q and Hou C-Y (2022) Development of a Mathematical Model to Size the Photovoltaic and Storage Battery Based on the Energy Demand Pattern of the House. Front. Energy Res. 10:945180. doi: 10.3389/fenrg.2022.945180
Received: 16 May 2022; Accepted: 16 June 2022;
Published: 13 July 2022.
Edited by:
Adrian Ilinca, Université du Québec à Rimouski, CanadaReviewed by:
Andrea Frattolillo, University of Cagliari, ItalyCopyright © 2022 Chang, Jing, Hou, Chen, Yang, Liu, Wei, Zhai and Hou. This is an open-access article distributed under the terms of the Creative Commons Attribution License (CC BY). The use, distribution or reproduction in other forums is permitted, provided the original author(s) and the copyright owner(s) are credited and that the original publication in this journal is cited, in accordance with accepted academic practice. No use, distribution or reproduction is permitted which does not comply with these terms.
*Correspondence: Yao-Long Hou, aHlsenp0bEAxNjMuY29t; Bin-Qing Zhai, cmVzZWFyY2hnZWVrQHNpbmEuY29t
Disclaimer: All claims expressed in this article are solely those of the authors and do not necessarily represent those of their affiliated organizations, or those of the publisher, the editors and the reviewers. Any product that may be evaluated in this article or claim that may be made by its manufacturer is not guaranteed or endorsed by the publisher.
Research integrity at Frontiers
Learn more about the work of our research integrity team to safeguard the quality of each article we publish.