 Ling Chen
 Feng Lin
94% of researchers rate our articles as excellent or good
Learn more about the work of our research integrity team to safeguard the quality of each article we publish.
Find out more
BRIEF RESEARCH REPORT article
Front. Energy Res., 17 August 2022
Sec. Smart Grids
Volume 10 - 2022 | https://doi.org/10.3389/fenrg.2022.942408
This article is part of the Research TopicCondition Monitoring for Renewable Energy Systems, Volume IIView all 20 articles
Porcelain insulators play a vital role for the safety and stability operations of electric systems. In a strong electric field, these insulators easily break down and become zero resistance insulators, which impacts the safety and stability operations of an electric system. As a result, a three-dimensional zero resistance insulator model is set up based on COMSOL. To proceed, first, we studied the voltage and current density law of insulator string when ambient relative humidity, pollution degree, and pollution salt composition are different. Then, the insulator infrared detection test is carried out in an artificial fog chamber. Results showed that the zero resistance insulator has the greatest influence on voltage when it is at a high voltage terminal, and it has the least influence on voltage when it is in the middle position. As the relative range between non-adjacent insulators and zero resistance insulators increases, the implications for a zero resistance insulator on adjacent position insulators will decrease continuously. Farther is the range between different positions on the insulators and the center axis of rotation and lower is the current density and temperature rise. The overall temperature rise of the insulator string gradually increases due to the increase in the relative humidity and pollution degree of the environment. Finally, the results indicate that the temperature difference between zero resistance insulators and other insulators gradually increases and can provide support for the infrared detection of zero resistance insulators.
Insulation and mechanical properties of porcelain insulators decline and deteriorate due to long-term operations in the outdoor environment, which contains mechanical and electrical loads, air pollution, cold and heat changes, and other effects. Under the action of a strong electric field, insulators are easily broken down and then transform into zero resistance insulators, which will lead to disconnection accidents and impact the safety and stability operation of the electric system (Liu et al., 2018; Yuan et al., 2018).
Zhang et al. (2018) studied the implications of humidity on the deterioration string with zero resistance through experiments. It shows that the voltage of the contaminated insulator string is greatly influenced by humidity. Humidity raise will reduce the asymmetry of the insulator string’s voltage which is beneficial for the detection of zero resistance insulators. However, it is not conducive to detection while the humidity is overly high, which will easily lead to misjudgment. Xu et al. (2011) proposed a modeling simplification and calculation optimization scheme based on the electric field type, unit, area, and other factors by calculating the electric field distribution of 110 kV porcelain pillar insulators under different surface states, such as pollution and ice coating. Ilha et al. (2015) and Ilha et al. (2012) used graphite powder and epoxy resin to simulate the potential distribution of insulator strings with different pollution conductivities. By combining the experimental data with the numerical results, it is found that a small contamination conductivity would change the potential and electric field of an insulator string.
Chen et al. (2015) carried out the infrared temperature measurement test. Based on this fact, the zero resistance insulator is located in different positions of the insulator string, and a comparison between the filthy insulator string and the clean condition is established. The experimental results show that the thermal image has obvious changes while the insulator string is polluted and then results in zero resistance insulators. Therefore, a high-precision infrared thermal imager can be used to identify zero resistance insulators and polluted insulators in string. The test (Reddy & Nagabhushana 2003) of damp contaminated porcelain insulator string shows that the heating condition of porcelain surface, steel cap, and iron foot is different. Three cases of the iron foot, porcelain surface, and steel cap will cause a high-to-low temperature rise. According to the electromagnetic field and heat transfer theory, Vitelli et al. (2000) using Maxwell and heat transfer equation solved the surface heat distribution of porcelain insulators.
The previous research studies lack comprehensive consideration of the implications for ambient relative humidity, fouling degree, and fouling salt composition on the infrared detection of zero resistance insulators. Therefore, the zero resistance insulator model is set up for a more complex infrared detection environment. The effects of relative humidity and pollution on voltage and potential distribution of insulators were studied. At the same time, the infrared imaging method was used to study the heat characteristics of an insulator surface in an artificial fog chamber. The conclusion can provide further support for the research of the zero resistance insulator detection technology.
The standard porcelain suspension insulators used for 110 kV line are taken as emulation objects to conduct full-scale modeling, and a simplified two-dimensional axisymmetric model of porcelain insulators is established, as shown in Figure 1.
FIGURE 1. Two-dimensional axisymmetric section of insulators.
Table 1 shows the material properties of the relative permittivity and conductivity of density of each insulator’s part. In the emulation calculation, the applied voltage of the high end of the insulator string is 63.5 kV, the applied voltage of the low end is 0 kV, and the frequency domain is 50 Hz.

TABLE 1. Various material properties.
The calculation formula used to convert the equivalent relation between the conductivity value of the dirty layer on the insulator surface at saturation and wetting and the salt density and gray density on the surface cover is defined by Yuan (2008). The conductivity of the dirty layer can be obtained through the conversion relationship between the experimental results obtained in Mei et al. (2014) and the conditions of different salt types and relative humidity[12–17].
The insulators are numbered by positions 1–7 from the high voltage terminal to the grounding end, while the 2-nd, 4-th, and 7-th are selected as zero resistance insulators in the emulation calculation.
The 2-th insulators are selected as zero resistance insulators with the pollution of NaCl(0.1 mg/cm2). Figure 2 and Figure 3 show the emulation calculation results of voltage and current density of polluted insulator string, while the ambient relative humidity gradually rises, respectively. As the environment's relative humidity raises from 0% to 100%, the voltage of each other insulators tends to be equal, while the pollution condition of the zero resistance insulator string is constant. Meanwhile, the current density also changes with the change in ambient humidity. As the relative humidity value raises gradually, the current density value of each position in the insulator string also raises gradually.
FIGURE 2. Voltage of 2-th zero resistance insulator string as humidity raises (V). (A) Dry filth, (B) humidity of 70%, (C) humidity of 75%, (D) humidity of 80%, and (E) humidity of 100%.
FIGURE 3. Current density of 2-th zero resistance insulator string as humidity increases (A/m2). (A) Dry filth, (B) humidity of 70%, (C) humidity of 75%, (D) humidity of 80%, and (E) humidity of 100%.
Figure 4 shows the voltage of the insulator string that presents an obvious uniform distribution as the pollution changes from dry to 100% ambient relative humidity, which indicates that the dirty layer conductivity gradually becomes the dominant factor of the dirty insulator string voltage. Ilha et al. (2015) and Ilha et al. (2012) found that the surface voltage would not change, while the conductivity of the polluted layer is greater than the critical value 5 μs cm−1. The dirty layer’s conductivity is 0.22 μs cm−1, while the relative humidity is 70%. The voltage is unevenly distributed. The conductivity of the polluted layer is 23 μs cm−1, while the relative humidity reaches 100%. Figure 5 shows that the maximum current density raises significantly while the pollution changes from dry to the ambient relative humidity reaching 100%. Under the same pollution degree conditions, the conductivity of the surface pollution layer will increase exponentially with the rise in relative humidity, which will cause the current density at each position in the insulator string to raise nonlinearly with the raise of ambient relative humidity.
FIGURE 4. Implications for the environmental relative humidity on voltage.
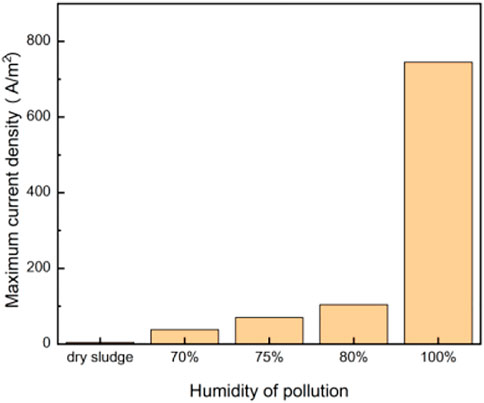
FIGURE 5. Implications for the environmental relative humidity on the maximum current density.
The 7-th insulators are selected as zero resistance insulators. The pollution-containing salt types include only NaCl, mixed salt (40% NaCl and 60% CaSO4) and only CaSO4 under the case of an 80% environment relative humidity. Figure 6, Figure 7, and Figure 8 show the emulation calculation results of the voltage of insulator string under a pollution degree of 0 mg/cm2, 0.05 mg/cm2, 0.1 mg/cm2, and 0.2 mg/cm2. The voltage tends to be uniform with the raise of the pollution degree, while the pollution types are NaCl and mixed salt (NaCl and CaSO4) while the voltage will not change where the pollution layer is only CaSO4.
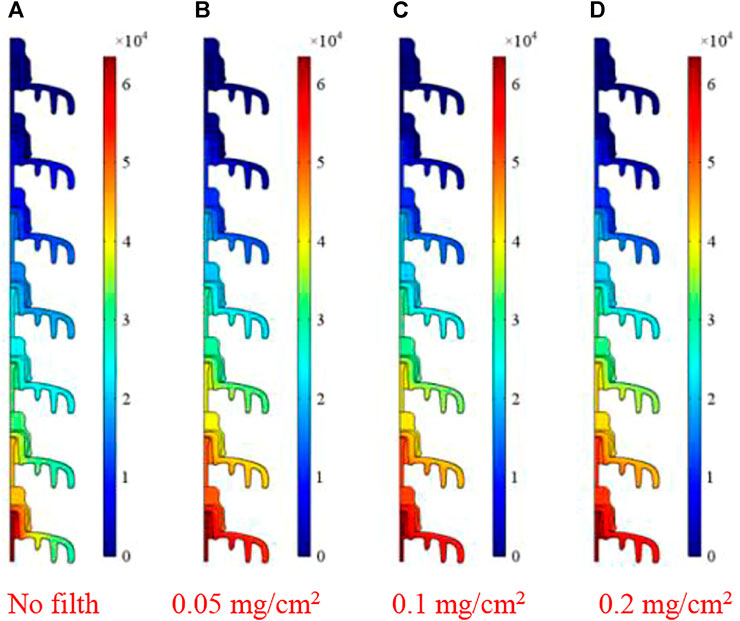
FIGURE 6. Voltage under different pollution degrees (case of NaCl). (A) No filth, (B) 0.05 mg/cm2, (C) 0.1 mg/cm2, and (D) 0.2 mg/cm2.
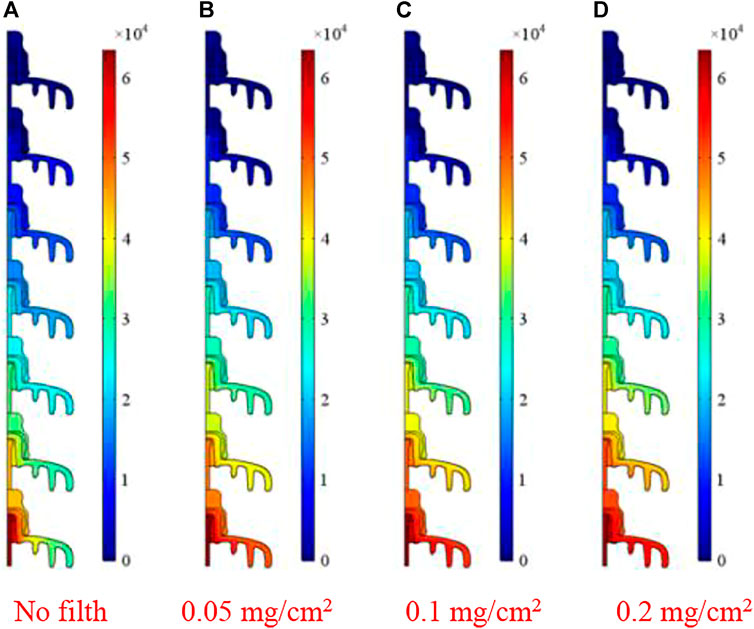
FIGURE 7. Voltage under different pollution degrees (case of salt-mixture). (A) No filth, (B) 0.05 mg/cm2, (C) 0.1 mg/cm2, and (D) 0.2 mg/cm2.
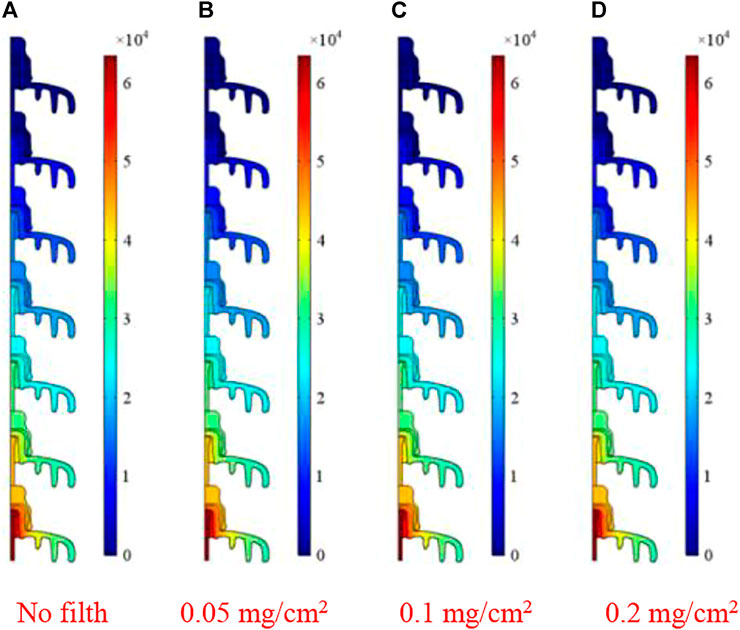
FIGURE 8. Voltage under different pollution degrees (case of CaSO4). (A) No filth, (B) 0.05 mg/cm2, (C) 0.1 mg/cm2, and (D) 0.2 mg/cm2.
Figure 9 shows the insulator string’s voltage. The insulator surface pollution is NaCl, mixed salt (40%NaCl and 60% CaSO4), and CaSO4. The surface pollution of insulators is 0.05 mg/cm2, 0.1 mg/cm2, and 0.2 mg/cm2, respectively. The voltage in the insulator string except the set zero resistance insulator tends to be uniform with the raise of the pollution degree under cases of the pollution of NaCl and mixed salt. Figure 9A shows that the partial voltage of non-zero resistance insulators is about 10580 V, while the pollution degree is 0.2 mg/cm2, which is similar to the result shown in Figure 9B. The voltage is even in this condition. The reason is that the pollution layer’s conductivity on the insulator surface is slightly greater than the critical value (5 μs cm−1), while the pollution degree is 0.2 mg/cm2; this results in the pollution layer’s conductivity can no longer impact the voltage of the insulator string. Figure 9C shows that the voltage is not uniform and will not change with the change of the surface pollution degree under cases of the pollution of CaSO4.
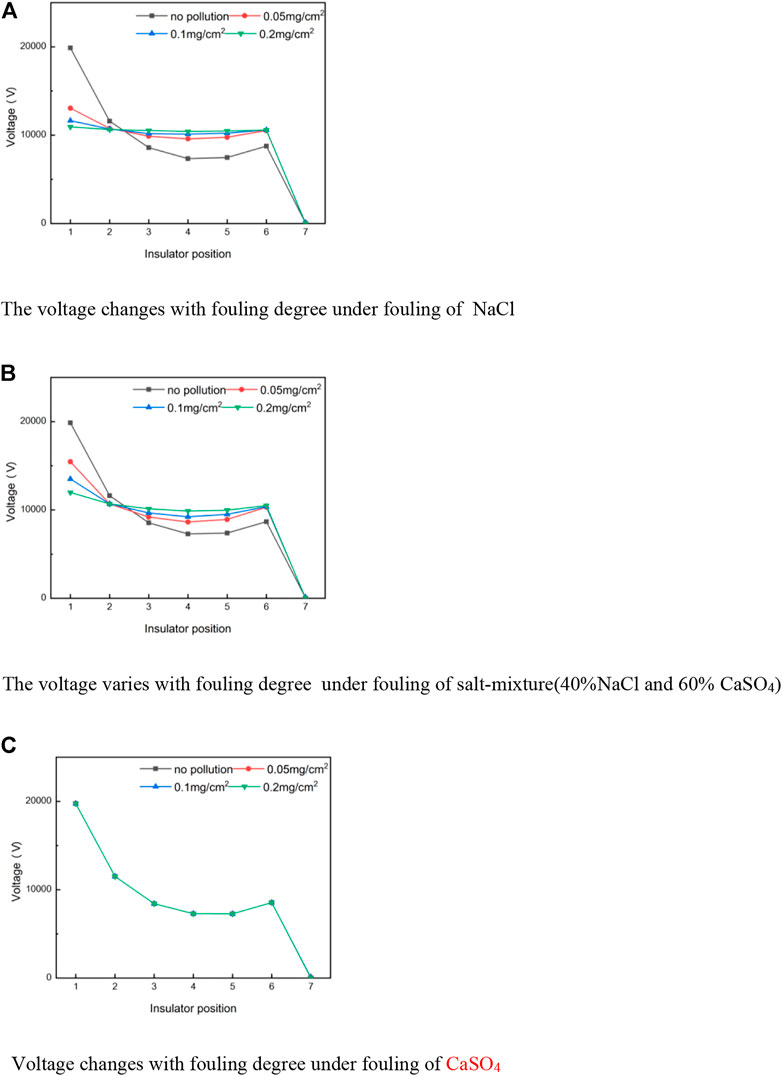
FIGURE 9. Voltage of insulator surface containing different pollution salts under different degrees and types of pollution. (A) Voltage changes with the fouling degree under the fouling of NaCl. (B) Voltage varies with the fouling degree under the fouling of salt mixture (40%NaCl and 60% CaSO4). (C) Voltage changes with the fouling degree under the fouling of CaSO4.
Figure 10, Figure 11, and Figure 12 show that the current density at all insulator string increases gradually with the raise of insulator surface pollution degree, while the pollution layer is NaCl or mixed salt. The current density in the insulator string does not change with the rise in the pollution degree under the case of the pollution of only CaSO4.
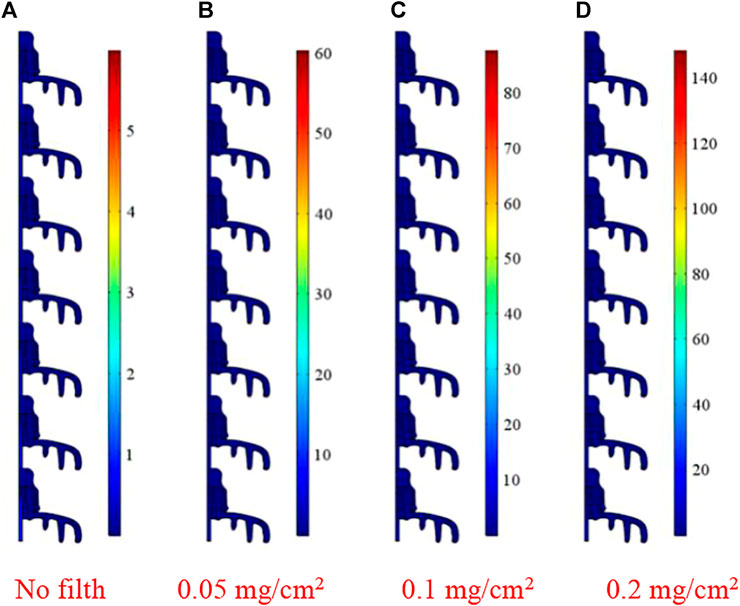
FIGURE 10. Current density under different pollution degrees (NaCl). (A) No filth, (B) 0.05 mg/cm2, (C) 0.1 mg/cm2, and (D) 0.2 mg/cm2.
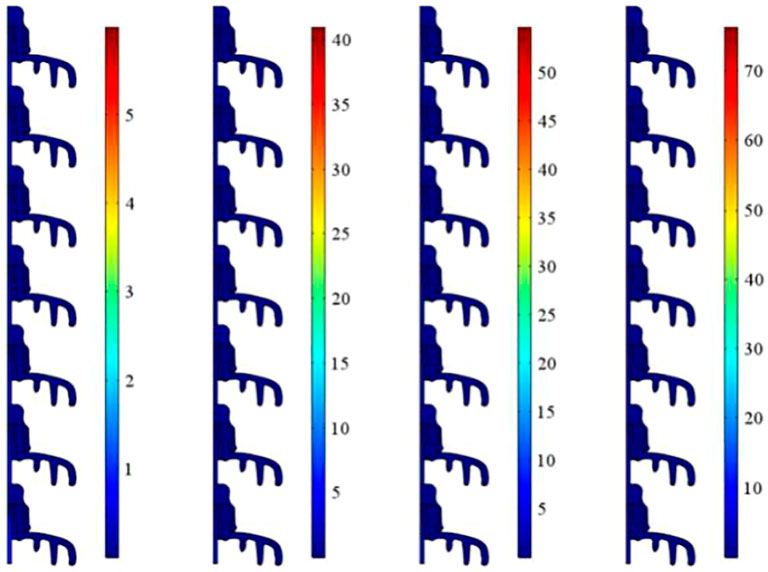
FIGURE 11. Current density at different pollution degrees (salt mixture).
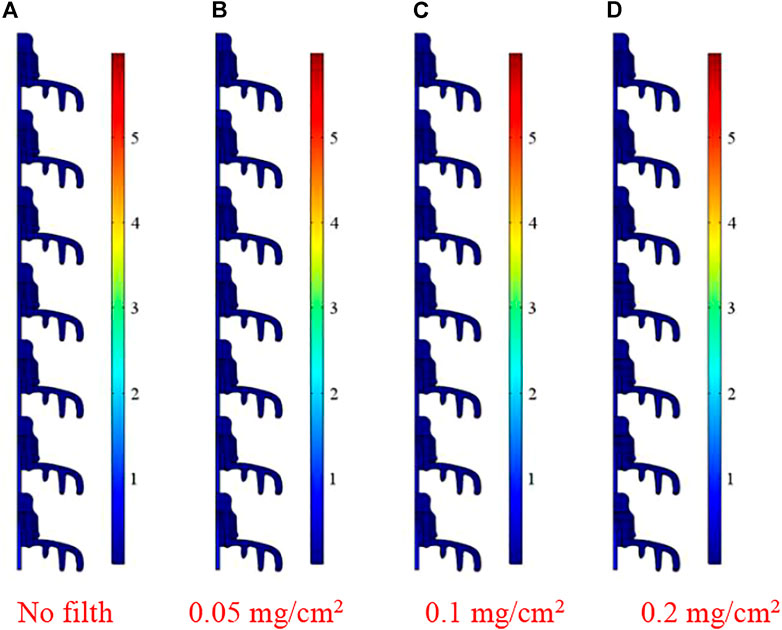
FIGURE 12. Current density under different pollution degrees (CaSO4). (A) No filth, (B) 0.05 mg/cm2, (C) 0.1 mg/cm2, and (D) 0.2 mg/cm2.
Figure 13 shows the maximum current density of different pollution degrees and salt types under the ambient relative humidity of 80%. The pollution type contains only NaCl, the mixed salt of NaCl, and only CaSO4 with the pollution degree of
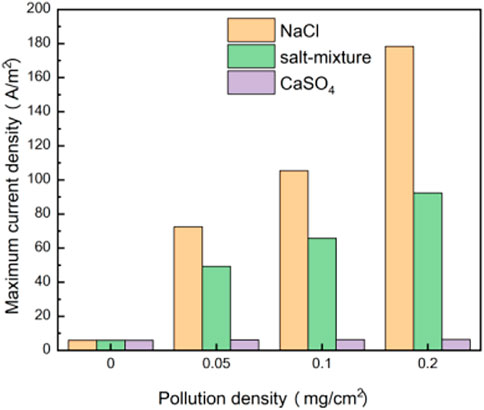
FIGURE 13. Maximum current density of insulator surface contaminated with different types of salts.
The test is carried out on the basis of GB/T4585-2004/IEC60507:1991—artificial pollution test for high voltage insulators used in AC systems” standard. Figure 14 shows the test principle. A voltage regulator is a moving coil voltage regulator with a rated input voltage of 220 V, an output voltage of 0–250 V, and a rated capacity of 15 kV A. The protection resistance value is
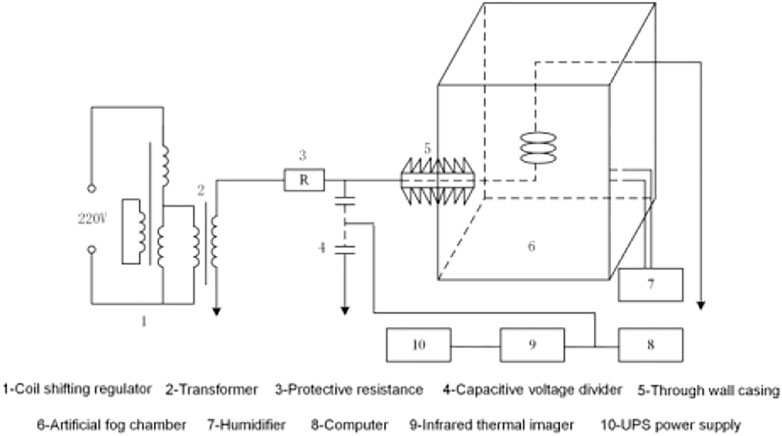
FIGURE 14. Schematic diagram of the test.
Figure 15 shows the temperature difference between zero resistance insulators and others, while the relative humidity of pollution is 70% and 80%. The temperature rise of zero resistance insulators is relatively low, which results in the temperature difference between them and other insulators to be large. With the gradual raise of relative humidity, the temperature difference also gradually becomes larger. Based on different humidities or different positions of zero resistance insulators in the string, the temperature difference of insulators on the high-voltage side is greater than or equal to that of insulators on the low-voltage side.
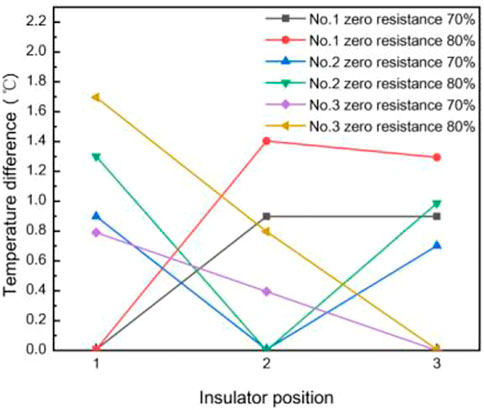
FIGURE 15. Temperature difference between zero resistance insulators and the others under a relative humidity of polluted string of 70% and 80%.
Figure 16 shows the temperature difference between zero resistance insulators and the others in the string with different pollution degrees at the connection position between the iron foot and the lower surface. The temperature difference between zero resistance insulator and the others will raise gradually with the raise of pollution degree (raising from 0.03 mg/cm2 to 0.2 mg/cm2). The insulator 1 is selected as a zero resistance insulator in the real test. The temperature rise difference of insulator 2 is 1.3°C and that of insulator 3 is 1.1°C, while the pollution degree is 0.03 mg/cm2; The temperature rise difference of insulator 2 is 1.3°C and that of insulator 3 is 1.2°C, while the pollution degree is 0.05 mg/cm2. The temperature rise difference of insulator 2 is 1.4°C and that of insulator three is 1.3°C, while the pollution degree is 0.1 mg/cm2; the temperature rise difference of insulator 2 is 1.5°C and that of insulator 3 is 1.3°C, while the pollution degree is 0.2 mg/cm2. The temperature difference between other insulators and zero resistance insulators raises with the raise of pollution degree. Although some data of temperature difference do not increase significantly, the overall raise trend is the same as the emulation results.
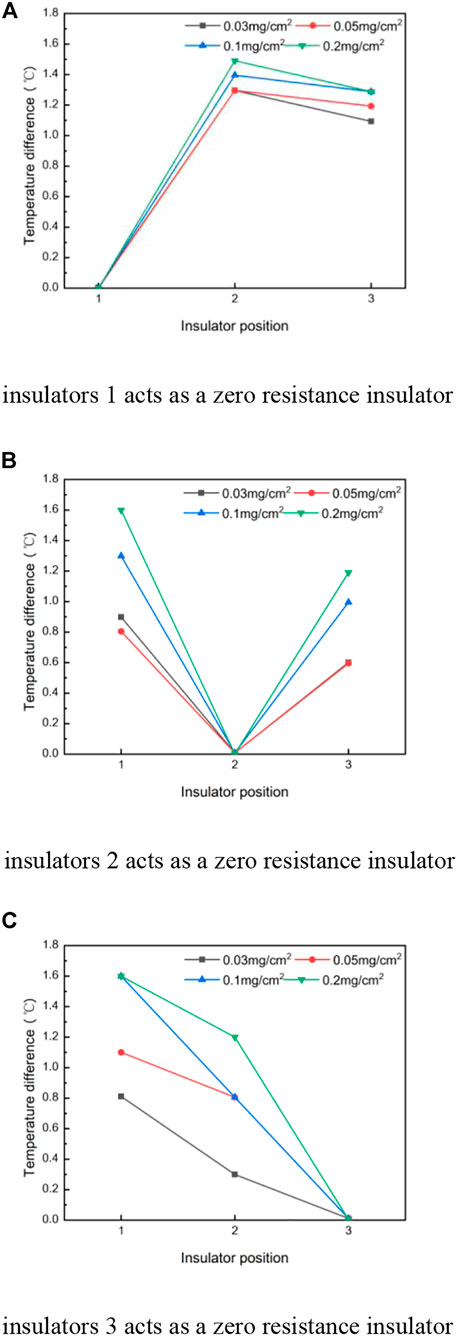
FIGURE 16. Temperature difference between the zero resistance and other insulators in the connection position between the iron foot and the lower surface under different pollution degrees. (A) Insulator 1 acts as a zero resistance insulator. (B) Insulator 2 acts as a zero resistance insulator. (C) Insulator 3 acts as a zero resistance insulator.
Through the three-dimensional zero-value insulator model simulation and insulator infrared detection test, the following three conclusions are drawn. The research results can provide support for the infrared detection of zero-value insulators:
(1) Zero resistance insulators have a great influence on adjacent position insulators, while the influence on other non-adjacent position insulators has a distance correlation. In other words, with the increase in the relative distance between the non-adjacent insulators and the zero resistance insulator, the influence will decrease continuously.
(2) The temperature rise at different positions on the insulators is related to the distance from its own center axis. Farther the distance from the rotation center axis is, the smaller the temperature will rise. The test shows that the maximum temperature rise occurs at the connection between the iron foot and the lower surface.
(3) With the raise of relative humidity and pollution degree, the overall temperature rise of the insulator string gradually raises. The temperature difference between zero resistance insulator and other insulators also raises gradually, but the temperature difference between adjacent non-zero resistance insulators is still small.
The raw data supporting the conclusion of this article will be made available by the authors, without undue reservation.
LC, FL, and MC conceived the idea and designed the experiments. XH, RH, and YZ led the experiments. All authors read and approved the final manuscript.
This study was supported by the State Grid FujianElectric Power Co., Ltd. technology project (Grant No.52130A2000F). The funder was not involved in the study design, collection, analysis, interpretation of data, the writing of this article or the decision to submit it for publication.
LC, FL, MC, XH, RH, and YZ were employed by the EVH Branch Company of State Grid Fujian Electric Power Co. LTD.
All claims expressed in this article are solely those of the authors and do not necessarily represent those of their affiliated organizations, or those of the publisher, the editors, and the reviewers. Any product that may be evaluated in this article, or claim that may be made by its manufacturer, is not guaranteed or endorsed by the publisher.
Chen, Y., Gou, J. f., and Wu, X. J. (2015). Experimental Study of Zero Resistance and Pollution Insulators Rapid Detection Based on Infrared Temperature Measurement. High. Volt. Appar. 51 (06), 191–194+199. doi:10.13296/j.1001-1609.hva.2015.06.033
Ilha, S., Ozdemir, A., Jayaram, S. H., and Cherney, E. A. (2012). Emulations of Pollution and Their Effects on the Electrical Performance of Glass Suspension Insulators. 2012 Annual Report Conference on Electrical Insulation and Dielectric Phenomena, 14-17 October 2012, Montreal, QC, Canada, 803–806. doi:10.1109/CEIDP.2012.6378902
Ilha, S., Ozdemir., A., Jayaram., S. H., and Cherney, E. A. (2015). Numerical and Experimental Investigation of the Effects of Pollution on Glass Suspension-type Insulators. IEEE Trans. Dielect. Electr. Insul. 22 (5), 2987–2994. doi:10.1109/TDEI.2015.004863
Liu, Y. P., Zhang, K. Y., and Fu, W. P., (2018). Thermal Characteristics of Low Value Porcelain Insulators under Different Humidity. High. Volt. Technol. 44 (06), 1741–1749. doi:10.13336/j.1003-6520.hve.20180529003
Mei, H. W., Zhao, C. L., Dai, H. Q., and Wang, L. (2014). Study on Wetting Characteristics of Contaminated Porcelain and Glass Insulators. Proc. csee 34 (09), 1471–1480. doi:10.13334/j.0258-8013.pcsee
Reddy, B. S., and Nagabhushana, G. R. (2003). Study of Temperature Distribution along an Artificially Polluted Insulator String. Plasma Sci. Tech. 5 (2), 1715–1720. doi:10.1088/1009-0630/5/2/006
Vitelli, M., Tucci, V., and Petrarca, C. (2000). Temperature Distribution along an Outdoor Insulator Subjected to Different Pollution Levels. IEEE Trans. Dielect. Electr. Insul. 7 (3), 416–423. doi:10.1109/94.848929
Xu, Z. N., Lu, F. C., Li, H. M., and Liu, Y. (2011). Influence Factors and Optimization of Electric Field Finite Element Analysis of Insulators. High. Volt. Technol. 37 (04), 944–951. doi:10.13336/j.1003-6520.hve.2011.04.021
Yuan, L., Zhao, R., and Tan, X. Y., (2018). Zero Resistance Insulator Detection Based on Infrared Imaging Technology. High. Volt. Appar. 54 (02), 97–102. doi:10.13296/j.1001-1609.hva.2018.02.016
YuanJ, H. (2008). Study on Ac Pollution Flashover Characteristics and Discharge Process of Insulators (String) in Transmission Line. Chongqing: Chongqing University.
Keywords: zero resistance insulator, ambient relative humidity, dirty degree, dirty salt content, infrared detection
Citation: Chen L, Lin F, Chen M, Huang X, He R and Zheng Y (2022) Influence for Ambient Relative Humidity and Pollution on Infrared Detection of Zero Resistance Insulators. Front. Energy Res. 10:942408. doi: 10.3389/fenrg.2022.942408
Received: 12 May 2022; Accepted: 16 June 2022;
Published: 17 August 2022.
Edited by:
Tinghui Ouyang, National Institute of Advanced Industrial Science and Technology (AIST), JapanReviewed by:
Dr. Sandeep Kumar Duran, Lovely Professional University, IndiaCopyright © 2022 Chen, Lin, Chen, Huang, He and Zheng. This is an open-access article distributed under the terms of the Creative Commons Attribution License (CC BY). The use, distribution or reproduction in other forums is permitted, provided the original author(s) and the copyright owner(s) are credited and that the original publication in this journal is cited, in accordance with accepted academic practice. No use, distribution or reproduction is permitted which does not comply with these terms.
*Correspondence: Ling Chen, NDcxMjI1OTU3QHFxLmNvbQ==
Disclaimer: All claims expressed in this article are solely those of the authors and do not necessarily represent those of their affiliated organizations, or those of the publisher, the editors and the reviewers. Any product that may be evaluated in this article or claim that may be made by its manufacturer is not guaranteed or endorsed by the publisher.
Research integrity at Frontiers
Learn more about the work of our research integrity team to safeguard the quality of each article we publish.