 Jinyong Lei
 Zhiyong Yuan1
 Hao Bai
 Jie Yang
 Nian Liu
- 1Electric Power Research Institute, China Southern Power Grid, Guangzhou, China
- 2Electric Power Research Institute of Yunnan Electric Power Grid Co., Ltd., Kunming, China
- 3State Key Laboratory of Alternate Electrical Power System with Renewable Energy Source, Institute of Electrical and Electronic Engineering, North China Electric Power University, Beijing, China
With the large-scale development of renewable energy sources such as wind and solar energy, the grid connection of renewable energy sources poses a certain threat to the security and stability of the power system, and also brings a great challenge to the economic dispatch of the distribution network. Traditional and single dispatching methods such as load demand response or network reconfiguration alone cannot meet the needs of a safe and economic operation of the distribution network. This article proposes an economic dispatching method for distribution networks with dispersed wind power considering network reconfiguration, and establishes an economic dispatching model with the objective function of minimizing distribution network operation cost, reconfiguration cost, and total system network loss. Based on the optimal scheduling of energy storage and reactive power compensation devices in the distribution network and the full utilization of demand response, a mixed integer second-order cone programming (MISOCP) method with multi-objective collaborative optimization is proposed. The results of the tests using the IEEE33 node system verify the feasibility and applicability of the proposed method in this article.
Introduction
With the increasingly serious environmental problems and the depletion of fossil energy, there is a consensus in the whole of society to devote to the vigorous development and utilization of renewable energy (Mahmud and Zahedi, 2016). Wind power generation has been developing rapidly with a series of advantages, while with the rapid development, some problems also gradually emerged, such as the “abandoned wind rate” remaining high, the wind power consumption problem becoming serious (Duan et al., 2018). Continuing to develop centralized wind power will make wind power development into a bottleneck. Therefore, dispersed wind power has become a new way of wind power development.
However, the problems of voltage fluctuation and power quality of the distribution network are becoming more and more serious after distributed generation (DG) is connected to the network, and the randomness of its output and load increases the difficulty of the voltage and reactive power control of the network (Duan et al., 2018) (Liu X. et al., 2014). At this time, it is necessary to make the power output of DG meet the safety operation constraints of the grid by cutting it. Therefore, it is necessary to deeply study the change mechanisms of the distribution network operation state under the DG environment and make full use of various dispatchable resources in the grid to adapt to the future development of the distribution network (Liu et al., 2012).
At present, the research on the economic dispatch optimization of distribution networks containing distributed generation domestically and overseas is generally based on the objective function of minimizing system network loss or operating cost, or a multi-objective optimization model that takes into account relevant technical and economic indicators (Martinez-Rojas et al., 2011) (Alonso et al., 2012) (Kong et al., 2018) (Wang and Liu, 2019). In Kang et al. (2018), the random power output model of distributed generation is established, and a dynamic energy scheduling strategy is proposed, but the reactive power output management of DG and the demand response of the load are not taken into account. In Gao et al. (2017), an optimal scheduling model based on opportunity-constrained planning is proposed, but in this model, the dispatchable resources only consider the active and reactive power outputs of distributed generation, without considering energy storage as an effective means of scheduling. In Zou et al. (2018), a multi-timescale optimal scheduling method based on mixed integer linear programming is proposed. In Zhang et al. (2018), the day-ahead optimal scheduling of active distribution networks (ADN) with controllable photovoltaic (PV) systems was discussed, but the impact of a network topology change on network loss was not considered. In Qi et al. (2020), a multi-timescale active and reactive power coordinated scheduling method is proposed, but the operation cost of energy storage and load demand response are not considered. In Galvan et al. (2015) and Liu et al. (2016), the optimal dispatching scheme is proposed with PV and wind power, considering the energy storage system and demand response, with the optimization objective of minimizing the total operating cost.
On the one hand, all the aforementioned literature is devoted to research work on the economic dispatch of distribution networks, while an important function of network reconfiguration is to manage power flow through the change of network topology (Gao et al., 2018) (Goodwin et al., 2006) (Fei et al., 2011) (Wen et al., 2018). Active management means can actively adjust the power flow of the distribution network. The two complement each other, which can greatly reduce the network loss of the distribution network and improve the economy of distribution network operation. However, the aforementioned literature does not involve the topology adjustment of the system network and does not fully achieve the purpose of optimizing power flow. For the distribution network reconfiguration problem, its solution usually uses mathematical optimization methods and intelligent algorithms (Mori and Ikegami, 2016) (Mishra and Hota, 2018) (Liu, 2015) (Cadenovic et al., 2017). In Liu et al. (2017), a distribution network reconfiguration method considering distributed generation allocation is proposed. In Zhou et al. (2016), the active distribution network dynamic reconfiguration and DG scheduling strategy based on the fireworks algorithm is proposed, but only the active and reactive power outputs of DG are considered, and no other dispatchable resources are considered. In Liao et al. (2018), a network–source–load coordination planning method is proposed by integrating DG and the demand-side response, but only the active power output of DG is considered, and the reactive power of DG is not considered.
On the other hand, the optimal scheduling problem of the distribution network is a mixed integer nonlinear programming problem, which is not easy to solve. Most of the solution algorithms in the aforementioned literature use intelligent algorithms with the characteristics of theoretical simplicity and easy implementation, which leads to the difficulty of ensuring the convergence and optimization of the algorithms, and the solution speed are slow. And, Second-Order Cone Programming (SOCP) is a very special kind of nonlinear optimization with very efficient solution algorithms. At present, many scholars domestically and overseas have studied the second-order cone programming convex relaxation model of the AC power flow (Yang et al., 2014) (Cui and Sun, 2017). It is a convex optimization method widely used in power systems. In Liu Y. et al. (2014), Kayack and Kocuk (2021), the MISOCP model are used for the reactive power optimization problem of the distribution network, both of which have achieved good results.
In summary, most of the existing research are still mainly on centralized wind power generation, and there is less research on dispersed wind power, and the intelligent algorithms used have deficiencies such as a slower solution speed. Moreover, the large-scale dispersed wind power access will lead to voltage crossing, which brings challenges to the safe operation of the distribution network. In addition, most of the studies on voltage regulation focus only on the reactive power regulation of distributed power sources such as wind power and photovoltaic power, and do not pay much attention to other types of distributed energy sources such as energy storage devices. So, this article considers the impact of network reconfiguration on economic dispatching results, and in addition to the active output of dispersed wind power, it also fully considers the reactive output of dispersed wind power, demand response (DR) load, energy storage (ES), and Static Var Generator (SVG). In this article, an economic dispatch model of the distribution network with dispersed wind power considering network reconfiguration is established with the optimization objectives of minimizing the distribution network operation cost, minimizing the network reconfiguration cost, and minimizing the total network loss of the system. This model takes into account the reactive voltage regulation and the economic operation of the distribution network. At the same time, a second-order cone convex relaxation is applied to the model in order to improve the solution speed.
The rest of the article is organized as follows. The Economic Dispatch Model for Distribution Networks With Dispersed Wind Power Considering Network Reconfiguration Section contains the multi-objective function and each constraint, and proposes an economic dispatch model for a distribution network containing dispersed wind power considering network reconfiguration. Based on the Second-Order Convex Cone Relaxation Solving Method Section contains the algorithm for solving the model. Case study Section contains the case study and result analysis. Conclusion Section contains the conclusion.
Economic Dispatch Model for Distribution Networks With Dispersed Wind Power Considering Network Reconfiguration
Multi-Objective Function
Objective function 1: minimize the operation cost of the distribution network.
The economic optimal dispatching model containing dispersed wind power is mainly aimed at reducing the operating cost of the distribution network and network losses, where the operating cost of the distribution network is mainly composed of the power purchase cost on the generation side of the distribution network, the operating cost of dispersed wind power, the regulation cost of each device, and the subsidy cost of system demand response. The details are shown as follows:
The objective function 1 consists of five terms: the first term is to minimize the operating cost of dispersed wind power, where
Objective function 2: minimize the cost of network reconfiguration.
For distribution network reconfiguration, in order to consider the economy of the distribution network in the reconfiguration process, the switching operation cost of network reconfiguration is used as the optimization goal which can be expressed as follows:
where
Objective function 3: minimize the total network loss of the system.
When the distribution network operates in multiple periods, the voltage amplitude and phase angle of any node of the distribution network can be determined by power flow calculation, and the active power loss can be calculated. Therefore, the objective function for minimizing the total network loss of the system can be expressed as follows:
where
In this article, considering the distribution network operation cost, network reconfiguration cost, and network loss of the distribution network, the integrated objective function can be expressed as follows:
where the smaller
Constraint Condition
Power Flow Constraint
The dispersed wind turbine output, reactive power compensation device output, energy storage output, and demand response load power shall satisfy the following power flow equation.
where
Dispersed Wind Power Constraint
Due to the limitation of dispersed wind power regulation capacity, the reduction of wind turbine output cannot exceed the existing active output, and the active reduction of each node is specified to be positive. Each dispersed wind turbine has a reactive power regulation capability to control the voltage, specifying that each node can both absorb and emit reactive power, and that the emitted reactive power is positive and the absorbed reactive power is negative. Therefore, there are constraints on the reduction of the active power and the output of the reactive power, as follows:
where
Controllable Load Constraint
The controllable load is mainly the low power quality requirement and a less important load in industrial production. By signing a demand-side response agreement with the grid, the customer responds in a demand-side manner by reducing the load demand while meeting its own minimum demand for electricity at the peak of the grid according to the outage notification received, and receives the corresponding economic compensation cost. The mathematical model of the controllable load is represented as follows:
where
Energy Storage Constraint
The active–reactive output constraints of energy storage are expressed as follows:
where
Static Var Generator Constraint
where
Distribution Network Operation Security Constraint
The regulated voltage and current are controlled within the standard range, so there is a non-transgression constraint on the distribution network voltage, and it is given as follows:
where
Network Topology Constraint
It is required to meet the topology requirements in the distribution network, that is, the network topology must be radial, given as follows:
where
Based on the Second-Order Convex Cone Relaxation Solving Method
One of the difficulties in solving the distribution network economic dispatch model with dispersed wind power is that the non-convexity of the AC power flow model causes the whole dispatch model to become a non-convex programming problem. If it can be transformed into a convex programming problem with high accuracy, the solution’s difficulty will be greatly reduced, thus shortening the solution time and reducing the occupation of computational resources. Considering the non-convex non-linear mathematical nature of the model, this article will use the second-order cone method to treat it with convex relaxation.
Second-order cone programming is the problem of minimizing or maximizing a linear function on the intersection of the affine subspaces of the Cartesian product of a finite number of second-order cones, that is, the problem of a linear objective function under the constraints of linear equality and linear inequality under the partial order of non-empty pointed convex cones. By transforming the complex optimization model into a cone model, the complex relationship between variables can be represented as a cone set with a special structure, which greatly simplifies the solution of the original model and speeds up the convergence speed. The standard form of a second-order cone programming is shown in Eq. 26:
where
Second-order cone:
Rotating second-order cone:
The economic dispatching model considering distribution network reconfiguration in this article is a mixed integer non-linear programming (MINLP) problem, where the network loss and the system power flow constraint in the objective function are represented as non-linear and non-convex in polar coordinates, which increases the difficulty of solving the original problem. Therefore, the aforementioned problem is transformed into a mixed integer second-order cone programming (MISOCP) problem by introducing intermediate variables in the article, and the power flow constraint of AC distribution network is transformed into a second-order cone form by second-order cone relaxation, and the search space is restricted to a limited convex cone using a rigorous mathematical approach to modeling, where intermediate variables are introduced as shown in Eqs 29–31.
The non-linear objective function and constraints in the aforementioned model are transformed in a cone form, where in the objective function, the system power flow constraint, and the distribution network operation security constraint are non-linear functions, which are transformed into the following linear functions.
The objective function
The system power flow constraint is converted to a cone function as shown in Eq. 33:
The distribution network operational security constraint is converted into a cone function as shown in Eq. 34:
When solving the mixed-integer second-order cone programming problem, an approximate description of the polyhedra of the second-order cone is obtained by relaxing the variables. Therefore, in solving the problem, Eq. 35 is converted into a cone constraint as shown in Eq. 36:
At this point, the feasible domain is relaxed to a second-order cone, forming a convex feasible domain. The problem can be solved quickly and efficiently by using common commercial solvers. In this article, the MOSEK solver is adopted to solve the optimization model in the article using the branch and bound-primal dual interior point method. Because the model is a convex programming model, it has better computational efficiency and convergence characteristics than the non-convex programming model based on the original AC power flow equation.
Case Study
Case Parameter Setting
In this article, a standard IEEE33 node system is used, which contains 8 dispersed wind power stations, 8 SVG devices, 1 battery storage, and 4 loads involved in demand response, where the SVG installation location is the same as the dispersed wind power station, as shown in Figure 1.
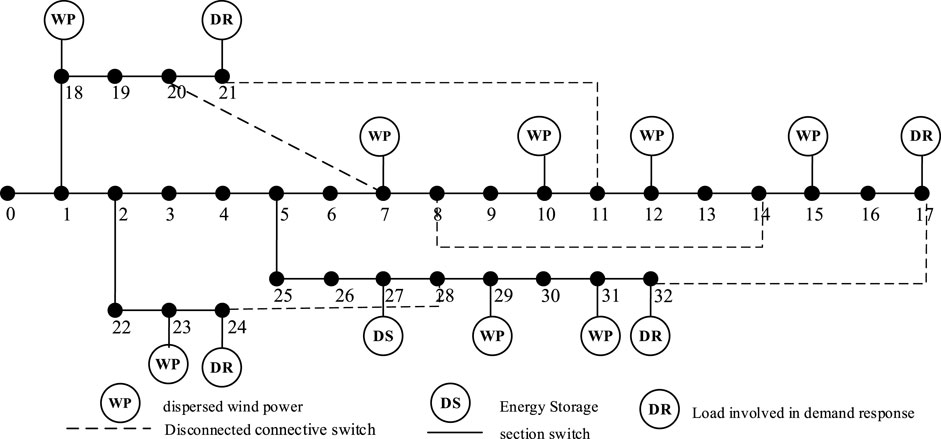
FIGURE 1. EEE33 node system.
Node 0 in the system is set as the balance node, and its node voltage is set to 1.06 p.u. Referring to the power grid operation safety standard, the upper and lower limits of the voltage amplitude of each node in the system are set to 1.07 p.u. and 0.91 p.u., respectively. The reference capacity of the system is 10 MVA, the voltage level is 12.66 kV, where the installed capacity of the SVG devices are 360 kVar, the rated output power of the wind power station is 1MW, and the upper limit of the reactive power output of wind power is also 1MW, their pre-dispatch power output is shown in Figure 2. The maximum power of wind power active adjustment is 10% of the wind turbine output, the battery storage capacity is 240 kW, and its initial charge state is 50%, while considering the scheduling of the next day’s energy storage, so the charge state in the last moment of the day is also set to 50%, and the upper limit of the load adjustment involved in demand response in the system is 15% of the load.
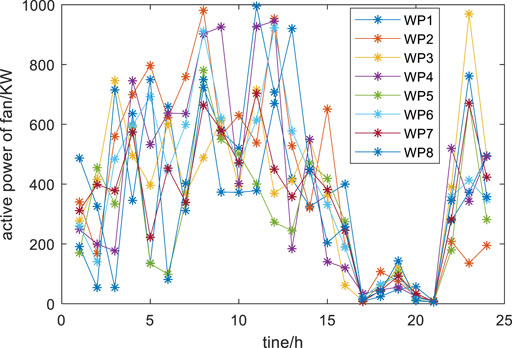
FIGURE 2. Pre-dispatch output of each wind turbine.
The pre-dispatch daily load curve is shown in Figure 3. A complete scheduling cycle is 24 h, and every 1 h is a scheduling period. The power purchase price of the distribution network is 0.2 CNY. In the example, the operation and maintenance costs of a wind turbine is 0.01 CNY/kWh, the penalty cost of wind abandonment is 0.5 CNY/kWh, the operation and maintenance costs of energy storage is 0.013 CNY/kWh, the adjustment cost of SVG is 0.009 CNY/kvar, the compensation cost of adjustable load is 0.8 CNY/kWh, the network loss cost is 0.3 CNY/kWh, and the cost of a single switch action is 20 CNY.
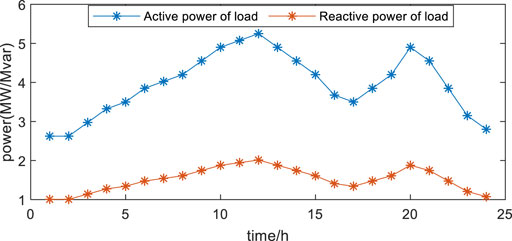
FIGURE 3. Total load of the distribution network before dispatch.
In this article, the second-order cone method is used to perform convex relaxation of the economic dispatch model of the distribution network containing dispersed wind power considering network reconfiguration, which is modeled by the Yalmip optimization tool under the compiled environment of MATLAB R2018b, and the MOSEK solver is invoked to solve it. Taking MATLAB 2018b as the test environment, the example ran successfully on a computer with Intel Core i5-10400 CPU 2.90 GHz and 16G RAM.
Analysis of Case Results
To compare and verify the optimal scheduling strategies proposed in this article, 2 different strategies are set up as follows:
Strategy 1: Economic dispatch of the distribution networks containing dispersed wind power without considering network reconfiguration.
Strategy 2: Economic dispatch of the distribution networks containing dispersed wind power considering network reconfiguration.
In this article, a simulation analysis is conducted for a typical day of operation, and the effect of the economic dispatch considering distribution network reconfiguration on operation optimization results is investigated by simulating under two different strategies, and the effectiveness of the method is verified. The network topology of strategy 1 is shown in Figure 1. Since strategy 2 considers the distribution network reconfiguration, the topology of the network is changed, the broken section switches are {10–11}, the rest of the section switches are all closed, the closed tie switches are {21–11}, the rest of the tie switches are all broken, and its network topology is shown in Figure 4.
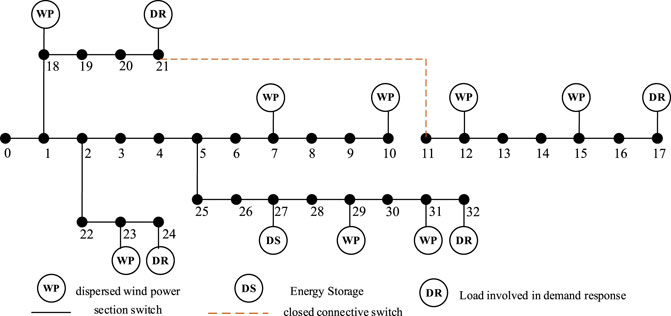
FIGURE 4. Network topology of strategy 2.
Analysis of Power Supply-Side Simulation Results
The main energy in the distribution network comes from the higher level grid and the dispersed wind turbines in the system, and each supply source reasonably generates electricity in each time period to meet the demand of the users. Combined with this article, the power supply-side mainly involves dispersed wind turbines, energy storage, and SVG.
The charging and discharging patterns of energy storage for strategy 1 and strategy 2 are shown in Figure 5. When the value of energy storage power is positive, the energy is released, which is the discharging state; when its value is negative, the energy is stored, which is the charging state. It can be seen from the figure that in strategy 1, the energy storage is in the charging state at 4:00, 8:00, 11:00, 12:00, 23:00, and 24:00, and in the discharging state for the rest of the time, and its reactive power fluctuates widely between 1:00 and 10:00. During the whole dispatching cycle, the charge state of SOC reaches the lowest at 21:00.
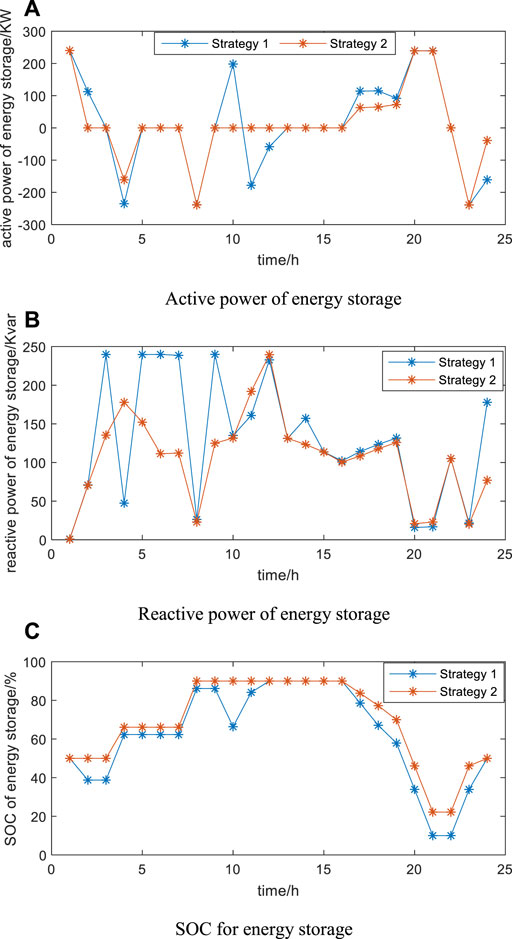
FIGURE 5. Energy storage powers of strategy 1 and strategy 2. (A) Active power of energy storage. (B) Reactive power of energy storage. (C) SOC for energy storage.
In strategy 2, the participation of distribution network reconfiguration is considered. Compared with strategy 1, the reactive power output curve fluctuates less compared with strategy 1 in order to meet the safety operation constraint of the system because the network topology has changed, and its active power can be clearly seen in Figure 5 that the number of charging and discharging actions of strategy 2 is less than that of strategy 1, so the cost has decreased. And at this time, the total sum of the energy storage charging and discharging all day is 1,596.84 KW and the cost is 20.76 CNY, while the total sum of strategy 1 is 2,461.05 KW and the cost is 31.99 CNY. The cost of strategy 2 is lower than the cost of strategy 1.
As the access of dispersed wind power easily makes the voltage cross the limit, the reactive power output of SVG and the wind turbine inverter plays the role of voltage adjustment to keep the voltage of each node within the specified range, and when the system voltage is too high, it can lower the voltage by absorbing the reactive power, and when the system voltage is too low, it can raise the voltage by issuing the reactive power. When the reactive power of the wind turbine and SVG is positive, it means that the reactive power is issued, and when the reactive power of the wind turbine and SVG is negative, it means that the reactive power is absorbed.
The wind curtailment rate of strategy 1 and strategy 2 is shown in Figure 6, which shows that the overall wind curtailment rate of strategy 2 is smaller than that of strategy 1, and the wind curtailment phenomenon mainly exists between 17:00 and 21:00, but the active power reduction of both strategies is very small, even negligible, which is due to the fact that the distribution network is not restricted to send back to the upper grid in this example. So, when the output of the turbine is greater than the total load, the excess power excluding the part is stored in the energy storage, the remaining power is returned to the upper grid. Secondly, because there is a wind curtailment penalty for turbines in this article, the overall adjustment of the active output of strategy 1 and strategy 2 are small based on the principle of economy under the constraints of the safe operation of the system.
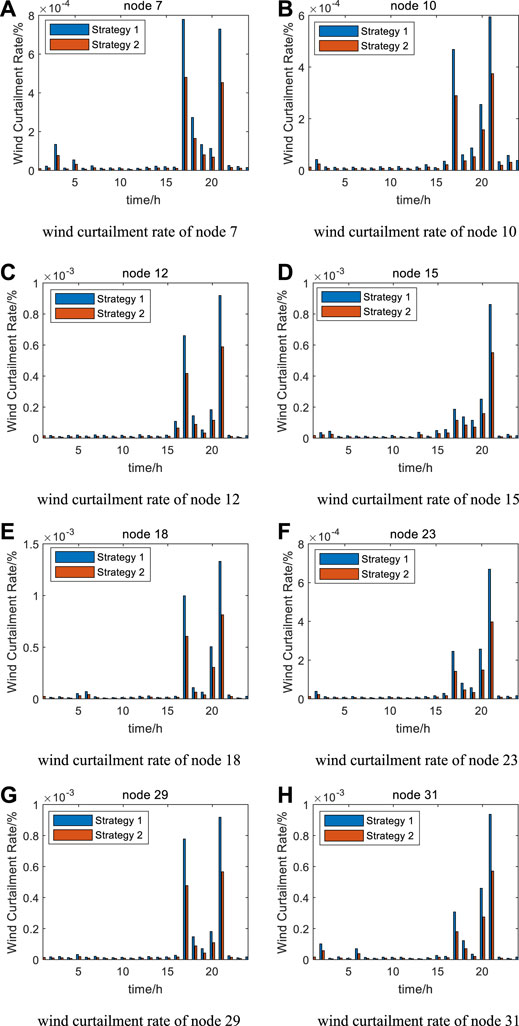
FIGURE 6. wind curtailment rates of strategy 1 and strategy 2. (A) Wind curtailment rate of node 7. (B) Wind curtailment rate of node 10. (C) Wind curtailment rate of node 12. (D) Wind curtailment rate of node 15. (E) Wind curtailment rate of node 18. (F) Wind curtailment rate of node 23. (G) Wind curtailment rate of node 29. (H) Wind curtailment rate of node 31.
Reactive power output of wind turbines in strategy 1 and strategy 2 is shown in Figure 7. In strategy 1, it can be seen from the figure that nodes 7, 10, 12, 15, and 31 are in the state of absorbing reactive power from the system for most of the time, while nodes 18, 23, and 29 are in the state of issuing reactive power to the system during the whole dispatch cycle. In strategy 2, the trend of the reactive power absorption state and the reactive power generation state of each wind turbine in the whole dispatching cycle is the same as that of strategy 1. However, due to the change of network topology in strategy 2, the distribution network power flow has changed, so the overall generation and absorption of reactive power of wind turbines in strategy 2 is less than that of strategy 1.
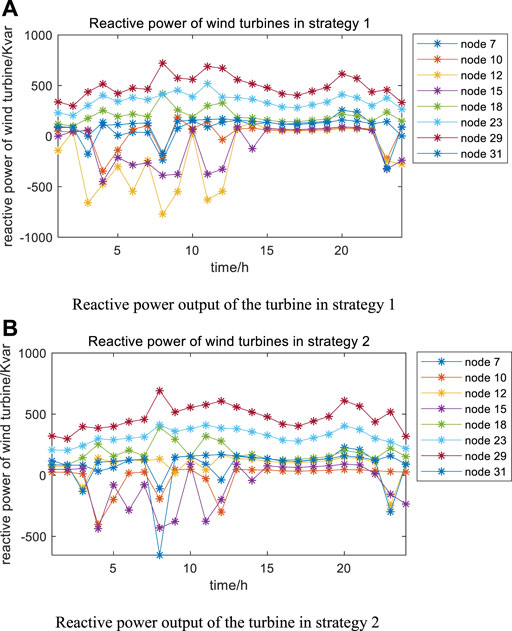
FIGURE 7. Reactive power outputs of the wind turbines in strategy 1 and strategy 2. (A) Reactive power output of the turbines in strategy 1. (B) Reactive power output of the turbines in strategy 2.
Since this article sets the reactive power adjustment of the wind turbines without cost and the reactive power adjustment of the SVG with cost, the reactive power adjustment through the wind turbines is considered first when regulating the voltage, and then the reactive power adjustment through the SVG is considered.
The SVG reactive powers of strategy 1 and strategy 2 are shown in Figure 8. In strategy 1, the reactive power adjustment only at node 15 through the wind turbines cannot meet the voltage constraint, so it needs to be adjusted together with the SVG. The other nodes can meet the distribution network operation constraint through the reactive power adjustment of the wind turbines, so the SVG of the corresponding node does not act. The adjustment principle in strategy 2 is the same as strategy 1, only node 10 needs the wind turbines and SVG to adjust the reactive power at the same time to meet the distribution network operation constraints, while the rest of the nodes can be satisfied by the reactive power output of the wind turbines, so the SVG at the rest of the nodes does not operate.
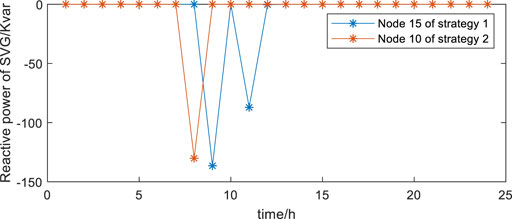
FIGURE 8. SVG powers for strategy 1 and strategy 2.
Analysis of Power Transmission Side Simulation Results
Figure 9 shows the time-by-time network loss comparison between strategy 1 and strategy 2. Strategy 1 reaches the maximum network loss at 8:00, and the network loss at this moment is 229.68 KW, while strategy 2 has the maximum network loss at 20:00, and the network loss is 122.15 KW. It is obvious from the figure that the network loss after reconfiguration is significantly lower than that before reconfiguration, and the network loss of the system in the whole dispatching cycle is reduced from 1,790.81 KW in strategy 1 to 1,021.37 KW in strategy 2, which is 42.97% lower. It shows that the power flowing in the system is reduced, which means that the total network loss is reduced. Therefore, it can be concluded that the optimization method is effective in improving the network losses in the system and improving the economy of the system operation.
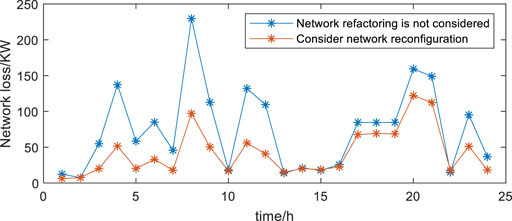
FIGURE 9. Time-by-time network loss of the distribution network for strategy 1 and strategy 2.
The 24-h node voltage magnitudes for both strategy 1 and strategy 2 are always within the safe operating range of 0.91–1.07 p.u. From the perspective of maximum voltage deviation in the system, the deviation between the highest and lowest values of voltage magnitude at each node of the system in each time of the day was selected for comparison, and the results are shown in Figure 10.
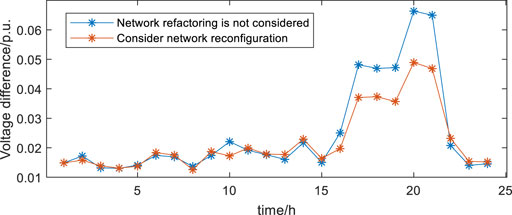
FIGURE 10. Voltage amplitude deviation at each node of the two strategies.
It is obvious from the figure that the deviation between the maximum and minimum values of the voltage magnitude at each node of the system after the network reconfiguration is significantly improved between 15:00 and 22:00 compared with the pre-network reconfiguration, and the deviation between the two strategies is smaller in the rest of the time period. It can be shown that the strategy proposed in this chapter has a certain improvement effect on the voltage distribution of the system and improves the safety and reliability of the system operation.
Analysis of Power Demand-Side Simulation Results
In the demand response model, energy prices, compensation mechanisms, and various energy attributes can change users’ energy consumption patterns. The active power reductions of the demand response node loads in strategy 1 and strategy 2 are shown in Figure 11.
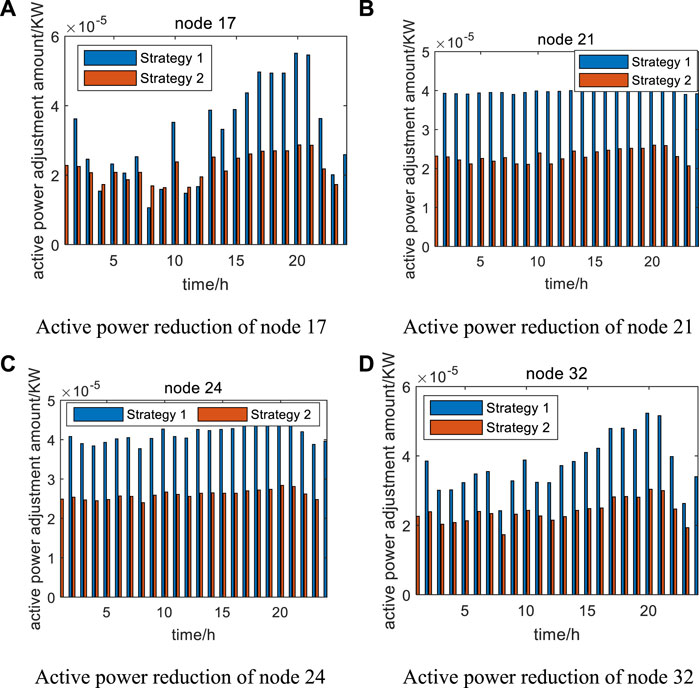
FIGURE 11. Active power reduction of the demand response nodes in strategy 1 and strategy 2. (A) Active power reduction of node 17. (B) Active power reduction of node 21. (C) Active power reduction of node 24. (D) Active power reduction of node 32.
From the figure, it can be seen that the overall active power reduction of strategy 2 is less than that of strategy 1, but the load variation of both strategies is very small and even negligible. The reason can be analyzed from three aspects; first of all, active power also has a certain ability to regulate voltage, although the distribution network mainly regulates voltage through reactive power, but when reactive power cannot meet the voltage regulation requirements, it can be adjusted to active power, because this case can complete the voltage regulation requirements through reactive power, so there is no longer a need for active power to participate. Secondly, this case does not set the electricity price difference, the purchase price of electricity are purchased according to 0.2 CNY, the load will not purchase more electricity when the price is low, and less electricity when the price is high, so it does not play a role in reducing the cost of purchasing electricity. Finally, as the load is adjusted, there will be a corresponding adjustment amount of compensation costs, so, in order to reduce costs, under the premise of meeting the normal operation of the distribution network, its adjustment is as small as possible.
Comparative Analysis of the Results of the Two Strategies
To verify the effectiveness of the strategies proposed in this article, a comparative analysis with the economic dispatch of the distribution network containing dispersed wind power before the reconfiguration is performed. Figure 1 shows the network topology without considering reconfiguration, and Figure 4 shows the reconfigured network topology. The time-by-time operation cost of the two strategies is shown in Figure 12. When the output of dispersed wind power is greater than the total power of the load, there is a return of power to the upper grid, when the operating cost of the distribution network may appear negative. As shown in the figure, the grid has negative values at 3:00, 4:00, 8:00, and 23:00.
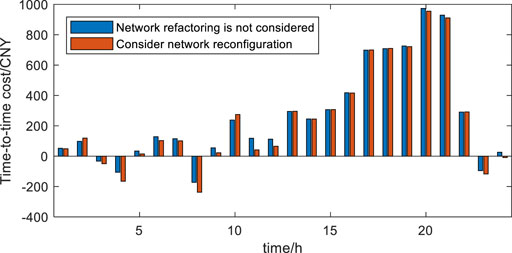
FIGURE 12. Time-to-time operating cost comparison of the two strategies.
The comparison of the calculation results of various indicators is shown in Table 1. According to the results in the table below, the economic dispatching cost after considering reconstruction is lower than that without considering reconstruction. Among them, the reduction of network loss cost is the most obvious, from 537.24 CNY to 306.41 CNY, a decrease of 42.97%. This is due to the change of the network topology after reconstruction, which changes the power flow of the system and achieves the effect of reducing network loss. The total cost of economic dispatch considering reconfiguration is also reduced from 6,159.26 CNY to 5,802.70 CNY, and the total cost is reduced by 356.56 CNY, a decrease of 5.79%.
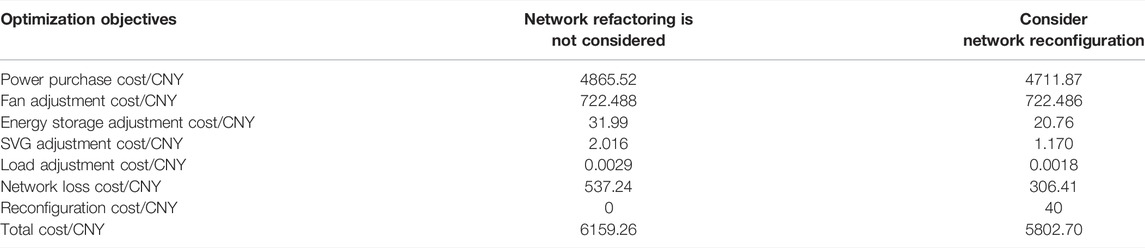
TABLE 1. Comparison of the results of the two strategies.
Meanwhile, in order to verify the superiority of the method used in this article, it was compared with the particle swarm algorithm without considering the reconstruction. The particle swarm algorithm takes 25 min to perform a day of scheduling with the initial population size set to 100 and the number of iterations to 600, and the scheduling cost is 7,580.90 CNY. In contrast, the method used in this article takes only 12 s and the scheduling cost is 6,159.26 CNY, which greatly improves the solution speed and the final result is better than particle swarm. Therefore, the method used in this article improves the solution efficiency while ensuring the optimality and accuracy of the solution.
Analysis of Regulating Voltage Level
In order to further analyze the improvement of the system voltage level by the method proposed in this article, this article sets up four operating states and simulates them respectively.
Running state 1: original system. Only the active power output of dispersed wind power, without the participation of dispatchable resources such as energy storage, SVG, demand response, and reactive power output of wind power.
Running state 2: consider the network reconfiguration based on the original system.
Running state 3: the original system takes into account the optimal operation of various dispatchable resources.
Running state 4: collaborative optimization of network reconfiguration and dispatchable resources.
The comparison of voltage levels in the four operating states are shown in Figure 13. The grid structure and operation cost of the four operation states are shown in Table 2.
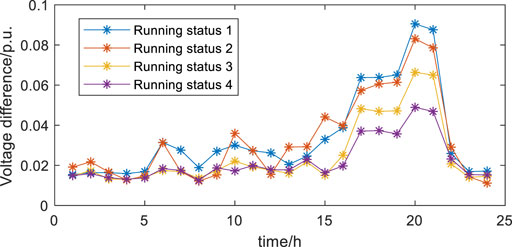
FIGURE 13. Voltage levels for four running states.
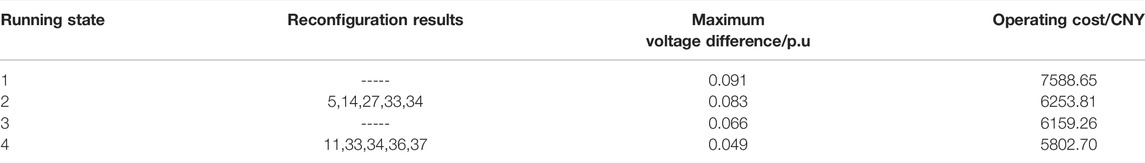
TABLE 2. Comparison of results in four running states.
In this article, the difference between the maximum value and the minimum value of the system voltage is used as the index to evaluate the voltage level. According to the simulation results in Figure 1, the voltage fluctuation in running state 1 is large, and the maximum voltage difference in a day is 0.091 p.u., the voltage level in running state 2 is improved after the distribution network is reconstructed, and the maximum voltage difference in a day is 0.083 p.u., increased by 0.008 p.u. It can be seen that network reconfiguration is helpful to improve the voltage level of the distribution network.
According to the results of running state 3 in Figure 1, when considering the participation of dispatchable resources in an optimal operation, due to the access of dispersed wind power and energy storage, it can effectively reduce the equivalent load of the distribution network, and the reactive output capacity of wind power, energy storage, and SVG can effectively support the system voltage. At this time, the maximum voltage difference of the system in a day is 0.066p.u. Therefore, compared with operation state 1, the voltage level of the distribution network has been greatly improved. Moreover, since the network structure is the same as that of the original network, the change trend of voltage level is the same as that of operation state 1.
When network reconfiguration and dispatchable resources are used to optimize, the voltage distribution becomes more stable due to the changes of the network structure. The maximum voltage difference of the distribution network in a day is 0.049p.u. Compared with the previous three operating states, the voltage fluctuation level is very small.
In addition, it can be seen from Table 1 that the voltage difference of the four running states in a day decreases in turn, and the cost of the distribution network operation also decreases in turn, which shows that the method proposed in this article can greatly improve the stability of the system voltage, and also take into account the economy of distribution network operation dispatching.
To sum up, although network reconfiguration will bring some reconfiguration costs, network reconfiguration is conducive to the economic operation of the distribution network. At the same time, it can also improve the voltage stability of the distribution network to a certain extent. Therefore, distribution network reconfiguration is also a very important means of regulation. With the dispatchable resources in the distribution network, the economy and reliability of the distribution network can be greatly improved.
Conclusion
In this article, a multi-objective function of minimizing the distribution network operation cost, minimizing the network reconfiguration cost, and minimizing the total network loss of the system is considered, and an economic dispatch model of the distribution network with dispersed wind power considering reconfiguration is established. The IEEE 33-node system is adopted, and this article uses the second-order cone method to perform convex relaxation on the economic dispatch model of the distribution network containing dispersed wind power with reconfiguration considered, as a way to obtain the optimal economic dispatch results under a determined network topology. Through the theoretical analysis and example calculations, two conclusions can be drawn as follows:
1) The method proposed in this article takes into account the voltage stability of the distribution network and the economy of operation dispatching, making full use of the active and reactive power resources in the distribution network, and obtaining the optimal economic dispatching scheme while considering the network reconfiguration. The example verifies that the method proposed in this article can reduce the fluctuation of the system voltage, and at the same time can reduce the operating cost of the distribution network to a certain extent. This has certain practical significance for the staff engaged in power distribution planning and dispatching.
2) In this article, the multi-objective optimization model is transformed into a mixed integer second-order cone programming model by introducing variables to restrict the search space to a closed convex cone, which ensures the optimality and accuracy of the solution while also improving the solution efficiency.
Data Availability Statement
The original contributions presented in the study are included in the article/Supplementary material; further inquiries can be directed to the corresponding author.
Author Contributions
JL, ZY, and HB contributed to conception and design of the overall study. SS performed data management related to the study. JY wrote the first draft of the manuscript. WL and SP wrote parts of the manuscript. NL was responsible for the guidance and gate-keeping of the subject. All authors contributed to manuscript revision, read, and approved the submitted version.
Funding
Foundation item: Supported by the Science and Technology Project of China Southern Power Grid.(“YNKJXM20191242”).
Conflict of Interest
JL, ZY, HB, WL, and SP were employed by the company China Southern Power Grid and SS was employed by the company Electric Power Research Institute of Yunnan Electric Power Grid Co., Ltd.
The remaining authors declare that the research was conducted in the absence of any commercial or financial relationships that could be construed as a potential conflict of interest.
Publisher’s Note
All claims expressed in this article are solely those of the authors and do not necessarily represent those of their affiliated organizations, or those of the publisher, the editors, and the reviewers. Any product that may be evaluated in this article, or claim that may be made by its manufacturer, is not guaranteed or endorsed by the publisher.
References
Alonso, M., Amaris, H., and Alvarez-Ortega, C. (2012). A Multiobjective Approach for Reactive Power Planning in Networks with Wind Power Generation. Renew. Energy 37 (1), 180–191. doi:10.1016/j.renene.2011.06.021
Cadenovic, R., Jakus, D., Sarajcev, P., and Vasilj, J. (2017). “Optimal Reconfiguration of Distribution Network Using Cycle-Break/genetic Algorithm,” in 2017 IEEE Manchester PowerTech (IEEE).
Cui, B., and Sun, X. A. (2017). A New Voltage Stability-Constrained Optimal Power Flow Model: Sufficient Condition, Socp Representation, and Relaxation. IEEE Trans. Power Syst. 33 (5), 5092–5102.
Duan, J., Sun, Q., and Chen, L. (2018). Optimal Operation of Distribution Network in Pursuit of High Effective Consumption of Distributed Wind Power. Wuhan, China: IEEE, 1659–1664.
Fei, L. I., Qiu, Z. M., Li, M. A., and Zhu, T. M. (2011). Overview on Algorithms of Distribution Network Reconfiguration Power System and Clean Energy. Power Syst. Clean Energy 27 (12), 76–80.
Galvan, E., Mandal, P., Tseng, T. L., and Velez-Reyes, M. (2015). “Energy Storage Dispatch Using Adaptive Control Scheme Considering Wind-PV in Smart Distribution Network,” in Proceedings of the 47th North American Power Symposium, Charlotte, NC, USA, 04-06 October 2015. doi:10.1109/naps.2015.7335157
Gao, F., Song, X. H., Zhang, Y., Li, J. F., Zhao, S. S., Ma, W. Q., et al. (2017). Active and Reactive Power Optimal Dispatch Associated with Load and Dg Uncertainties in Active Distribution Network. IOP Conf. Ser. Mat. Sci. Eng. 199, 012004. doi:10.1088/1757-899x/199/1/012004
Gao, Y., Peng, W., and Yu, N. (2018). “A Distributed Algorithm for Distribution Network Reconfiguration,” in 2018 China International Conference on Electricity Distribution (CICED), Tianjin, China, 17-19 September 2018.
Goodwin, A. L., Tucker, M. G., Cope, E. R., Dove, M. T., and Keen, D. (2006). Distribution Network Reconfiguration for Loss Reduction Using Ant Colony System Algorithm. Chennai, India: IEEE.
Kang, Q., Sheng, W., An, J., and Han, J. (2018). Power Economic Dispatching Subject to Dg Uncertainty via Bare-Bones Pso. J. Chin. Inst. Eng. 41 (6), 503–511. doi:10.1080/02533839.2018.1498025
Kayack, S. E., and Kocuk, B. (2021). An Misocp-Based Solution Approach to the Reactive Optimal Power Flow Problem. IEEE Trans. Power Syst. 36 (1), 529–532. doi:10.1109/tpwrs.2020.3036235
Kong, L., Dong, Y., Geng, R., Wu, X. A., and Zhao, W. (2018). Research on Multi-Objective Optimization Dispatching Scheme Based on High-Energy Load in 2018 China International Conference on Electricity Distribution (CICED), Tianjin, China, 17-19 September 2018.
Liao, J., Zhenkun, L. I., and Yang, F. U. (2018). “Economic Scheduling of Active Distribution Network Considering the Coordination of Resources,network and Loads,” in Proceedings of the CSU-EPSA.
Liu, J., Zhang, W., Zhou, R., and Zhong, J . (2012). Impacts of Distributed Renewable Energy Generations on Smart Grid Operation and Dispatch. San Diego, CA: IEEE.
Liu, K.-y., Sheng, W., Liu, Y., and Meng, X. (2017). A Network Reconfiguration Method Considering Data Uncertainties in Smart Distribution Networks. Energies 10 (5), 618. doi:10.3390/en10050618
Liu, S., Yu, W., Gao, W., Ke, L., and Yan, Z. (2016). “Multi-objective Optimization Dispatch of PV-MG Considering Demand Response Actions,” in 2016 35th Chinese Control Conference (CCC), Chengdu, China, 27-29 July 2016. doi:10.1109/chicc.2016.7553777
Liu, W. (2015). “Application of Firefly Algorithm of Solving Distribution Network Reconfiguration,” in 2015 4th National Conference on Electrical,Electronics and Computer Engineering(NCEECE 2015).
Liu, X., Liu, P., Hui, X., Zheng, H., and Yong, Y. (2014). “Research on Grid-Connected and Economy of Distributed Wind Power Generation,” in 2014 17th International Conference on Electrical Machines and Systems (ICEMS), Hangzhou, China, 22-25 October 2014.
Liu, Y., Wenchuan, W. U., Zhang, B., Zhengshuo, L. I., and Zhigang, L. I. (2014). “A Mixed Integer Second-Order Cone Programming Based Active and Reactive Power Coordinated Multi-Period Optimization for Active Distribution Network,” in Proceedings of the CSEE.
Mahmud, N., and Zahedi, A. (2016). Review of Control Strategies for Voltage Regulation of the Smart Distribution Network with High Penetration of Renewable Distributed Generation. Renew. Sustain. Energy Rev. 64, 582–595. doi:10.1016/j.rser.2016.06.030
Martinez-Rojas, M., Sumper, A., Gomis-Bellmunt, O., and Sudrià-Andreu, A. (2011). Reactive Power Dispatch in Wind Farms Using Particle Swarm Optimization Technique and Feasible Solutions Search. Appl. Energy 88 (12), 4678–4686. doi:10.1016/j.apenergy.2011.06.010
Mishra, S., and Hota, A. P. (2018). “Allocating Loss with Network Reconfiguration in Radial Distribution Networks,” in 2018 International Conference on Recent Innovations in Electrical, Electronics & Communication Engineering (ICRIEECE), Bhubaneswar, India, 27-28 July 2018.
Mori, H., and Ikegami, H. (2016). Parallel Discrete EPSO for Distribution Network Reconfigurations. Singapore: IEEE.
Qi, F., Qu, H., Feng, D., Wang, J., and Sheng, H. (2020). “Multi-time Scale Active and Reactive Power Coordinated Dispatch on Distribution Network with Distributed Generators,” in 2020 5th Asia Conference on Power and Electrical Engineering (ACPEE).
Wang, P., and Liu, M. (2019). Day-ahead Dispatching Optimization of Active Distribution Network Considering Demand Respo. Electr. Power Sci. Eng. 19 (28), 152–158.
Wen, J., Tan, Y. H., and Jiang, L . (2018). Application of Hierarchical Encoding Scheme in Distribution Networks Reconfiguration. Arabian J. Sci. Eng. 44 (3), 2295–2304. doi:10.1007/s13369-018-3447-0
Yang, Y., Guan, X., Zhai, Q., Wu, J., and Lei, X. (2014). “Maximizing Renewable Energy Penetration through Distribution Network Reconfiguration Using Mixed-Integer Conic Programming,” in Pes General Meeting | Conference & Exposition.
Zhang, S., Sun, Y., Wei, Z., Sun, G., and Yichi, L. I. (2018). Day-ahead Optimal Scheduling for Active Distribution Network Considering Controllable Photovoltaic System via Probability Model. Power Syst. Technol. 42 (01), 247–257.
Zhou, H., Tang, F., Liu, D., Xiaoli, Y. E., and Zhao, T. (2016). Active Distribution Network Dynamic Reconfiguration and Dg Dynamic Control Strategy Considering Time-Variant Load. Power Syst. Technol. 40 (08), 2423–2430.
Keywords: dispersed wind power, economic dispatch, network reconfiguration, MISOCP, multi-objective cooperative optimization
Citation: Lei J, Yuan Z, Bai H, Su S, Yang J, Li W, Pan S and Liu N (2022) Economic Dispatch of Distribution Network With Dispersed Wind Power Considering Network Reconfiguration. Front. Energy Res. 10:942350. doi: 10.3389/fenrg.2022.942350
Received: 12 May 2022; Accepted: 13 June 2022;
Published: 11 July 2022.
Edited by:
Peng Li, Tianjin University, ChinaReviewed by:
Junjun Xu, Nanjing University of Posts and Telecommunications, ChinaHongjun Gao, Sichuan University, China
Copyright © 2022 Lei, Yuan, Bai, Su, Yang, Li, Pan and Liu. This is an open-access article distributed under the terms of the Creative Commons Attribution License (CC BY). The use, distribution or reproduction in other forums is permitted, provided the original author(s) and the copyright owner(s) are credited and that the original publication in this journal is cited, in accordance with accepted academic practice. No use, distribution or reproduction is permitted which does not comply with these terms.
*Correspondence: Nian Liu, bmlhbmxpdUBuY2VwdS5lZHUuY24=