
95% of researchers rate our articles as excellent or good
Learn more about the work of our research integrity team to safeguard the quality of each article we publish.
Find out more
ORIGINAL RESEARCH article
Front. Energy Res. , 10 October 2022
Sec. Sustainable Energy Systems
Volume 10 - 2022 | https://doi.org/10.3389/fenrg.2022.940883
This article is part of the Research Topic The Future of Energy Efficiency in Post-COVID-19 Era View all 33 articles
 Salmia Beddu1*Teh Sabariah Binti Abd Manan2
 Fadzli Mohamed Nazri3Nur Liyana Mohd Kamal1Daud Mohamad1Zarina Itam1
 Mushtaq Ahmad1*
The particle size (µm) of coal bottom ash displayed significant effects on the concrete engineering properties. This research aims to assess the improvement of engineering properties of concrete containing CBA (fineness: 75 and 100 µm) known as Mix 75 and Mix 100, and to optimize the percentage of coal bottom ash as supplementary cement materials in concrete. The physicochemical properties of coal bottom ash were analyzed using X-ray fluorescence, X-ray diffraction, particle size distribution (PSD), and a scanning electron microscope. The strength of concrete was determined based on workability and compressive and splitting tensile strengths. The concrete strength improvement was optimized by response surface methodology. The results of the study showed that coal bottom ash was rich in silicates based on the highest peak at 45°. The scanning electron microscope images showed that coal bottom ash has few cenospheres and components of irregular-shaped char particles. The splitting tensile strengths in 28 curing days gradually decreased with an increase in coal bottom ash. The optimal percentage of coal bottom ash in Mix 75 is equivalent to 6% within 45.4 curing days producing 40 MPa of compressive strength. Meanwhile, the optimal percentage of CBA in Mix 100 is equivalent to 12% within 56 curing days producing 50 MPa of compressive strength. The future works needed to extend the experimental observations are the economic analysis and effect of the greenhouse reduction on the usage of CBA in building infrastructure.
Coal bottom ash (CBA) is a component waste material of coal combustion produced by coal-generated power plants. It is rich in heavy metals (Beddu et al., 2020a; Kamal et al., 2019) and classified as scheduled waste (Cho et al., 2013; Odimegwu et al., 2018; Sun et al., 2020). Some of the Malaysian coal-generated power plants are Tanjung Bin in Johor Darul Takzim (2,100 MW), Jimah in Negeri Sembilan Darul Khusus (1,400 MW), Kapar in Selangor Darul Ehsan (2,420 MW), Manjung in Perak Darul Ridzuan (2,295 MW), Mukah (270 MW), PPLS (110 MW), and Sejingkat (100 MW) in Sarawak Bumi Kenyalang (Oh, 2010; Beddu et al., 2021). The electricity generations in Malaysia from these power plants produce CBA waste ranging from 9–250 tons/day (Beddu et al., 2020a), in addition to the other household waste generated about 19,000–3,000 ton/per day in Malaysia (Ahmad and Ayob, 2015). Concrete contains 12% ordinary Portland cement (OPC) and up to 80% of aggregate by mass (Muda et al., 2013; Ahmad et al., 2021a). Aggregate is any particulate material that can be either natural (gravel, crushed stone, and sand) (McNeil and Kang, 2013) manufactured (slag, a mixture of metal oxides and silicon dioxide from metal mining) (Ahmad et al., 2020), or recycled waste materials (recycled concrete (Jian and Wu, 2021) geosynthetic aggregates (Robinson and Howard, 2021), diapers polymers (Mohamad et al., 2017; Abd Manan et al., 2021a), and CBA (Yahya et al., 2017; Beddu et al., 2018)). Marine aggregate requires acid wash to remove sodium that will corrode the concrete structures (Wang et al., 2021). Aggregate from desserts has round grain structures due to wind erosion, and hence, it is incapable of binding to concrete. Therefore, aggregate mining from riverbeds and quarries was utilized at the rate of 10–11 billion ton per year contributing to adverse impacts on the environment (Abd Manan et al., 2019). The OPC is the binder material in concrete. CBA is commonly used as an aggregate instead of SCM due to its natural raw size similar to aggregate (Abd Manan et al., 2021a). To be used as SCM, CBA requires a grinding process to obtain the filler size. Nevertheless, CBA can be sieved to simulate the fineness of OPC. The physicochemical properties of CBA are in good association with OPC (Beddu et al., 2020b; Singh and Siddique, 2015), making it a good alternative material while maintaining and/or improving the engineering properties of concrete. Mass production of CBA as mentioned previously guarantees a sustainable construction material (i.e., aggregate and SCM) in the industry converting waste to green material. Table 1 presents comparison studies on concrete property improvements using CBA with the current research. The application of CBA was reported to be in terms of SCM (particle size: 45, 75, and 100 μm) and sand replacement material (particle size: 4.75 mm).
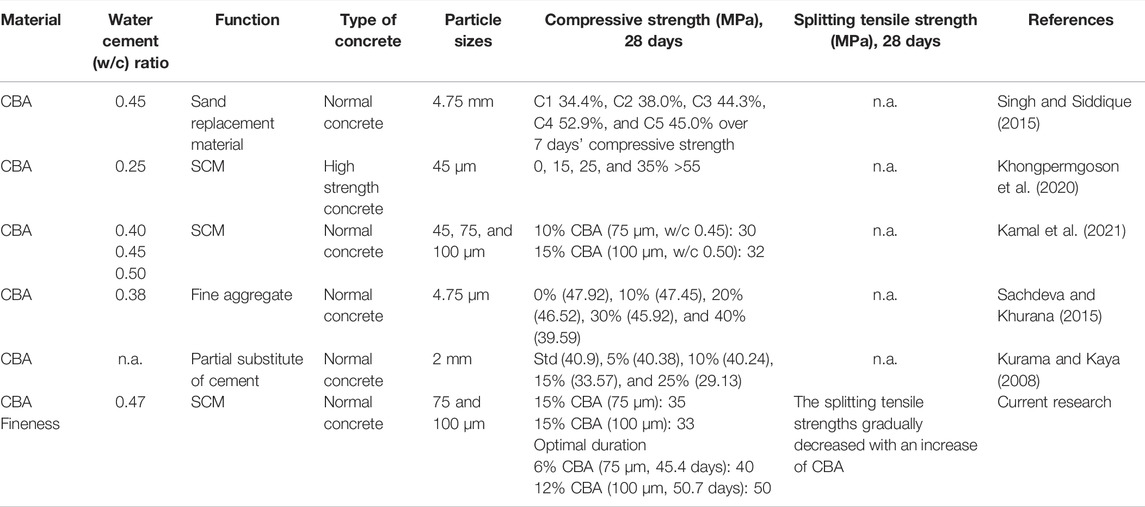
TABLE 1. Review studies on concrete properties.
Singh and Siddique (2015) applied CBA (w/c ratio: 0.55) at different volumes (C1: control mix, C2: 30% CBA, C3: 50% CBA, C4: 75% CBA, and C5: 100% CBA) as sand replacement material in normal concrete. The compressive strength improvement at 7 days was achieved at 94.6% (C2), 91.0% (C3), 86.3% (C4), and 84.8% (C5) more than the compressive strength of C1. The compressive strength improvement at 28 days was achieved at 34.4% (C1), 38.0% (C2), 44.3% (C3), 52.9% (C4), and 45.0% (C5) more than the compressive strength at 7 days. The exact figures on compressive strengths, however, are not mentioned. As sand replacement material, the particle size of CBA used was higher, equivalent to 4.75 mm. Khongpermgoson et al. (2020) used CBA (w/c ratio: 0.25) at different volumes (0, 15, 25, 35, and 45% of CBA) as SCM in high-strength concrete. The authors reported that the compressive strengths of 0%, 15%, 25%, and 35% CBA were more than 55 MPa. However, the compressive strength for 45% CBA was lower than 55 MPa. The CBA particle size was 45 μm. Kamal et al. (2021) studied the effect of CBA fineness (45, 75, and 100 μm) at different water-cement ratios (w/c: 0.40, 0.45, and 0.50) as SCM in normal concrete.
The optimal compressive strength obtained was 30 MPa (75 μm, w/c 0.45) and 32 MPa (100 μm, w/c 0.50) for 10% and 15% CBA, accordingly. In the application of high-strength concrete, the compressive strengths used by Khongpermgoson et al. (2020) (>55 MPa) and Mohamad et al. (2018) (50 and 61 MPa) were comparable regardless of the materials used. The compressive strength from CBA as SCM by Kamal et al. (2021) was 28 and 33 MPa. Sachdeva and Khurana (2015) investigated the BA as a sand replacement to produce an M40 concrete mix and investigated the compressive strength. The fine aggregates were replaced with coal BA by 10, 20, 30, and 40%. An obvious decrement was noted when BA was used up to 20%. Therefore, 20% is considered the optimum replacement percentage for this study. Kurama and Kaya (2008) observed that the compressive strength improved by 5% greater than the control concrete mixture at 56 days of curing.
The current research presents the effects of Malaysian CBA fineness on concrete property improvements. Compared to previous studies, the current research takeaway presents optimization studies of 15% CBA application (0.47 w/c, 75 and 100 µm of particle size) as SCM in concrete technology. In addition, concrete strength evaluation such as compressive strength in the current study was further explored with an addition of split tensile strength. This research is one of the concrete technology innovations promoting United Nations Sustainable Development Goals nos. 7 (affordable and providing clean energy) and 12 (responsible production and consumption) (Kurama and Kaya, 2008).
The CBA samples were collected from Malaysian power plant, oven-dried for 24 h, and ground and sieved to 75 and 100 μm. The material engineering properties of CBA including identification of oxides elements, crystallinity, particle size measurement, and observation of structural morphology of CBA were described by Abd Manan et al. (2021a). Our study complies with relevant institutional, national, and international guidelines and legislation.
The samples were prepared in triplicates for each heavy metal, oven-dried for 6 h to remove moisture, and ground and sieved to 45 and 75 µm. The sieved samples were prepared in pellet form using a pressed pellet technique. The physicochemical properties of ash samples were analyzed using X-ray fluorescence (XRF), X-ray diffraction (XRD), particle size distribution (PSD), and a scanning electron microscope (SEM). The XRF analysis (RaynyEDX-700/800, Shimadzu Corporation, Tokyo, Japan) was conducted to determine the chemical oxide content in BA. The XRD analysis was conducted using Xpert Pro PANalytical to determine the amorphous state of BA. The sample was prepared in powdered form. The PSD was carried out using a particle size analyzer. The structural composition of BA was observed and recorded using a SEM (ZEISS GeminiSEM 500, Oberkochen, Germany).
The mix design process was based on the method of the trial mix, the test mixes were prepared based on the Department of Environment (DOE, BS EN 12350-2) method guidelines European standard (2019; 12350), cited by Abd Manan et al. (2021b), and the result was taken from an average of three samples. The 28-day strength target was 30 MPa for various mixture groups. CBA was used with a maximum size of fine aggregates equivalent to 4.75-mm (ASTM C33/C33M). Sieve analysis tests (75 and 100 µm) were conducted on fine aggregates. Fine aggregates were dried in the oven for 24 h at 100°C before mixing in the concrete mixture. The mix ratio for CBA (mix 75: 75 µm and, mix 100: 100 µm) concrete including control mix (CM) is shown in Table 2. The blends have six different CBA percentages, which are 5, 10, 15, 20, 25, and 30%, respectively. These percentages were added to the experiment by referring to the trend of the previous study on cement replacement content.
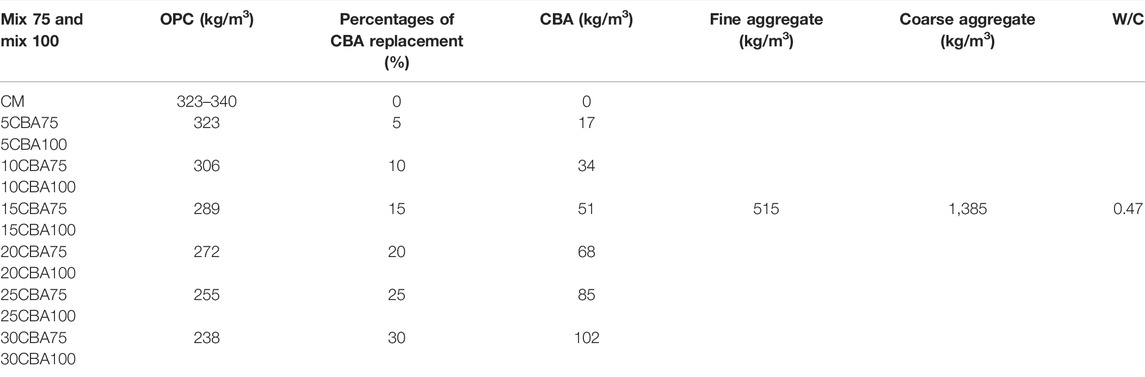
TABLE 2. Mix proportion for Mix 75 and Mix 100 CBA replacement.
The workability of the freshly made concrete mix was assessed via a slump test (BS-EN 12350-2:2009, slump cone). The goal for the slump test was 180 mm. The indication of workability is shown in Table 3.
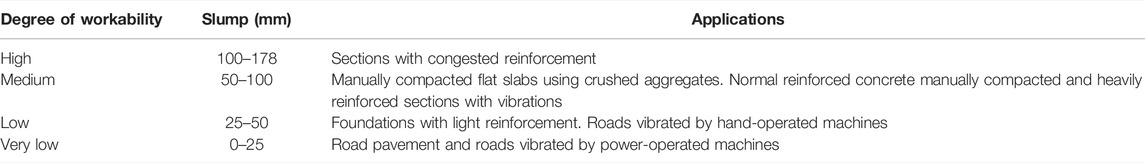
TABLE 3. Workability, slump, and applications.
The compressive strength (MPa, BS EN 12390-3:2002, cubes, 100 m3) and the splitting tensile strength (MPa, BS 1881: Part 117:1973, cylinders, 150 mm Ø × 300 mm high) of concrete were conducted using a universal testing machine (UTM).
Model optimization was conducted using a central composite design (CCD) with a second-order polynomial equation (Eq. 1) in RSM using the Design Expert® software (Version 12). Optimization is required to assess the link between process variables, namely, curing days (day) and CBA composition in concrete (%) with the response variable, compressive strength.
where
Y = predicted response variable
β = regression coefficient
k = number of factors or process variables in the experiment
e = random error.
The ranges of process variables [curing days (day) and CBA (%)] and coded factors [curing days: 3 (−1) and 56 (1); CBA: 0 (−1) and 30 (1)] are shown in Table 4. The percentages of errors between experimental and predicted values of compressive strengths were evaluated using Eq. 2.
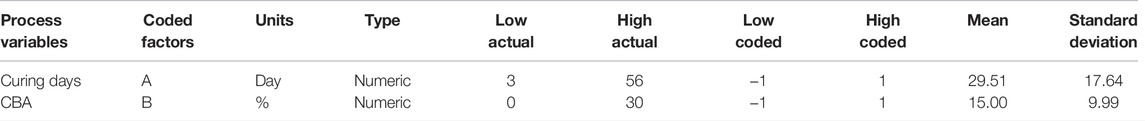
TABLE 4. Process variables and coded factors.
The physicochemical properties of ash samples were analyzed using X-ray fluorescence (XRF), X-ray diffraction (XRD), particle size distribution (PSD), and a scanning electron microscope (SEM).
The XRF analysis showed the chemical oxide content in OPC, FA, and CBA (45 and 75 µm), and the selected properties of FA (class F and class C according to ASTM 1994) (Table 5). The chemical oxides were silicon dioxide (SiO2), magnesium oxide (MgO), sulfur trioxide (SO3), calcium oxide (CaO), potassium oxide (K2O), aluminum oxide (Al2O3), and iron (II) oxide (FeO).
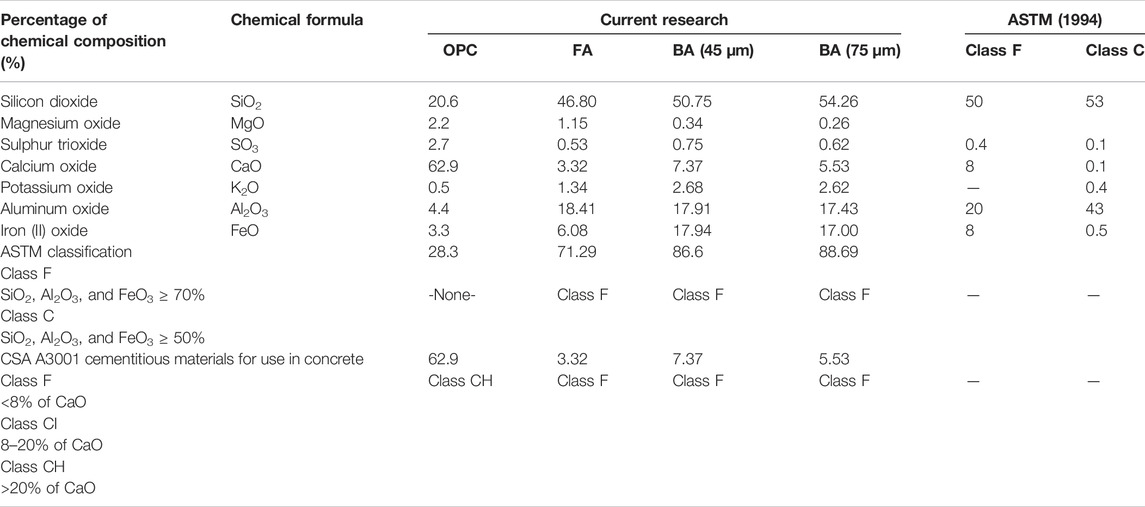
TABLE 5. Chemical oxide content in OPC, FA, and CBA (45 and 75 µm) and selected properties of FA (class F and class C according to ASTM 1994).
SiO2 is a metal oxide that is also known as silica or silox. It is a type of glass. It has a very low coefficient of expansion (similar to Pyrex glass) with low thermal conductivity (insulation properties for a semiconductor). The percentages of SiO2 obtained were 20.6% (OPC), 46.80% (FA), 50.75% (CBA, 45 µm), and 54.26% (CBA, 75 µm). In descending order, the highest SiO2 content was CBA (75 µm), followed by CBA (45 µm), FA, and OPC. It showed that the finer the particle size of CBA, the higher will be the SiO2 content.
Higher SiO2 content indicates higher resistance to expansion and the best insulation properties (poor thermal conductivity). It exhibits higher thermal shock resistance which is a leading example of energy-efficient concrete and building infrastructure with lower thermal conductivity.
MgO is also known as magnesia. It is a semiconductor with a rock-salt structure that has a wide valence band (∼6 eV) and a large dielectric constant (9.8) (George et al., 2021). Reactive MgO is used to solidify soil (Yi et al., 2013). MgO mineralizes carbon dioxide (CO2) and produces the hydrated magnesium carbonate species (formation of M-S-H gel), generating higher strength, lower permeability, and finer microstructure (Wang et al., 2019). MgO is also reported to be more efficient than hydrated lime used in concrete. It can function as an activator of ground granulated blast-furnace slag and FA used in cement or concrete pastes and soft soil solidification. The percentages of MgO obtained were 2.2% (OPC), 1.15% (FA), 0.34% (CBA, 45 µm), and 0.26% (CBA, 75 µm). Although there is no significant difference between the percentages of CBA and its particle size, MgO does exist in OPC, FA, and CBA in low concentration that ranged between 0.26 and 2.2%.
SO3 is produced from sulfur coal burned in coal-fired power plants. High SO3 content in FA causes efflorescence (deposits of salts) in concrete (Ríos et al., 2020). SO3 reacts with calcium hydroxide in normal concrete resulting in the cracking of the cement paste, affecting its durability (Mohammed et al., 2004). For this reason, the maximum SO3 content of cement or blended cement is regulated around the world (e.g., NCh 148, ASTM C989, ASTM C150, ASTM C10, ASTM C595, and IS 3812-1981) and restricted to 5% or less. The percentages of SO3 were 2.7% (OPC), 0.53% (FA), 0.75% (CBA, 45 µm), and 0.62% (CBA, 75 µm). The SO3 concentration is still below the permitted limit of 5%.
CaO is also known as quicklime. It is a type of property modifier, produced by the thermal decomposition of materials (e.g., limestone or seashells) that contain calcium carbonate (CaCO3). It has the ability to form solutions with silicates accelerating the phase separation of borosilicate glasses (Ahmad et al., 2019). It is also the main ingredient in OPC (Ahmad et al., 2018). The percentages of CaO were 62.9% (OPC), 3.32% (FA), 7.37% (CBA, 45 µm), and 5.53% (CBA, 75 µm).
K2O is an alkali metal oxide containing potassium and oxygen. It provides a wide variety of binding sites and adsorbate orientations. It is important for the adsorption of sulfur dioxide (SO2) from electricity generation. SO2 can be reduced via oxy-coal combustion. Potassium (K) has the highest SO3 binding strength (gaseous phase) through the formation of a sulfate (SO42−)-like molecule as compared to calcium (Ca), magnesium (Mg), and sodium (Na). K2O present in FA in lesser amounts ranged from 0–4% (weight percentages) Galloway et al. (2015). The percentages of K2O were 0.5% (OPC), 1.34% (FA), 2.68% (CBA, 45 µm), and 2.62% (CBA, 75 µm).
Al2O3 (also identified as aluminum (III) oxide) contains aluminum and oxygen. FA high in alumina content is needed to fabricate the ceramic tile (Ahmad et al., 2021a). It is an electrical insulator used as a substrate for integrated circuits (Khosla et al., 2021). The percentages of Al2O3 were 4.4% (OPC), 18.41% (FA), 17.91% (CBA, 45 µm), and 17.43% (CBA, 75 µm). In general, iron in coal mainly exists as pyrite (FeS2), and less as jarosite (KFe3(SO4)(OH) (Zeng et al., 2009) or siderite (FeCO3). Coal-bound pyrite accounts for over 90% (Ruan et al., 2020). During combustion, excluded pyrite is initially decomposed to pyrrhotite (FexS) which is further melted to an iron oxy-sulfide droplet (Müller et al., 2013). Magnetite (Fe3O4) and hematite (Fe2O3) are then crystallized out successively from the aforementioned melt; while included pyrite is directly decomposed into molten FeS, subsequently, it is either oxidized into FeO/Fe3O4/Fe2O3 step-by-step or incorporated into glassy particles with being gradually oxidized. The percentages of FeO were 3.3% (OPC), 6.08% (FA), 17.94% (CBA, 45 µm), and 17.00% (CBA, 75 µm). Most iron-rich coals are enriched by Si + Al elements (SiO2 + Al2O3 ≈ 60–70%) (Srinivasachar et al., 1990). The percentages of SiO2 + Al2O3 obtained were 25.0% (OPC), 65.21% (FA), 68.66% (CBA, 45 µm), and 71.69% (CBA, 75 µm). The FA and CBA originated from iron-rich coals.
The comparison of the chemical oxide content in OPC, FA, CBA (45 and 75 µm) and selected properties of FA (Class F and Class C according to ASTM 1994) is shown in Table 5. Class F is classified as pozzolan while class C is cement (ASTM C618). The classification is based on the sum percentages of SiO2, Al2O3, and FeO3 (ASTM C618). The sum percentages of SiO2, Al2O3, and FeO3 equivalent to ≥70% and ≥50% can be classified as class F and class C, accordingly. The reference percentages of chemical oxides in class F were 52% (SiO2), 0.8% (SO3), 5% (CaO), 2% (K2O), 23% (Al2O3), and 11% (FeO) (ASTM C618). The reference percentages of chemical oxides in Class C were 35% (SiO2), 41% (SO3), 21% (CaO), 0.7% (K2O), 18% (Al2O3), and 6% (FeO) (ASTM C618). Class C contains high percentages of SO3. The classification for OPC (28.3%) is none. The FA (71.29%) and BA (45 µm: 86.6%, and 75 µm: 88.69%) can be classified as class F. Another alternative for coal ash classification is based on the percentage of CaO content (CSA A3001 cementitious materials for use in concrete). The classifications are class F (<8% of CaO), class CI (8%–20% of CaO), and class CH (>20% of CaO) of FA. The classification for OPC (62.9%) is class CH. The FA (3.32%) and BA (45 µm: 7.37%, and 75 µm: 5.53%) can be classified as class F.
Figure 1 shows the XRD chromatogram for 1) 45 and 2) 75 µm of CBA. The 2θ scale is an angle between diffracted x-ray and an incident x-ray beam. A smooth gradual scatter indicates the fully amorphous material, while a flat and sharp peak of the graph scatters indicates a fully crystalline material.
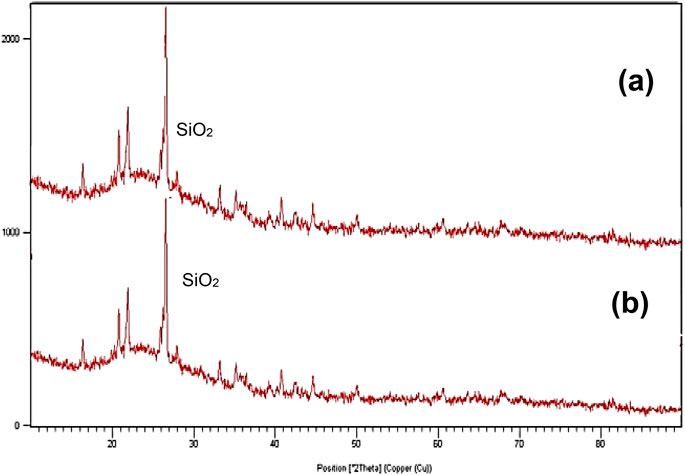
FIGURE 1. XRD analysis for (A) 45 and (B) 75 µm of CBA.
Sen (2014) reported that the types of crystalline elements that can be detected in the cenosphere are quartz (SiO2), rutile (TiO2), alumina (Al2O3), hematite (Fe2O3), dipotassium oxide (K2O), calcium oxide (CaO), sodium oxide (Na2O), magnesium oxide (MgO), sillimanite or aluminosilicate (Al2SiO5), and mullite or porcelainite (3Al2O32SiO2 or 2Al2O3SiO2). The CaO peak can be detected at 15°. The mullite can be detected at 15°, 25°, 33°, and 60°. SiO2 can be detected at 22°, 25°, and 42°. TiO2 can be detected at 25°. Al2SiO5 can be detected at 32°, 33°, 60°, and 75°. Al2O3 can be detected at 33° and 35°. K2O can be detected at 39° and 41°. CaO is marked at 39°. The Na2O peak is at 58°. The CaO peak is at 60°. The MgO peak at 75° (Sen, 2014). Phases with the same chemical composition can have drastically different patterns. The diffraction pattern of a mixture represents a combination of scattering of each phase. The curved line at the first 30° at the 2θ position represents glass (SiO2). Crystobalite (SiO2) at 22° and quartz (SiO2) at 26° (Banerjee et al., 2008). The calcium silicate (Ca2O4Si) (Hoy et al., 2018) akermanite (Ca2Mg(Si2O7), gehlenite (Ca2Al(AlSi)O7), melilite (Ca2(Al, Mg, Fe)((Al, Si, B)SiO7), and quartz (SiO2) can be detected at 45° (Thunuguntla and Gunneswara Rao, 2018). These elements are silicates.
The observed diffraction peaks for CBA were at 15°, 21°, 22°, 27°, 28°, 33°, 35°, 36°, 41°, 43°, 45°, and 50°. The crystalline compounds observed were mullite (15°), quartz (22°, 25°, and 42°), crystobalite (22°), TiO2 (25°), Al2SiO5 (33°), and Al2O3 (33° and 35°). The CBA were rich in silicates based on the highest peak at 45° indicating possible crystalline compounds such as Ca2O4Si, Ca2Mg(Si2O7), Ca2Al(AlSi)O7, Ca2(Al,Mg,Fe)((Al,Si,B)SiO7), and quartz (SiO2). Amorphous content is vital in concrete technology because it increases the material reactivation toward hydration (e.g., water retaining structure) and gives a positive effect on the strength and durability of concrete. If it is not reactive, it will act as a filler (Babat et al., 2016). The CBA samples contained both amorphous and crystalline compounds.
Figure 2 shows the PSD analysis for 45 and 75 µm of CBA. The 45 µm CBA showed a mean particle size of 27.91 µm. The finest size obtained was 8.48 µm. The coarser particle size obtained was 43.62 µm. The mean particle size of 75 µm CBA was 26.88 µm. The finest particle size obtained was 7.32 µm. The coarser particle size obtained was 58.52 µm.
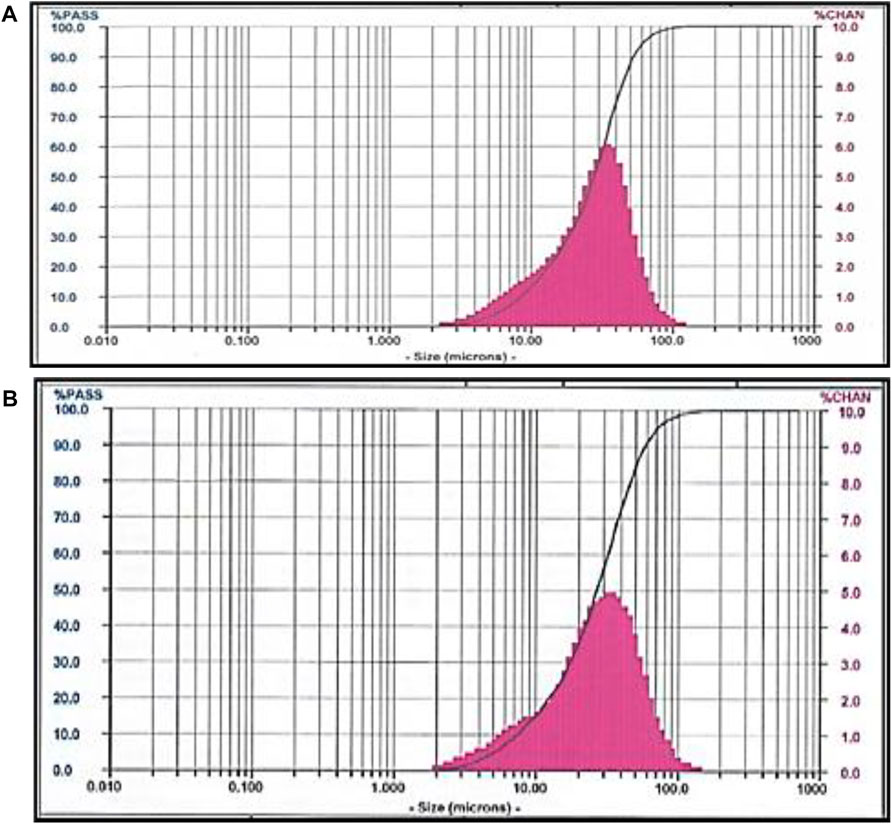
FIGURE 2. PSD analysis for (A) 45 and (B) 75 µm of CBA.
By comparing the time taken for the grinding process, ranging from 15–39 min, it was shown that CBA with a grinding period of 15 min had an optimal particle size distribution, while CBA with a grinding period of more than 15 min was observed to have an even particle distribution with a sufficient number of fine particles of less than 125 μm, which had a positive impact on the concrete particle packing and on improving the concrete properties (Bajare et al., 2013). The data obtained showed a uniform particle distribution, which did not exceed the 5% average limitation established in the ASTM C618 standard. The use of a partial cement replacement material with a particle size of 14.5 µm to fill the voids between the aggregate particles can reduce the volume of the voids to be filled with cement paste, thereby reducing the volume of the cement paste needed to produce concrete (Chen et al., 2014).
The SEM images for 45 and 75 µm of CBA under ×300 and ×100 magnifications are shown in Figure 3. FA contains many spherical and other variant structures such as ferrospheres, cenospheres, aluminosilicate spheres, plerospheres, sub-angular minerals (quartz/feldspars), and irregular-shaped char particles (Choudhary et al., 2020). The morphological components of FA and CBA will be relatively the same. The micromorphology observation of CBA in the current research showed that it has few cenospheres and components of irregular-shaped char particles scattered.
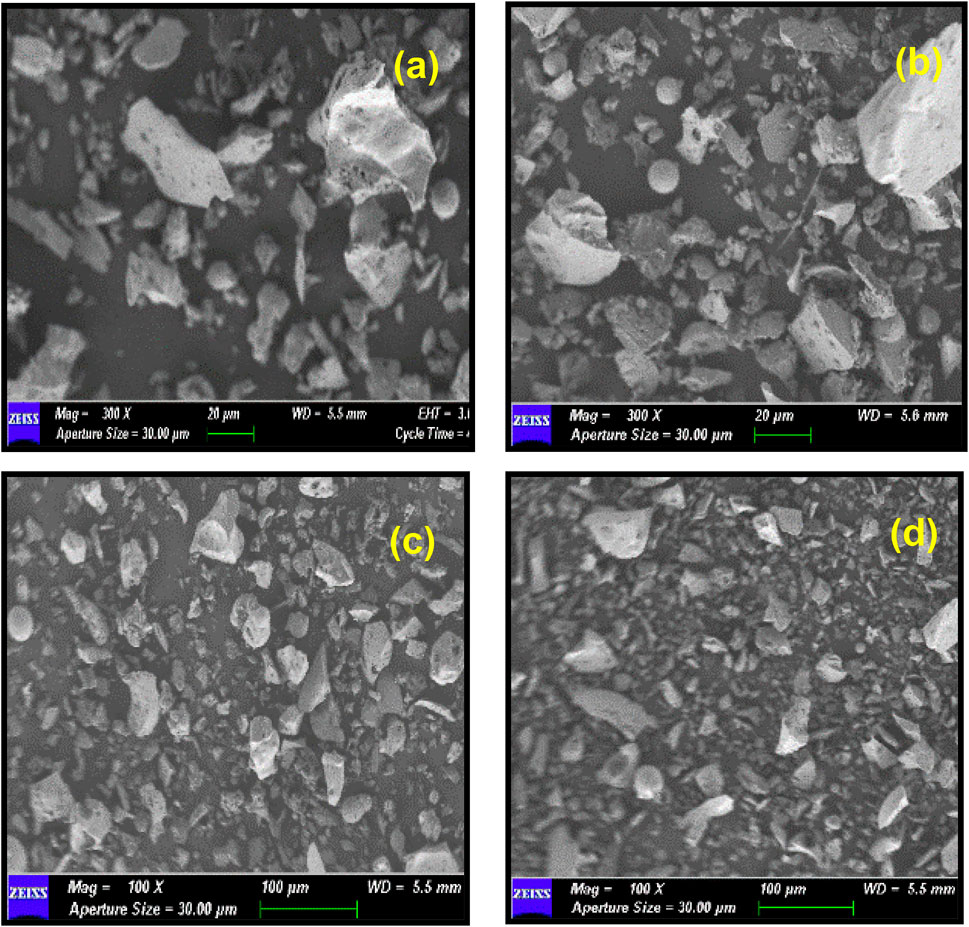
FIGURE 3. SEM images for 45 and 75 µm of CBA under ×300 (A,B) and ×100 (C,D) magnifications.
The workability characteristics of fresh concrete were used to determine its properties in this analysis. The percentages of CBA (%), slump (mm), and types of slumps for each mixture proportion are shown in Table 6. The CM (CBA0) has the highest slump equivalent to 180 mm indicating the high degree of workability. The slump type can be classified as collapse. Mixtures with a reference slump value of 180 mm were selected for this study, and the addition of CBA caused an almost 30% reduction (for 30% replacement) in slump values. The CBA naturally absorbed water in the mixture contributing to a higher reduction in workability and fresh mix density of concrete (Mangi et al., 2019). A superplasticizer was reported to contribute to the workability effect (Ovbeniyekede et al., 2018), similar to other porous materials such as BSA (Manan et al., 2018) and palm oil biomass clinker (Wan Ibrahim et al., 2017). The fineness of materials used as SCM or cement replacement materials is an indication of a bigger surface area for water absorption in the fresh concrete mix.
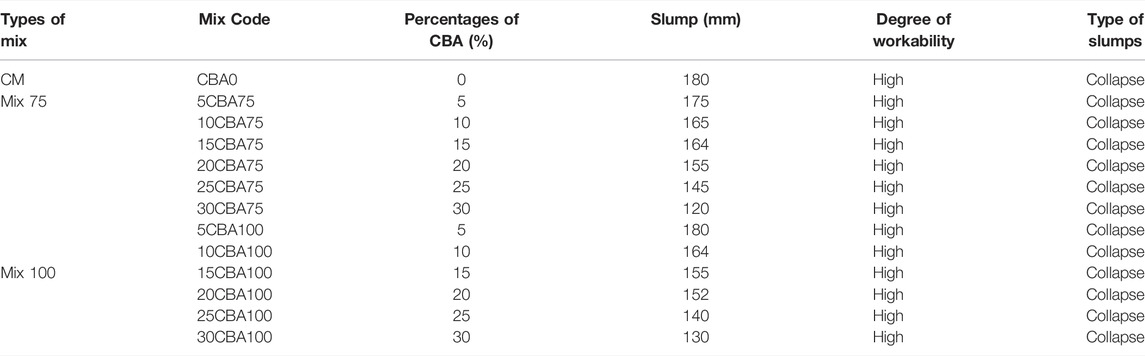
TABLE 6. Percentages of CBA (%), slump (mm), and types of slumps.
The percentages of CBA (%) and comparison of compressive strength (MPa) of the mortar are shown in Figures 5–6 and Figure 7 for 7, 14, 28, and 56 days, respectively, and the splitting tensile strength is shown in Figure 8. The compressive strengths for CM (CBA0) were 14.42 ± 0.52 MPa (3 days), 20.76 ± 1.13 MPa (7 days), 23.86 ± 1.19 MPa (28 days), and 31.61 ± 1.60 MPa (56 days). The compressive strengths of CM, Mix 75, and Mix 100 were observed to increase with curing days’ duration to 28 days. The strength values in 56 days have the same ranges of compressive strengths in 28 days. The compressive strength of concrete depends on the water-binder ratio, concrete age, type, and characteristics of the mix proportion. The higher percentage of water in the mix was observed to reduce the strength of concrete containing BA at early ages (below 28 days). The pozzolanic reactivity of BA particles contributes to the strength development at later ages (28 days and above). Calcium silicate hydrate (C-S-H) bond and calcium hydroxide [Ca(OH)2 or free lime] will be produced upon the reaction between cement and water producing cementitious properties. As for the concrete containing BA, the water will be quenched or utilized by the cement for hydration, gaining strength in the early days. Once the majority of the C-S-H gel is formed, the water then goes toward BA (Hashmi et al., 2021). This explains the slower mechanism of the improvement of strength at later ages (28 days and above) for concrete containing BA as compared to the control (concrete containing OPC).
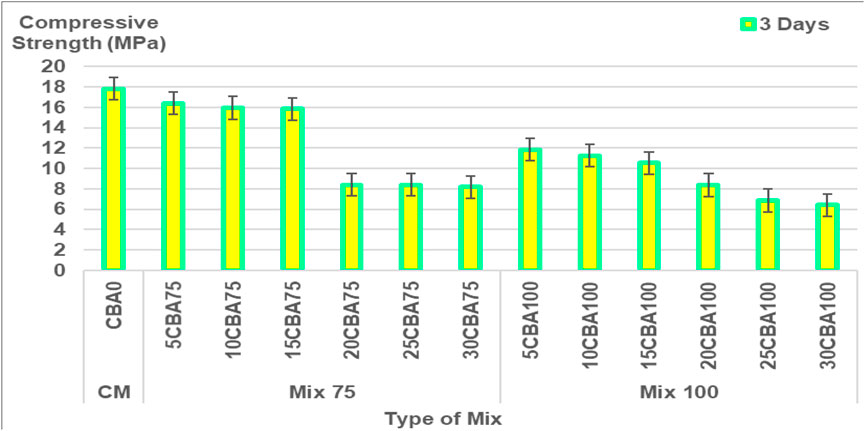
FIGURE 4. Compressive strength (MPa) of Mix 75 and Mix 100 at 3 days.
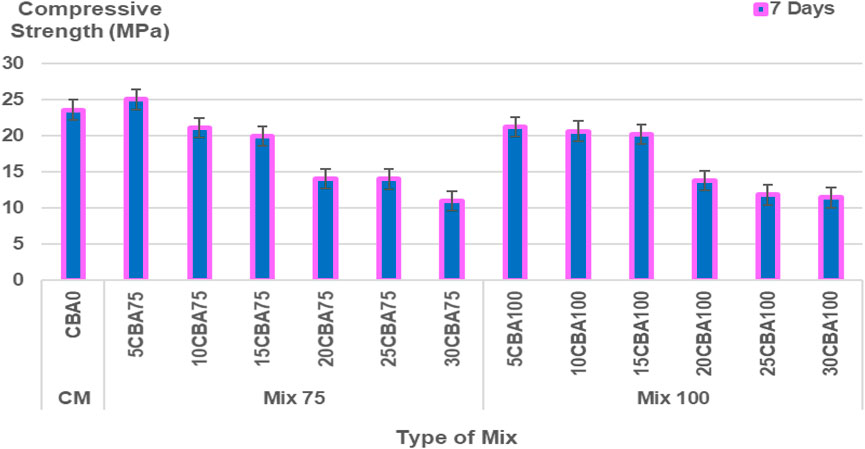
FIGURE 5. Compressive strength (MPa) of Mix 75 and Mix 100 at 7 days.
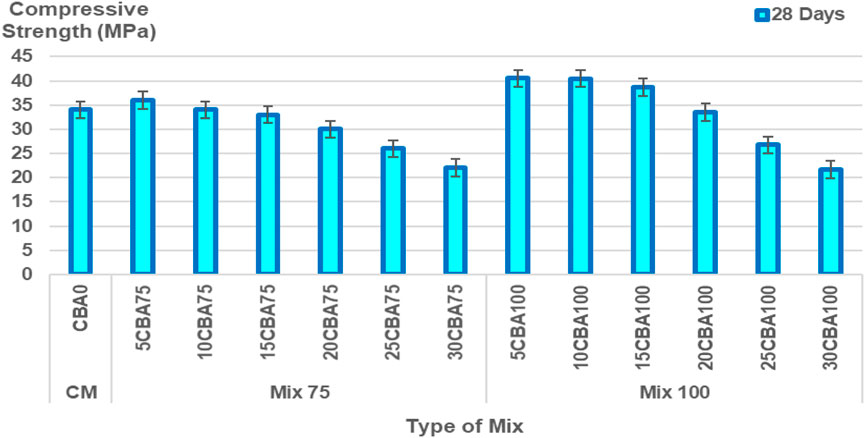
FIGURE 6. Compressive strength (MPa) of Mix 75 and Mix 100 at 28 days.
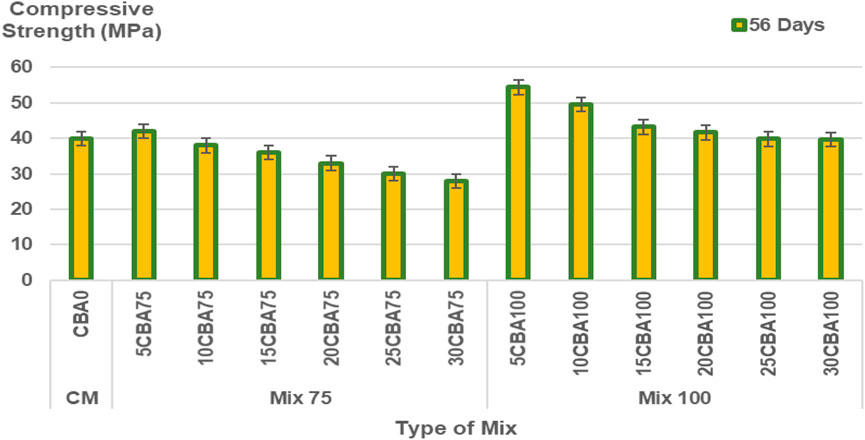
FIGURE 7. Compressive strength (MPa) of Mix 75 and Mix 100 at 56 days.
The splitting tensile strength (MPa) in 28 days was and the splitting tensile strengths gradually decreased with an increase of CBA. The highest splitting tensile strengths were obtained with 5% CBA for Mix 75 and Mix 100 with 3.60 MPa (5CBA75), and 2.95 MPa (5CBA100) of tensile strengths, accordingly. The splitting tensile strength (MPa) of CM, Mix 75, and Mix 100 in 28 curing days is shown in Figure 8.
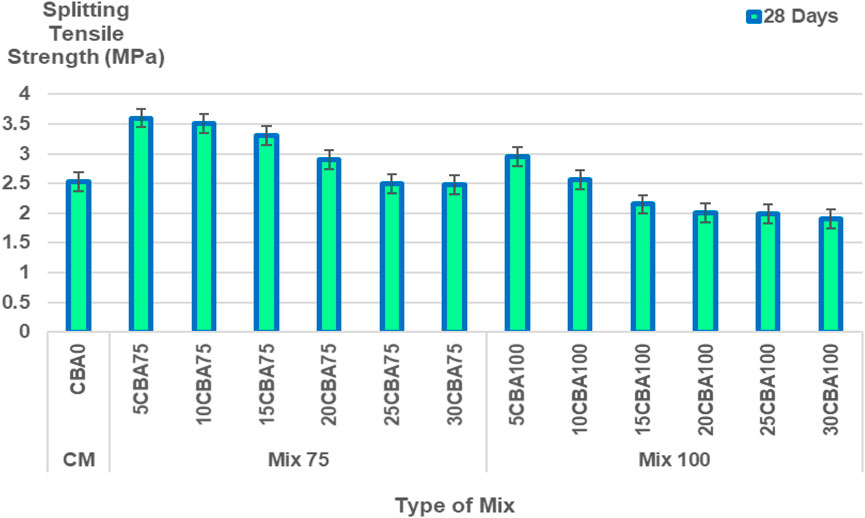
FIGURE 8. Splitting tensile strength (MPa) of CM, Mix 75, and Mix 100 in 28 curing days.
The design layout in RSM and the analysis of variance (ANOVA) for Mix 75 are shown in Tables 7, 8 and mix 100 is shown in Tables 9, 10. The two sets of 13 experimental runs in the RSM optimization, consisting of curing days (day), percentages of CBA (%), and compressive strengths (MPa) were executed using CCD. Model terms for every model Mix 75 and Mix 100 with any values of Prob > F less than 0.05 are classified as significant.
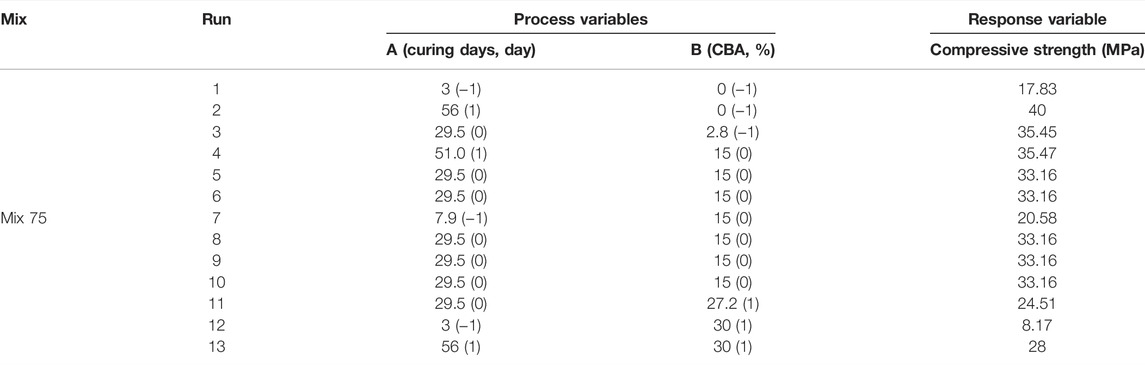
TABLE 7. Design layout in RSM and ANOVA for Mix 75.
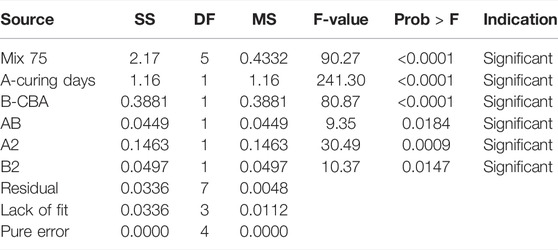
TABLE 8. ANOVA for the response surface quadratic model.
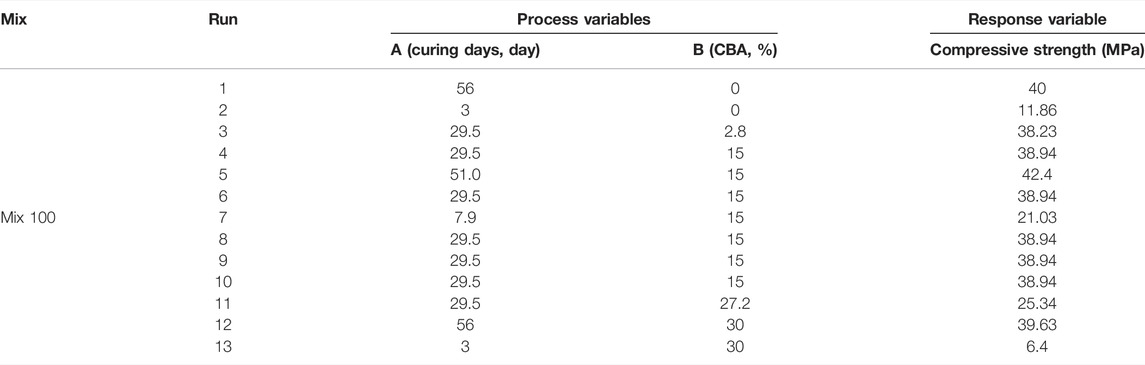
TABLE 9. Design layout in RSM and ANOVA for Mix 100.
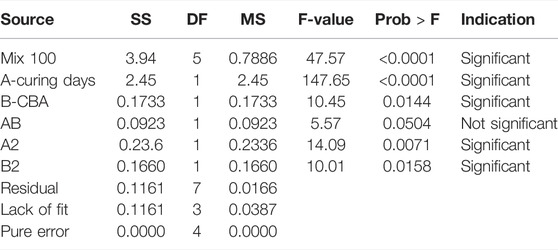
TABLE 10. ANOVA for the response surface quadratic model.
The β coefficients of actual factors for the Mix 75 quadratic model and model terms are 2.79437 (y-intercept), 0.40213A (A), −0.001253 (B), 0.000267 (AB), −0.000451 (A2), and 0.000821 (B2). Quadratic model Mix 75 and model terms A, B, AB, A2, and B2 are significant (p-value < 0.05) (Figure 9). The β coefficients of actual factors for the Mix 100 quadratic model and model terms for actual factors are 10.23191 (y-intercept), 1.10873 (A), 0.63574 (B), −0.010139 (A2), and −0.03115 (B2), and are shown in Fit summary in Table 11.
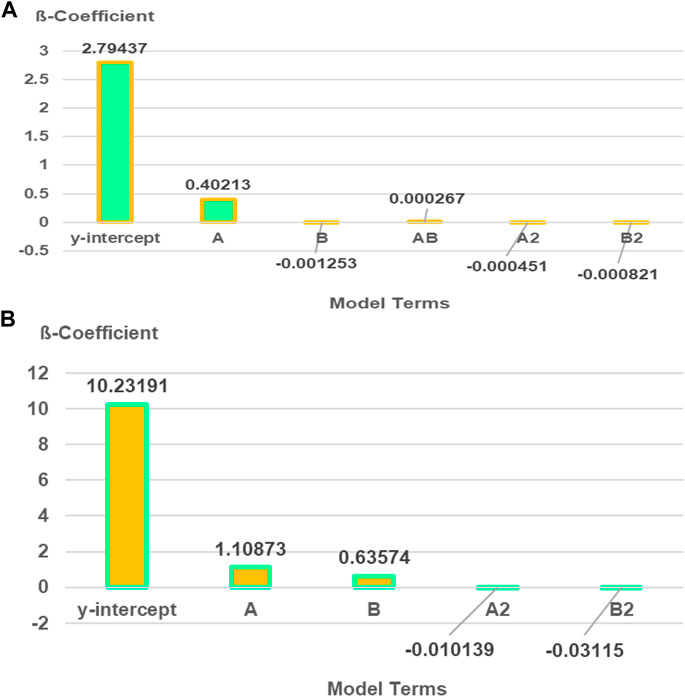
FIGURE 9. β coefficient of actual factors for quadratic models: (A) Mix 75 and (B) Mix 100.

TABLE 11. Fit summary results for Mix 75 and Mix 100.
Quadratic model Mix 75 and model terms A, B, A2, and B2 are significant (p-value < 0.05) (Figure 8). The significant regression parameters of predictive models (Mix 75 and Mix 100) in terms of actual factors are shown in Eqs 3, 4. Overall, the quadratic model is significant for optimization purpose (Table 10). The R2 (Mix 75: 0.9847 and Mix 100: 0.9714) represents the goodness of fit close to 1 (Ríos et al., 2020).
where,
A = curing Days.
B = CBA (%).
The patterns of predicted versus actual values’ plot and standard error designs for compressive strength are shown in Figure 10. The scatterplots were in a straight line showing a linear relationship and the proposed model terms were sufficient, and the constant variance assumption was verified. The standard error designs for Mix 75 and Mix 100 showed that the error is least in the middle of the contour equivalent to 0.5% compressive strength. In Mix 75, the ranges of CBA were from 10–20% and curing days from 20–40.1 days. In Mix 100, the ranges of CBA were from 10–24% CBA and curing days from 20–40.1 days.
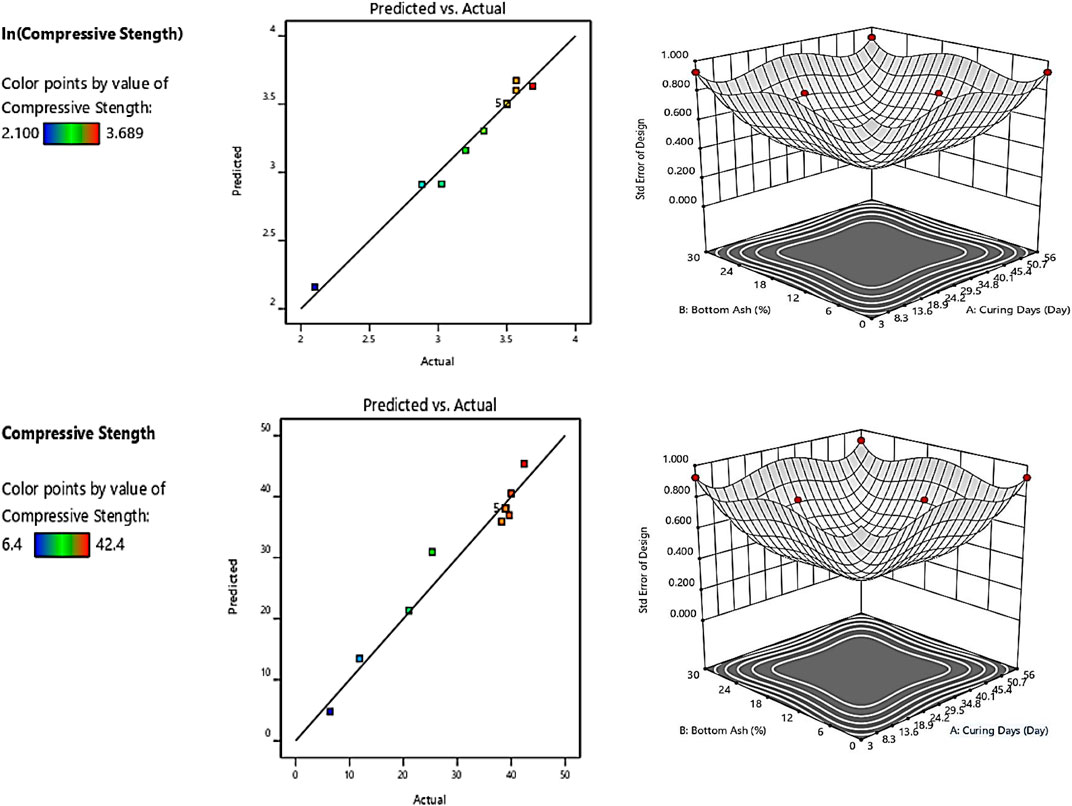
FIGURE 10. Predicted vs. actual values’ plot and standard error designs for compressive strength.
The contour plots model Mix 75 and Mix 100 for CBA (%), curing days (day), and compressive strength (MPa) are shown in Figure 11. In the optimization model Mix 75, curing days equivalent to 5 and below at all ranges of CBA (0%–30%) will produce a compressive strength below 20 MPa. Curing days between 5 and 18.9 days will produce a compressive strength in a range between 20 and 30 MPa. Curing days between 18.9 and 40.1 days will produce compressive strength between 30 and 40 MPa. The highest compressive strength (40 MPa) will be obtained at 45.4 curing days with 6% of CBA.
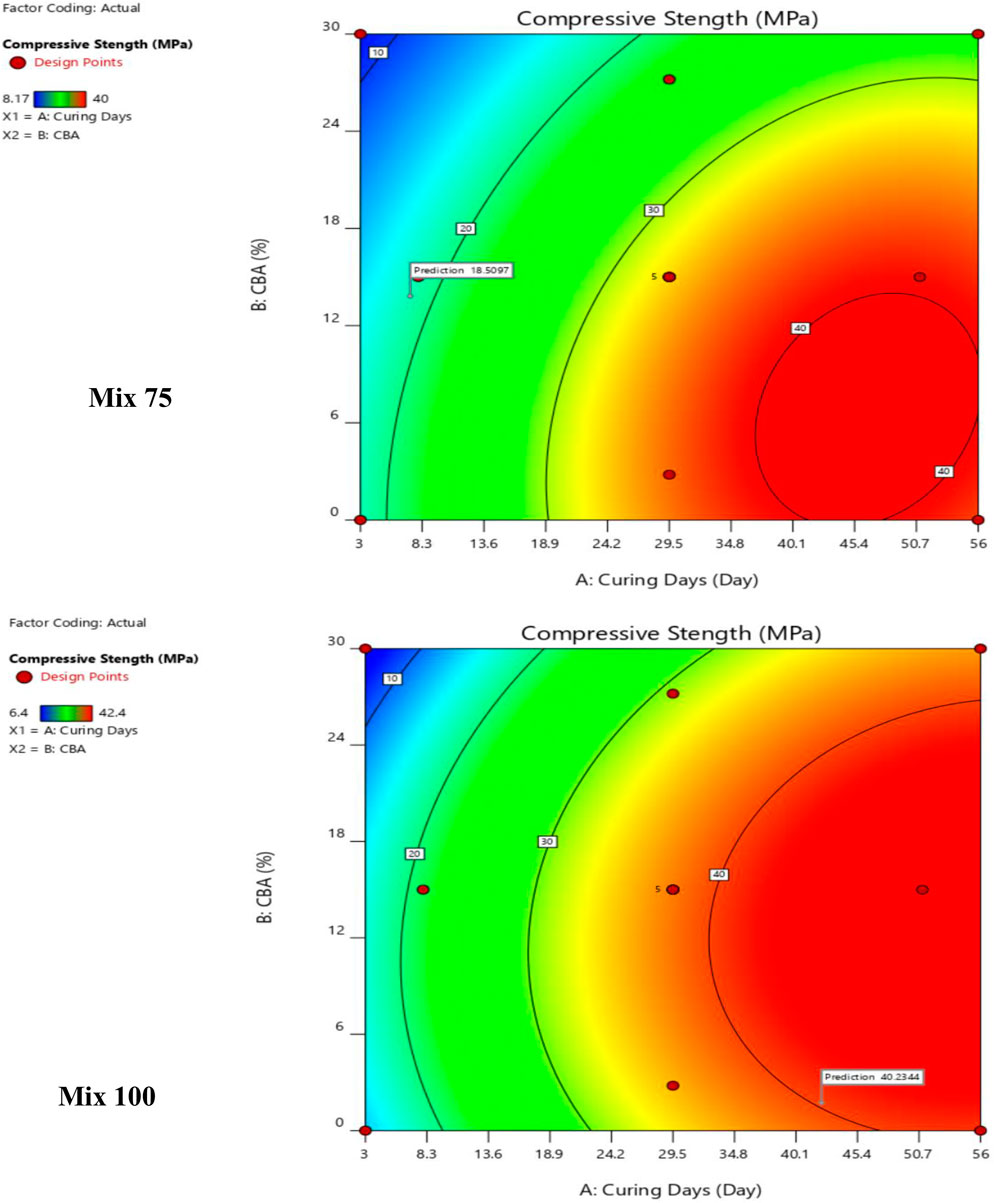
FIGURE 11. Contour plots for CBA (%), curing days (day), and compressive strength (MPa).
In the optimization model Mix 100, curing days from 3–13.6 days with 0–24% CBA will produce compressive strength ranging from 10–20 MPa. Curing days from 13.6–24.2 days with 0–24% CBA will produce compressive strength ranging from 20–30 MPa. Curing days from 24.2–45.4 days with 0%–30% CBA will produce compressive strength ranged from 30 to 40 MPa. Curing days from 29.5–56 days with 0%–24% CBA will produce compressive strength ranging from 40–50 MPa. Curing days from 50.7 days with 12% CBA will produce the highest compressive strength, 50 MPa. Table 9 shows the validation of the optimized model. In engineering applications, a variability of 20% of error percentage is often acceptable (Zhang et al., 2007; Baji, 2014). The period of 28 curing days was found to be the best duration for curing Mix 75 (for 5, 10, and 15% of CBA) and Mix 100 (for all percentages of CBA, 5, 10, 15, 20, 25, and 30%).
The percentages of error for Mix 75 were 3.53, 9.38, and 12.11% for 5CBA75, 10CBA75, and 15CBA75, respectively. Meanwhile, the percentages of error for Mix 100 were 11.81, 9.68, 7.35, 0.10, 11.22, and 12.43% for 5CBA100, 10CBA100, 15CBA100, 20CBA100, 25CBA100, and 30CBA100, respectively.
The period of 56 curing days was found to be the best duration for curing Mix 100 (10CBA100, 15CBA100, 20CBA100, and 25CBA100). The percentages of error for Mix 100 were 11.62, 0.34, 2.11, and 7.28% for 10CBA100, 15CBA100, 20CBA100, and 25CBA100, respectively. The compressive strengths for both Mix 75 (35 MPa, 75 μm, w/c 0.47, 15% CBA) and Mix 100 (33 MPa, 100 μm, w/c 0.47, 15% CBA) on the 28th day were comparable to compressive strengths reported by Kamal et al. (2021) (10% CBA, 75 μm, w/c 0.45: 30 MPa, 15% CBA, 100 μm, w/c 0.50: 32 MPa and Abd Manan et al. (2021b) 1% BSA, 75 μm, w/c 0.55: 28.77 ± 1.45 MPa, 2% CBA, 75 μm, w/c 0.55: 29.50 ± 1.45 MPa. However, compressive strength of high-strength concrete reported by Khongpermgoson et al. (2020) was higher, equivalent to more than 55 MPa for 0, 15, 25, and 35% CBA percentages (45 μm, w/c 0.25).
This research consisted of physicochemical properties of CBA using the technique of X-ray fluorescence (XRF), X-ray diffraction (XRD), particle size distribution (PSD), and a scanning electron microscope (SEM) and mechanical properties of the concrete strength properties (workability, compressive, and splitting tensile strengths), and optimization of concrete strength improvement using response surface methodology (RSM) has been investigated and findings are discussed. Coal bottom ash was collected from the Jimah Coal-Generated Power Plant located in Port Dickson, Negeri Sembilan Darul Khusus, Malaysia, oven-dried for 24 h, and ground and sieved to 75 and 100 μm. The XRF analysis showed the chemical oxide content in OPC, FA, and CBA (45 and 75 µm) and the selected properties of FA are shown in Table 12. The percentages of SiO2 obtained were 20.6% (OPC), 46.80% (FA), 50.75% (CBA, 45 µm), and 54.26% (CBA, 75 µm). It showed that the finer the particle size of CBA, the higher will be the SiO2 content. Higher SiO2 content indicates higher resistance to expansion and the best insulation properties (poor thermal conductivity). It exhibits higher thermal shock resistance. SO3 is produced from sulfur coal burned in coal-fired power plants. High SO3 content in FA causes efflorescence (deposits of salts) in concrete (Ríos et al., 2020). SO3 reacts with calcium hydroxide in normal concrete resulting in cracking of the cement paste, affecting its durability (Mohammed et al., 2004). Fly ash is high in Al2O3, which contains aluminum and oxygen. The FA is high in alumina content which is needed to fabricate the ceramic tile (Ahmad et al., 2021b). It is an electrical insulator used as a substrate for integrated circuits (Khosla et al., 2021).
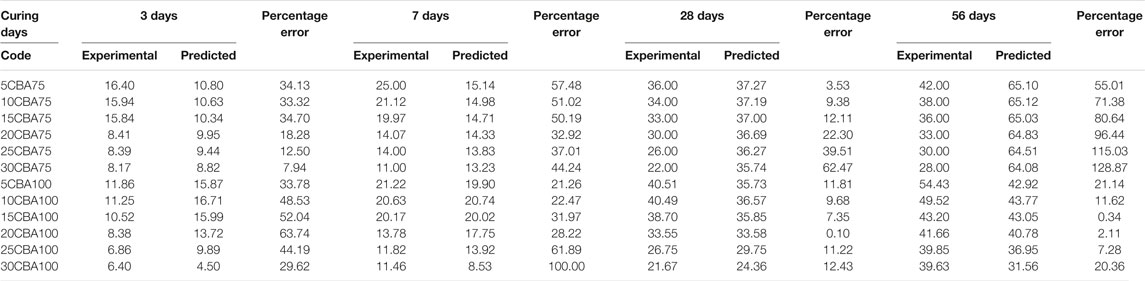
TABLE 12. Validation of the optimized model.
The SEM images for 45 and 75 µm of CBA under ×300 and ×100 magnifications found that FA contains many spherical and other variant structures such as ferrospheres, cenospheres, aluminosilicate spheres, plerospheres, sub-angular minerals (quartz/feldspars), and irregular-shaped char particles (Choudhary et al., 2020). The morphological components of FA and CBA will be relatively the same. The micromorphology observation of CBA in the current research showed that it has few cenospheres and components of irregular-shaped char particles scattered. The 45 µm CBA showed a mean particle size of 27.91 µm. The finest size obtained was 8.48 µm. The coarser particle size obtained was 43.62 µm. By comparing the time taken for the grinding process, ranging from 15–39 min, it was shown that the CBA with a grinding period of 15 min had an optimal particle size distribution, while the CBA with a grinding period of more than 15 min was observed to have an even particle distribution with a sufficient number of fine particles of less than 125 μm, which had a positive impact on the concrete particle packing and on improving the concrete properties (Bajare et al., 2013).
The workability characteristics of fresh concrete versus the percentages of CBA (%), slump (mm), and types of slumps for each mixture proportion found that CBA0 has the highest slump equivalent to 180 mm indicating a high degree of workability. The CBA naturally absorbed water in the mixture contributing to the higher reduction in workability and fresh mix density of concrete (Mangi et al., 2019). The compressive strength (MPa) of CM, Mix 75, and Mix 100 against 3, 7, 28, and 56 curing days indicated that compressive strength increased on the 28th day. The compressive strength of concrete depends on the water binder ratio, concrete age, type, and characteristics of the mix proportion. The pozzolanic reactivity of BA particles contributes to the strength development at later ages (28 days and above). Once the majority of the C-S-H gel is formed, the water then goes toward BA (Hashmi et al., 2021). This explains the slower mechanism of the improvement of strength at later ages (28 days and above) for concrete containing BA as compared to the control (concrete containing OPC). Response surface methodology (RSM) analysis of variance (ANOVA) for Mix 75 and Mix 100 indicating that model terms for every model Mix 75 and Mix 100 with any values of Prob > F less than 0.05 are classified as significant. The significant regression parameters of predictive models (Mix 75 and Mix 100) show that overall, the quadratic model is significant for optimization purpose. The established model for strength enhancement of concrete using CBA was statistically significant and showed that it adequately represented the design space. The established model can significantly assist in the application of CBA in construction industries.
This research consisted of the physicochemical properties of CBA (XRF, XRD, PSD, and SEM) and the strength properties (workability, compressive, and splitting tensile strengths) and optimization of concrete strength improvement using RSM. The particle size of CBA displayed significant effects on the concrete engineering properties and volume of CBA applied in the concrete. The slump type for Mix 75 and Mix 100 was classified as the collapse type. Although the workability of Mix 75 and Mix 100 was reduced with the addition of CBA, the degree of workability for both mixes was classified as high and suitable for sections with congested reinforcement.
Based on the ASTM 1994 classification, the FA (71.29%) and BA (45 µm: 86.6%, and 75 µm: 88.69%) can be classified as class F. CSA A3001 classification for OPC (62.9%) is class CH. FA (3.32%) and CBA (45 µm: 7.37%, and 75 µm: 5.53%) can be classified as class F. CBA was rich in silicates based on the highest peak at 45° indicating possible crystalline compounds observed on 45 and 75 µm CBA. The mean particle sizes of 45 and 75 µm CBA were 27.91 and 26.88 µm, respectively. The SEM images for 45 and 75 µm of CBA under ×300 and ×100 magnifications showed that CBA has few cenospheres and components of irregular-shaped char particles scattered.
The compressive strength of concrete increased with the number of curing days. The optimal percentage of CBA in Mix 75 is equivalent to 6% within 45 curing days producing 40 MPa of compressive strength. Meanwhile, the optimal percentage of CBA in Mix 100 is equivalent to 12% within 51 curing days producing 50 MPa of compressive strength. Based on the validation of the optimized model, the period of 28 curing days was found to be the best duration for curing Mix 75 (for 5, 10, and 15% of CBA) and Mix 100 (for all percentages of CBA, 5, 10, 15, 20, 25, and 30%). The period of 56 curing days was found to be the best duration for curing of Mix 100 (10, 15, 20, and 25% of CBA). The established model for strength enhancement of concrete using CBA was statistically significant and showed that it adequately represented the design space. The established model can significantly assist in the application of CBA in construction industries.
The limitation of the present study is the regulation by the Malaysian government in permitting the use of CBA in the construction industry. The future work needed to extend the experimental observations is the cost-benefit analysis and estimation of greenhouse effect reduction on the usage of CBA in the concrete.
The raw data supporting the conclusion of this article will be made available by the authors, without undue reservation.
Conceptualization, SB; Methodology, FMN, NLMK, and software, TSBAM validation, ZI formal analysis, DM; investigation, NLMK writing—original draft preparation, SB. TSBAM, project administration, SB; funding acquisition, SB and ZI formating and editing: MA.
The authors are thankful to Universiti Tenaga Nasional, Malaysia (Green Building Modelling By Utilizing Coal Combustion Product (CCP’s) As Material Replacement In Concrete For Tnb Substations -U-TG-RD-20-21; J510050002-IC-6 BOLDREFRESH2025-CENTRE OF EXCELLENCE; Optimization of Cenosphere Extraction from TNB Power Plant-Phase 1-U-TG-RD-20-23) for providing financial supports for this study.
The authors would like to thank Marzuki Bin Ismail from the Institute of Tropical Biodiversity and Sustainable Development, Universiti Malaysia Terengganu; Yusyawati Binti Yahaya (eXVzeWF3YXRpQHV0cC5lZHUubXk=) from Centralized analytical laboratory, Johan Ariff, Norhayama Ramli, Zaaba Mohammad, and Khairul Anuar Jamaluddin from Lab Services and Facilities Unit, Universiti Teknologi PETRONAS for the technical support.
The authors declare that the research was conducted in the absence of any commercial or financial relationships that could be construed as a potential conflict of interest.
All claims expressed in this article are solely those of the authors and do not necessarily represent those of their affiliated organizations, or those of the publisher, the editors, and the reviewers. Any product that may be evaluated in this article, or claim that may be made by its manufacturer, is not guaranteed or endorsed by the publisher.
Abd Manan, T. S. B., Beddu, S., Mohamad, D., Mohd Kamal, N. L., Itam, Z., Khan, T., et al. (2021a). Physicochemical Properties of Absorbent Hydrogel Polymers in Disposable Baby Diapers. Chem. Phys. Lett. 2021, 774138605. doi:10.1016/j.cplett.2021.138605
Abd Manan, T. S. B., Beddu, S., Mohamad, D., Mohd Kamal, N. L., Wan Mohtar, W. H. M., Khan, T., et al. (2021b). Physicochemical and Leaching Properties of Coal Ashes from Malaysian Coal Power Plant. Chem. Phys. Lett. 769, 138420. doi:10.1016/j.cplett.2021.138420
Abd Manan, T. S. B., Khan, T., Sivapalan, S., Jusoh, H., Sapari, N., Sarwono, A., et al. (2017). Application of Response Surface Methodology for the Optimization of Polycyclic Aromatic Hydrocarbons Degradation from Potable Water Using Photo-Fenton Oxidation Process. Sci. Total Environ. 665, 196–212. doi:10.1016/j.scitotenv.2019.02.060
Ahmad, M., Beddu, S., Binti Itam, Z., and Alanimi, F. B. I. (2019). State of the Art Compendium of Macro and Micro Energies. Adv. Sci. Technol. Res. J. 13 (1), 88–109. doi:10.12913/22998624/103425
Ahmad, J., Al-Dala’ien, R. N. S., Manan, A., Zaid, O., and Ahmad, M. (2020). Evaluating the Effects of Flexure Cracking Behaviour of Beam Reinforced with Steel Fibres from Environment Affect. J. Green Eng. 10, 4998–5016.
Ahmad, M., Al-Dala, R. N. S., Al-Dala'ien, R. N. S., Beddu, S., and Itam, Z. B. (2021a). Thermo-Physical Properties of Graphite Powder and Polyethylene Modified Asphalt Concrete. Eng. Sci. 17, 121–132. doi:10.30919/es8d569
Ahmad, M., Al-Dala’ien, R. N. S., Ali, J., Beddu, S. B., and Manan, A. (2021b). Straw Bale Installation on the Roof Top Green Projects Effects in the Indoor Building Temperature: Case Study Peshawar, Pakistan. J. Green Eng. 11, 122–140.
Ahmad, M., and Ayob, M. B. (2015). Improvement of Road Pavement Infrastructure by Using Polyethylen Terephthalate and Polypropylene. Int. J. Adv. Mech. Civ. Eng. 2 (3), 126–134.
Ahmad, M., Itam, Z. B., Beddu, S., Alanimi, F. B. I., and Soanathan, S. A. (2018). A Determination of Solar Heat Collection in Sepertine Copper and Rubber Pipe Embedded in Asphalt Pavement Using Finite Element Method. J. Eng. Appl. Sci. 13 (1), 181–189. doi:10.3923/jeasci.2018.181.189
Babat, S., Spörl, R., Maier, J., and Scheffknecht, G. (2016). Investigation of Deposit Formation and its Characterization for a Pulverized Bituminous Coal Power Plant. Fuel Process. Technol. 141, 225–234. doi:10.1016/j.fuproc.2015.10.001
Bajare, D., Bumanis, G., and Upeniece, L. (2013). Coal Combustion Bottom Ash as Microfiller with Pozzolanic Properties for Traditional Concrete. Procedia Eng. 57, 149–158. doi:10.1016/j.proeng.2013.04.022
Baji, H. (2014). The Effect of Uncertainty in Material Properties and Model Error on the Reliability of Strength and Ductility of Reinforced Concrete Members. Queensland: The University of Queensland. [Phd Thesis].
Banerjee, D., Suresh, K. G., and Nigam, A. K. (2008). Effect of Y Substitution on the Structural and Magnetic Properties of Dy1−xYxCo5 Compounds. J. Magnetism Magnetic Mater. 320, 374–378. doi:10.1016/j.jmmm.2007.06.011
Beddu, S., Abd Manan, T. S. B., Zainoodin, M. M., Khan, T., Wan Mohtar, W. H. M., Nurika, O., et al. (2020a). Dataset on Leaching Properties of Coal Ashes from Malaysian Coal Power Plant. Data brief 31, 105843. doi:10.1016/j.dib.2020.105843
Beddu, S., Ahmad, M., Ahmad, M., Mohamad, D., Imran bin Noorul Ameen, M., Itam, Z., et al. (2020b). Utilization of Fly Ash Cenosphere to Study Mechanical and Thermal Properties of Lightweight Concrete. AIMS Mater. Sci. 7 (6), 911–925. doi:10.3934/matersci.2020.6.911
Beddu, S., Zainoodin, M., Basri, A., Itam, Z., Ahmadi, R., and Abd Manan, T. S. (2021). The Potential of Cenospheres Production from Malaysian Coal Power plantsIOP Conference Series: Materials Science and Engineering. IOP Conf. Ser. Mat. Sci. Eng. 1101 (1), 012012. doi:10.1088/1757-899x/1101/1/012012
Beddu, S., Zainoodin, M., Kamal, N. M., Mohamad, D., Nabihah, S., and Nazri, F. M. (2018). Material Characterization of Coal Combustion Product (Cenosphere) Generated from Coal - Fired Power Plant in Malaysia. AIP Conf. Proc. 2030 (1), 020259. doi:10.1063/1.5066900
Chen, J. J., Kwan, A. K. H., and Jiang, Y. (2014). Adding Limestone Fines as Cement Paste Replacement to Reduce Water Permeability and Sorptivity of Concrete. Constr. Build. Mater. 56, 87–93. doi:10.1016/j.conbuildmat.2014.01.066
Cho, J. H., Eom, Y., Park, J.-M., Lee, S.-B., Hong, J.-H., and Lee, T. G. (2013). Mercury Leaching Characteristics of Waste Treatment Residues Generated from Various Sources in Korea. Waste Manag. 33 (7), 1675–1681. doi:10.1016/j.wasman.2013.04.004
Choudhary, N., Yadav, V. K., Malik, P., Khan, S. H., Inwati, G. K., R, S., et al. (2020). “Recovery of Natural Nanostructured Minerals,” in Handbook of Research on Emerging Developments and Environmental Impacts of Ecological Chemistry (New Jersey, USA: IGI Global), 450–470. doi:10.4018/978-1-7998-1241-8.ch021
Galloway, B. D., Sasmaz, E., and Padak, B. (2015). Binding of SO3 to Fly Ash Components: CaO, MgO, Na2O and K2O. Fuel 145, 79–83. doi:10.1016/j.fuel.2014.12.046
George, G., Senthil, T., Luo, Z., and Anandhan, S. (2021). “Sol-gel Electrospinning of Diverse Ceramic Nanofibers and Their Potential Applications,” in Electrospun Polymers and Composites (Sawston, United Kingdom: Woodhead Publishing), 689–764. doi:10.1016/B978-0-12-819611-3.00022-4
Hashmi, A. F., Shariq, M., and Baqi, A. (2021). An Investigation into Age-dependent Strength, Elastic Modulus and Deflection of Low Calcium Fly Ash Concrete for Sustainable Construction. Constr. Build. Mater. 283, 122772. doi:10.1016/j.conbuildmat.2021.122772
Hoy, M., Horpibulsuk, S., Arulrajah, A., and Mohajerani, A. (2018). Strength and Microstructural Study of Recycled Asphalt Pavement: Slag Geopolymer as a Pavement Base Material. J. Mater. Civ. Eng. 30 (8), 04018177. doi:10.1061/(ASCE)MT.1943-5533.0002393
Jian, S.-M., and Wu, B. (2021). Compressive Behavior of Compound Concrete Containing Demolished Concrete Lumps and Recycled Aggregate Concrete. Constr. Build. Mater. 272, 121624. doi:10.1016/j.conbuildmat.2020.121624
Kamal, N. L. M., Beddu, S., Syamsir, A., Mohammad, D., Itam, Z., Hamid, Z. A. A., et al. (2019). Immobilization of Heavy Metals for Building Materials in the Construction Industry - an Overview. Mater. Today Proc. 17, 787–791. doi:10.1016/j.matpr.2019.06.363
Kamal, N. L. M., Shafiq, N., Alaloul, W. S., Beddu, S., and Manan, T. S. B. A. (2021). “Application of Response Surface Methodology for the Optimization of Mix Design Concrete Using Coal Bottom Ash as Cement Replacement Material,” in Proceedings of the International Conference on Civil, Offshore and Environmental Engineering (Singapore: Springer), 396–404. doi:10.1007/978-981-33-6311-3_45
Khongpermgoson, P., Boonlao, K., Ananthanet, N., Thitithananon, T., Jaturapitakkul, C., Tangchirapat, W., et al. (2020). The Mechanical Properties and Heat Development Behavior of High Strength Concrete Containing High Fineness Coal Bottom Ash as a Pozzolanic Binder. Constr. Build. Mater. 253, 119239. doi:10.1016/j.conbuildmat.2020.119239
Khosla, R., Schwarz, D., Funk, H. S., Guguieva, K., and Schulze, J. (2021). High-quality Remote Plasma Enhanced Atomic Layer Deposition of Aluminum Oxide Thin Films for Nanoelectronics Applications. Solid-State Electron. 185, 108027. doi:10.1016/j.sse.2021.108027
Kurama, H., and Kaya, M. (2008). Usage of Coal Combustion Bottom Ash in Concrete Mixture. Constr. Build. Mater. 22 (9), 1922–1928. doi:10.1016/j.conbuildmat.2007.07.008
Manan, A., Ahmad, M., Ahmad, F., Basit, A., and Ayaz Khan, M. N. (2018). Experimental Investigation of Compressive Strength and Infiltration Rate of Pervious Concrete by Fully Reduction of Sand. CivileJournal 4, 724. doi:10.28991/cej-0309127
Manan, T. S. B. A., Kamal, N. L. M., Beddu, S., Khan, T., Mohamad, D., Syamsir, A., et al. (2021a). Strength Enhancement of Concrete Using Incinerated Agricultural Waste as Supplementary Cement Materials. Sci. Rep. 11 (1), 1–12. doi:10.1038/s41598-021-92017-1
Mangi, S. A., Wan Ibrahim, M. H., Jamaluddin, N., Arshad, M. F., and Shahidan, S. (2019). Performances of Concrete Containing Coal Bottom Ash with Different Fineness as a Supplementary Cementitious Material Exposed to Seawater. Eng. Sci. Technol. Int. J. 22 (3), 929–938. doi:10.1016/j.jestch.2019.01.011
McNeil, K., and Kang, T. H.-K. (2013). Recycled Concrete Aggregates: A Review. Int. J. Concr. Struct. Mater 7 (1), 61–69. doi:10.1007/s40069-013-0032-5
Mohamad, D., Beddu, S., Nabihah Sadon, S., Liyana Mohd Kamal, N., Itam, Z., Mohamad, K., et al. (20172017). Self-curing Concrete Using Baby Diapers Polymer. Indian J. Sci. Technol. 10, 1–7. doi:10.17485/ijst/2017/v10i4/110895
Mohamad, D., Beddu, S., Zahari, N. M., Zawawi, M. H., Syamsir, A., Radzuan, N., et al. (2018). The Performance of Diapers Polymer in Concrete as Self-Curing Agent in Term of Chemical Properties. AIP Conf. Proc. 2030 (1), 020186. doi:10.1063/1.5066827
Mohammed, T. U., Hamada, H., and Yamaji, T. (2004). Performance of Seawater-Mixed Concrete in the Tidal Environment. Cem. Concr. Res. 34 (4), 593–601. doi:10.1016/j.cemconres.2003.09.020
Muda, Z. C., Malik, G., Usman, F., Beddu, S., Alam, M. A., Mustapha, K. N., et al. (2013). Impact Resistance of Sustainable Construction Material Using Light Weight Oil Palm Shells Reinforced Geogrid Concrete Slab. IOP Conf. Ser. Earth Environ. Sci. 16 (1), 012062. doi:10.1088/1755-1315/16/1/012062
Müller, M., Schnell, U., and Scheffknecht, G. (2013). Modelling the Fate of Sulphur during Pulverized Coal Combustion under Conventional and Oxy-Fuel Conditions. Energy Procedia 37, 1377–1388. doi:10.1016/j.egypro.2013.06.014
Odimegwu, T. C., Zakaria, I., Abood, M. M., Nketsiah, C. B. K., and Ahmad, M. (2018). Review on Different Beneficial Ways of Applying Alum Sludge in a Sustainable Disposal Manner. CivileJournal 4 (9), 2230. doi:10.28991/cej-03091153
Oh, T. H. (2010). Carbon Capture and Storage Potential in Coal-Fired Plant in Malaysia-A Review. Renew. Sustain. Energy Rev. 14 (9), 2697–2709. doi:10.1016/j.rser.2010.06.003
Ovbeniyekede, O. S., Adenan, D. S. Q. A., Ahmad, M., and Kamaruddin, K. (2018). Water Absorption and Compressive Strength of Self-Compacting Concrete Incorporating Fly Ash and Quarry Dust. Ijsrp 8 (10), 377–384. doi:10.29322/IJSRP.8.10.2018.p8248
Ríos, A., González, M., Montes, C., Vásquez, J., and Arellano, J. (2020). Assessing the Effect of Fly Ash with a High SO3 Content in Hybrid Alkaline Fly Ash Pastes (HAFAPs). Constr. Build. Mater. 238, 117776. doi:10.1016/j.conbuildmat.2019.117776
Robinson, W. J., and Howard, I. L. (2021). Implications of Incorporating Geosynthetics in Airfield Pavements. Transp. Geotech. 28, 100533. doi:10.1016/j.trgeo.2021.100533
Ruan, R., Tan, H., Wang, X., and Hu, Z. (2020). Investigation on PM Formation from Combustion of Lignite with High Contents of AAEMs (Alkali and Alkaline Earth Metals) and Fe: Effect of the Reaction Temperature. J. Energy Inst. 93 (6), 2464–2473. doi:10.1016/j.joei.2020.08.004
Sachdeva, A., and Khurana, G. (2015). Strength Evaluation of Cement Concrete Using Bottom Ash as a Partial Replacement of Fine Aggregates. Int. J. Sci. Eng. Technol. 3 (6).
Sen, S. (2014). Physical Properties of Cenosphere. Rourkela, India: Department of Civil Engineering, National Institute of Technology. (M. Tech thesis).
Singh, M., and Siddique, R. (2015). Properties of Concrete Containing High Volumes of Coal Bottom Ash as Fine Aggregate. J. Clean. Prod. 91, 269–278. doi:10.1016/j.jclepro.2014.12.026
Srinivasachar, S., Helble, J. J., and Boni, A. A. (1990). Mineral Behavior during Coal Combustion 1. Pyrite Transformations. Prog. Energy Combust. Sci. 16 (4), 281–292. doi:10.1016/0360-1285(90)90037-4
Sun, H., Mohsin, M., Alharthi, M., and Abbas, Q. (2020). Measuring Environmental Sustainability Performance of South Asia. J. Clean. Prod. 251, 119519. doi:10.1016/j.jclepro.2019.119519
Thunuguntla, C. S., and Gunneswara Rao, T. D. (2018). Appraisal on Strength Characteristics of Alkali-Activated GGBFS with Low Concentrations of Sodium Hydroxide. Iran. J. Sci. Technol. Trans. Civ. Eng. 42 (3), 231–243. doi:10.1007/s40996-018-0113-4
Wan Ibrahim, M. H., Mangi, S. A., Burhanudin, M. K., Ridzuan, M. B., Jamaluddin, N., Shahidan, S., et al. (2017). Compressive and Flexural Strength of Concrete Containing Palm Oil Biomass Clinker and Polypropylene Fibres. IOP Conf. Ser. Mat. Sci. Eng. 271 (No. 1), 012011. doi:10.1088/1757-899X/271/1/012011
Wang, A., Lyu, B., Zhu, Y., Liu, K., Guo, L., and Sun, D. (2021). A Gentle Acid-Wash and Pre-coating Treatment of Coral Aggregate to Manufacture High-Strength Geopolymer Concrete. Constr. Build. Mater. 274, 121780. doi:10.1016/j.conbuildmat.2020.121780
Wang, D., Xiao, J., and Gao, X. (2019). Strength Gain and Microstructure of Carbonated Reactive MgO-Fly Ash Solidified Sludge from East Lake, China. Eng. Geol. 251, 37–47. doi:10.1016/j.enggeo.2019.02.012
Yahya, A. A., Ali, N., Mohd Kamal, N. L., Shahidan, S., Beddu, S., Nuruddin, M. F., et al. (2017). Reducing Heavy Metal Element from Coal Bottom Ash by Using Citric Acid Leaching Treatment. MATEC Web Conf. 103, 01004. doi:10.1051/matecconf/201710301004
Yi, Y., Liska, M., Akinyugha, A., Unluer, C., and Al-Tabbaa, A. (2013). Preliminary Laboratory-Scale Model Auger Installation and Testing of Carbonated Soil-MgO Columns. Geotech. Test. J. 36 (3), 20120052–20120393. doi:10.1520/GTJ20120052
Zeng, T., Helble, J. J., Bool, L. E., and Sarofim, A. F. (2009). Iron Transformations during Combustion of Pittsburgh No. 8 Coal. Fuel 88 (3), 566–572. doi:10.1016/j.fuel.2008.11.007
Keywords: Coal bottom ash, concrete strentgh properties, compressive strength, splitting tensile strength, physicochemical properties, Economical optimization
Citation: Beddu S, Abd Manan TSB, Mohamed Nazri F, Kamal NLM, Mohamad D, Itam Z and Ahmad M (2022) Sustainable Energy Recovery From the Malaysian Coal Bottom Ash and the Effects of Fineness in Improving Concrete Properties. Front. Energy Res. 10:940883. doi: 10.3389/fenrg.2022.940883
Received: 10 May 2022; Accepted: 02 June 2022;
Published: 10 October 2022.
Edited by:
Muhammad Mohsin, Jiangsu University, ChinaCopyright © 2022 Beddu, Abd Manan, Mohamed Nazri, Kamal, Mohamad, Itam and Ahmad. This is an open-access article distributed under the terms of the Creative Commons Attribution License (CC BY). The use, distribution or reproduction in other forums is permitted, provided the original author(s) and the copyright owner(s) are credited and that the original publication in this journal is cited, in accordance with accepted academic practice. No use, distribution or reproduction is permitted which does not comply with these terms.
*Correspondence: Salmia Beddu, U2FsbWlhQHVuaXRlbi5lZHUubXk=; Mushtaq Ahmad, bWFfNTA5OUB5YWhvby5jb20=
Disclaimer: All claims expressed in this article are solely those of the authors and do not necessarily represent those of their affiliated organizations, or those of the publisher, the editors and the reviewers. Any product that may be evaluated in this article or claim that may be made by its manufacturer is not guaranteed or endorsed by the publisher.
Research integrity at Frontiers
Learn more about the work of our research integrity team to safeguard the quality of each article we publish.