- 1Mechanical and Electrical Engineering College, Hainan University, Haikou, Hainan, China
- 2Hainan Curium Technology Co., Ltd, Haikou, China
- 3Engineering College, China Agricultural University, Beijing, China
Accurately predicting the Remaining Useful Life (RUL) of lithium-ion batteries is the key to the battery health management system. However, problems of unstable model output and extensive calculation limit the prediction accuracy. This article proposes a Particle Swarm Optimization Random Forest (PSO-RF) prediction method to improve the RUL prediction accuracy. First, the battery capacity extracted from the lithium-ion battery data set of the National Aeronautics and Space Administration (NASA) and the University of Maryland Center for Advanced Life Cycle Engineering (CALCE) is set as the battery life health factor. Then, a PSO-RF prediction model is established based on the optimal parameters for the number of trees and the number of random features to split by the PSO algorithm. Finally, the experiment is verified on the NASA and CALCE data sets. The experiment results indicate that the method predicts RUL with Mean Absolute Error (MAE) less than 2%, Root Mean Square Error (RMSE) less than 3%, and goodness of fit greater than 94%. This method solves the problem of parameter selection in the RF algorithm.
1 Introduction
With the rapid growth of technology, lithium-ion batteries have become the most perspective technology to meet the energy and power requirements of modern electric vehicles because of their advantages over traditional batteries. However, due to the complex chemical and physical changes in lithium-ion batteries, their performance will degrade or even fail, which may cause serious safety problems and significant financial losses (Pecht et al., 2013). Therefore, the online State of Health (SOH) evaluation and the Remaining Useful Life (RUL) prediction of lithium-ion batteries as two highly active fields of research in battery management systems are also hot and challenging issues in Prognostics and Health Management (PHM) (Li and Xu, 2015; Meng et al., 2019). Accurate RUL prediction can guide battery health management, battery replacement, and system maintenance to prevent significant losses by reason of battery failure or premature replacement to achieve preventative maintenance of the battery (Duong and Raghavan, 2018).
In recent years, people have conducted extensive research on the degradation mode of batteries and the RUL prediction (Wang et al., 2014), resulting in different prediction methods. These methods can be categorized into model-based methods (Chang et al., 2019) and data-driven methods (Zhou et al., 2016). The model-based method mainly includes the electrochemical (Deng et al., 2018) and equivalent circuit models (Yang et al., 2020a).
The electrochemical model approach establishes a degradation model by analyzing the influence of the internal structure of the battery, material properties, and other conditions to achieve the RUL prediction. The equivalent circuit model-based method uses the closed-loop format filter algorithm, in which the error between the predicted and the measured values will be fed back for correction. Duan (Duan et al., 2020) proposed a new Extended Kalman Particle Filter (EKPF) for the RUL prediction. The filter optimizes the PF algorithm with the Extended Kalman filter as the sampling density function. Li (Li et al., 2021) combined the least squares support vector machines (LSSVM) with the unscented particle filtering (UPF) to achieve the online prediction of RUL. Ma (Ma et al., 2021) used the autoregressive (AR) model to predict capacity. The predicted capacity was used to update the degradation model parameters of the particle filter algorithm to improve the prediction accuracy of RUL. However, such methods rely on accurate and complex battery capacity degradation models. In addition, due to the inherent characteristics of particle filtering, neither traditional particle filtering methods nor improved particle filtering methods can address the issues of particle degradation and impoverishment well. So it is difficult to predict the RUL of batteries accurately. Moreover, the complex equivalent structure requires abundant professional knowledge and relevant experience. These reasons lead to the fact that model-based methods are not widely used.
The data-driven method does not need to consider the electrochemical reaction process. It extracts the hidden information from the historical data of the lithium-ion battery to predict the RUL. These methods are mostly based on machine learning and deep learning, including Artificial Neural Networks (ANN) (Bai et al., 2014; Kang et al., 2014), Random Forest (RF) (Yang et al., 2008), Relevance Vector Machine (RVM)(Liu and Jianbao ZhouHaitao LiaoYu PengXiyuanPeng, 2015), and Support Vector Machine (SVM) (Klass et al., 2014; Patil et al., 2015). Li (Li et al., 2018) addressed an RF regression prediction algorithm for battery capacity estimation. This method analyzes various data sets measured by lithium-ion batteries in different working environments and extracts critical features from the current, voltage, and temperature curves. These features are used for model training to approach the lithium-ion battery RUL prediction. Ji (Ji et al., 2021) built a model combining monotonic echo state network (MESN) and self-adaptive differential evolution (SADE), and improves the prediction accuracy of RUL and can achieve online prediction. Yang (Yang et al., 2020b) elaborated a complex nonlinear battery dynamics model based on the Gradient-enhanced regression tree (GBRT) and predicted the RUL by extracting various battery characteristics. Zhang (Zhang et al., 2021) applied a mixed prediction algorithm that fuses Artificial Bee Colony (ABC), RF, and General Regression Neural Network (GRNN) to predict the RUL. The RF algorithm is used to calculate the importance of each feature in the feature space for ranking. Ardeshiri (Ardeshiri et al., 2022) employed the RF algorithm for optimal feature selection to filter unnecessary features. Then the combination of gated recurrent unit (GRU) and Least Squares Generative Adversarial Network (LSGAN) was used to improve the prediction accuracy. Lin (Lin et al., 2022) used constant current charging time (CCCT) to extract features and used RF to predict SOH. The result shows that prediction accuracy is improved but with reduced data utilization. However, the approach to selecting the optimal parameters of the RF algorithm still needs to be explored.
Long (Long et al., 2013) proposed a PSO algorithm and an improved AR model to predict the RUL of lithium-ion batteries with less error. Qin (Qin et al., 2015) expounded the PSO algorithm to obtain the Support Vector Regression (SVR) optimal parameters and established the PSO-SVR model. The model can reflect the global degradation trend and realize accurately RUL prediction. Mao (Mao et al., 2022) deduced the PSO algorithm to optimize the Back Propagation (BP) neural network to estimate the state of charge of the battery. The prediction result of this method is better than that of the BP neural network. Ren (Ren et al., 2021) applied the PSO algorithm to optimize the selection of parameters in the Long Short-term Memory (LSTM) neural network. The PSO algorithm is applied to optimize the hyper-parameters of LSTM. Yao (Yao et al., 2022) analyzed a PSO-ELM-RVM model to predict the RUL. The PSO algorithm was used to optimize the parameters of both the RVM and extreme learning machine (ELM) models.
The PSO algorithm is proven to exhibit good optimization ability. Therefore, this paper proposes a PSO-RF prediction method. This method uses the PSO algorithm to search the two optimal parameters of the RF algorithm (the number of trees and the number of random features for each split). The main contributions of this paper are: 1) The PSO algorithm is used to find the optimal parameters of the RF algorithm, which improves the accuracy of the prediction while ensuring robustness. 2) The PSO algorithm is introduced into the RF algorithm, which achieves the adaptive selection of parameters and improves the adaptability of the algorithm to different data sets. 3) Compared with the traditional RF algorithm and BP neural network algorithm, it is verified that the method proposed in this paper has higher accuracy and robustness for RUL prediction. The adaptability to different data sets has been improved simultaneously.
The following content of this paper is mainly divided into the following parts. Section 2 discusses the establishment process of the PSO-RF model in detail. Section 3 introduces the data source and processing method, verifies the feasibility of the PSO-RF algorithm, gives the prediction results, and compares the PSO-RF model with RF and BP neural networks. Section 4 completes a summary of the paper.
2 Establishment of PSO-RF model
2.1 PSO optimization principle
PSO is a stochastic global optimization technique. The PSO algorithm discovers the optimal region in the complex search space through the interaction between particles. At the beginning of the calculation, PSO will randomly generate a group of particles that meet the requirements and then iterate continuously to find the optimal global particles according to the optimal historical particles.
The velocity of the ith particle at k iterations is:
Where i = 1,2,3...m; d = 1,2,3...D, ω is the inertial parameter,
The location update equation is:
where
This paper adopts two methods to prevent the traditional PSO algorithm from falling into the local optimum in the optimization process. First, the inertia weight adopts a linear differential decline method to enhance the ability of local optimization in the later stage, as shown in Eq 3. Second, the acceleration factor adopts a linear adjustment method to make full use of particle cognition ability and searchability, as shown in Eqs 4, 5.
Where
2.2 RF algorithm
RF is a new machine learning method combining ensemble learning and decision tree. RF algorithms have been successfully applied to many different fields of classification and regression, such as wind forecasting (Lahouar and Slama, 2017), wheat biomass estimation (Wang et al., 2016), and spatial prediction of soil organic carbon (Filho et al., 2016). The RF algorithm has the advantages of excellent classification performance, minor parameter adjustment, high training efficiency, and less overfitting (Sun et al., 2019). In recent years, the RF model has been extensively used in the health prediction of lithium-ion batteries and RUL prediction of batteries and has achieved remarkable results.
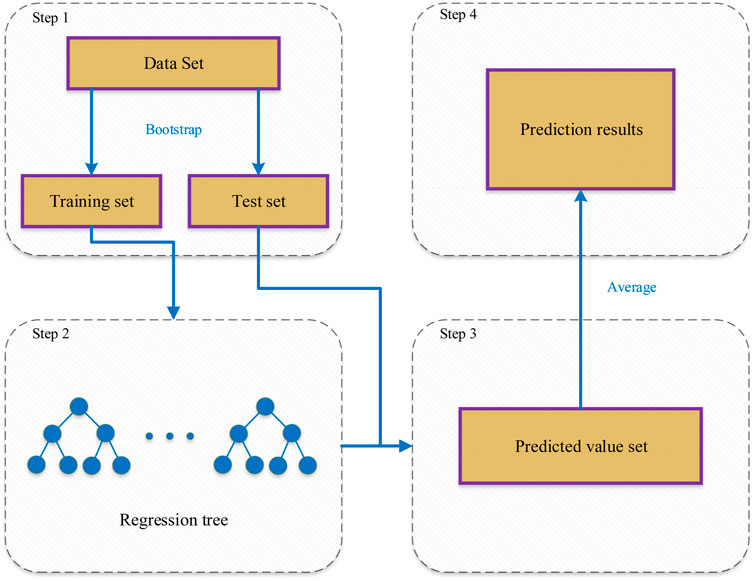
The fundamental idea of RF is the following. First, the Bootstrap sampling method randomly selects samples from the original data set and puts them back into the original data set. The extracted samples constitute the training set. Then use the Classification and Regression Trees (CART) method to build a classification tree or regression tree for each new sample set. Finally, the final prediction result is given based on the results of all the decision trees.
Let X stand for the input vector including m features with
(1) Assuming that there are N samples in the training set data, the Bootstrap sampling method extracts n samples from them to form a training subset. The subset is considered as the training sample of a single regression tree.
(2) Assuming that there are M features in the training subset, randomly select m features as the split feature subset (m ≤ M), and then use the CART algorithm to split without pruning.
(3) The predicted value for each regression tree can be obtained for the unknown test set using each regression tree to calculate the test set.
(4) The final prediction result of the RF model is achieved by averaging the prediction values of each regression tree.
2.3 PSO-RF algorithm
Li (Li et al., 2018) considered the influence of the number of trees and the number of random features to split when using the RF algorithm to predict battery capacity. The results show that adding optimization parameters of RF does not affect the final results. Therefore, this paper used the PSO algorithm to select these two parameters on its basis. They directly determine the accuracy of the RF algorithm Table 1. However, there is a lack of effective methods to guide the selection of RF parameters for the time being. Therefore, this paper selects the PSO algorithm to optimize the RF parameters.
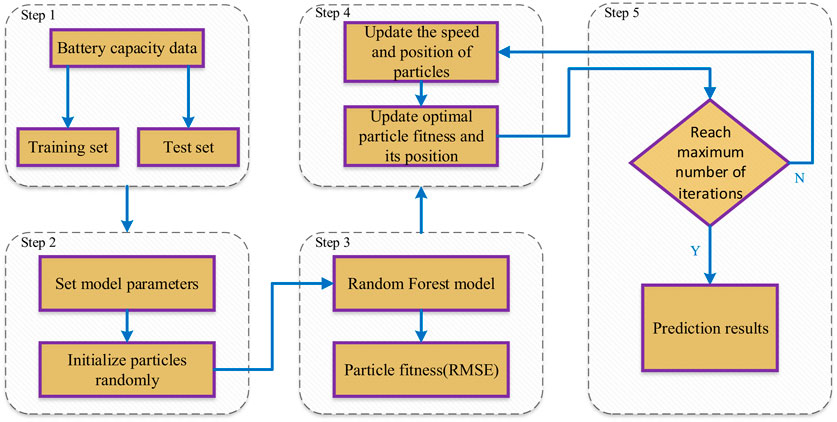
The main steps of the RF algorithm are as follows:
(1) Data processing: First, the battery capacity data is preprocessed and standardized. Lithium-ion battery capacity degradation data is a one-dimensional time series. The embedding theory is used to reconstruct the data set. The phase space reconstruction process with dimension d is as follows.
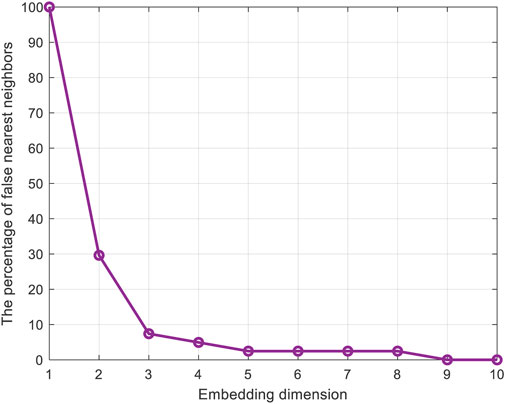
In order to determine the value of d, the false nearest neighbors method is used for verification (Kennel et al., 1992). The results are shown in Figure 2. When d = 9 the percentage of false nearest neighbors is 0. Therefore, d = 9 is chosen as the dimension of the reconstruction space. Therefore, the battery capacity data of the kth∼(k+8)-th cycle is used as input, and the battery capacity data of the k+9-th cycle is used as output.
(2) Model parameter setting: In the method proposed in this paper, the learning factors
(3) The RF model is established by the initialized particles. The training data is divided into n training sets, and m split features are extracted. The training sets are used to train to establish n regression tree models, and the test data is used to calculate n prediction results. The average of n predicted results is the final results. The root mean square error (RMSE) between the test samples and the results is the particle fitness. The fitness is defined as:
Also, the fitness is the objective function.
(4) Iteratively update the position and velocity of the particles according to Eqs 1–5 to update
(5) The iteration loop is terminated when the iteration count is reached. Obtain the optimal parameters
This paper mainly adopts the RMSE to assess the selection of
3 Result analysis and discussion
3.1 Data set
In this study, the PSO-RF method is validated using two sets of the RUL of lithium-ion battery data sets.
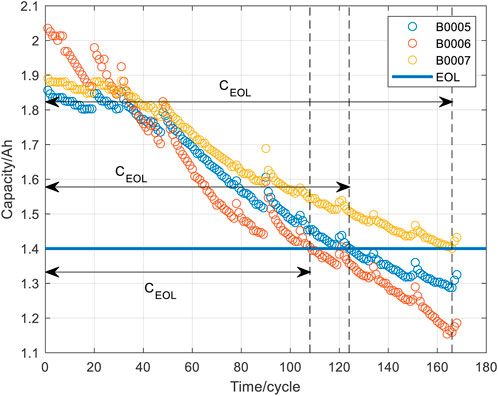
The RUL data set I of lithium-ion battery packages is achieved from the NASA-Ames Prediction Center of Excellence (PCOE) data warehouse. Three battery packages, B0005, B0006, and B0007, were elected to verify the proposed method. The rated capacity of the corresponding battery packages was 2Ah. The battery aging experiments were carried out at room temperature. The process follows: First, the constant current of 1.5A was applied to charge the battery. When the battery voltage reaches 4.2V, the charging ends. At another cycles, the constant voltage mode was applied to charge the battery. When the charging current dropped to 20mA, the charging was completed. Then, the battery packages corresponding to B0005, B0006, and B0007 were discharged in a constant current mode of 2A. The discharging ends when the battery voltage dropped to 2.7, 2.5, and 2.2V, respectively. The battery end-of-life (EOL) line is reached when the battery capacity degrades to 70% of the rated capacity. The correlation between the battery capacity, the number of cycles, and the end-of-life line are shown in Figure 4.
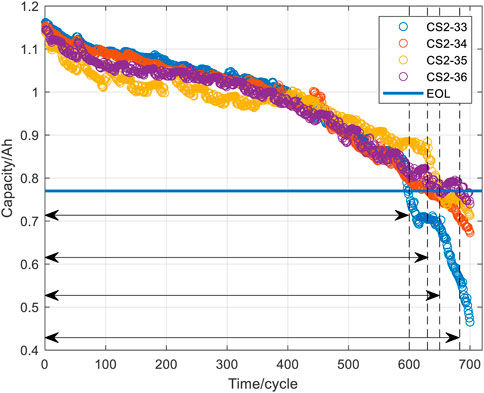
Data set II is the RUL data set from the CALCE. CS2-33, CS2-34, CS2-35, and CS2-36 were selected to verify the proposed method. First, the CS2 battery package was charged at a constant current rate of 0.5C. When the voltage reached 4.2V, it was charged with a 4.2V constant voltage. When the charging current drops to 0.05A, the charging ends. Then, CS2-33 and CS2-34 were discharged at a constant discharge current of 0.5C. CS2-35 and CS2-36 were discharged at a constant discharge current of 1C. The battery EOL line is set as 70% of the rated capacity. The correlation between the battery capacity, the number of cycles, and the end-of-life line are shown in Figure 5.
The description of the data sets I and data sets II is shown in Table 2.
The RUL refers to the number of cycles that the battery can carry out from the current moment to the end of life. In this paper, the battery reaches the end of life when the maximum usable capacity drops to 70% of the rated capacity. The calculation of RUL is shown in Eq 8:
where
3.2 PSO-RF model analysis
It is necessary to consider the effect of the number of iterations, the effect of the inertia weight, and the effect of the acceleration factor of the PSO algorithm. This paper analyzes the influence of the above factors in the data set AAA when the prediction starting point is 80.
3.2.1 The influence of the number of iterations
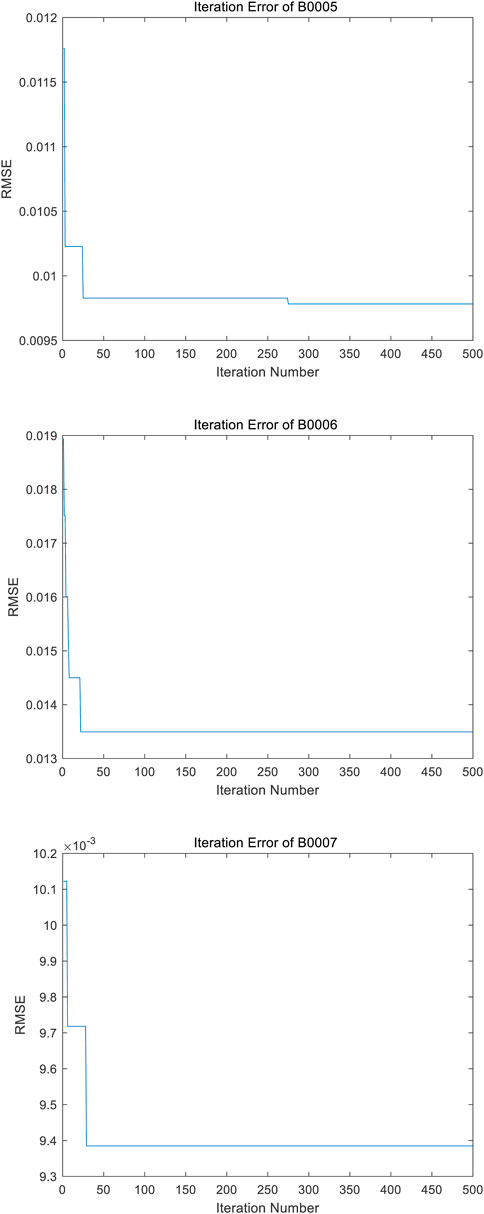
If the iteration count is too small, the accuracy of the battery life prediction will be affected. In contrast, a large number of iterations will increase calculation. Figure 6 shows the change of RMSE with the number of iterations as the independent variable. The RMSE of the data sets has stabilized within 50 generations and almost no longer decreased after that. Therefore, in this work, the iteration count of the PSO-RF model is selected to be 100.
3.2.2 The advantage of linear differential decreasing in inertia weight
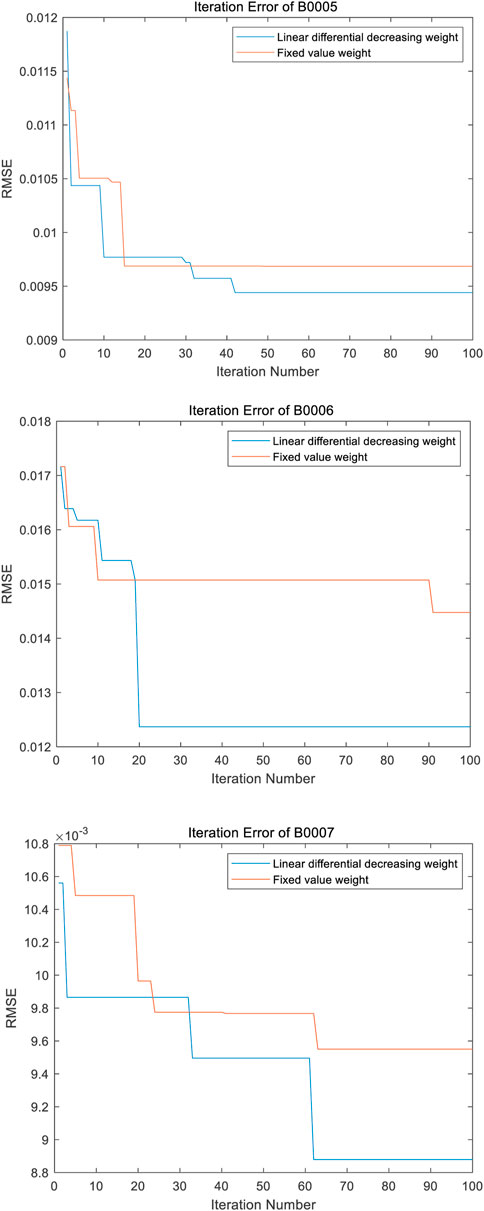
The inertia weight reflects the ability of a new generation of particles to inherit the speed of the previous generation. Through the analysis of the PSO algorithm, it can be concluded that it is helpful for global search when the inertia weight is more prominent. In contrast, a smaller inertia weight is helpful for local search. Compared with fixed inertial weight, linear differential decreasing inertial weight has a larger inertial weight in the early stage of the search, strengthening the global search ability and avoiding falling into the optimal global solution. In the later search stage, the linear differential decreasing inertia weight has a smaller inertia weight, which can enhance the local search ability. On the premise of finding the optimal global range, the optimal solution is more likely to be locked.
When the inertia weight adopts linear differential decrease and fixed weight ω = 0.65, the RMSE changes are shown in Figure 7. It can be obtained from the figure that the linear differential decreasing inertia weight can rapidly reduce the RMSE in the early search stage, and the final result is better than the fixed weight search method. Therefore, the linear differential decreasing inertia weight can seek the optimal solution and avoid falling into the optimal global so that the prediction has accurate results.
3.2.3 Advantages of linear adjusted acceleration factor
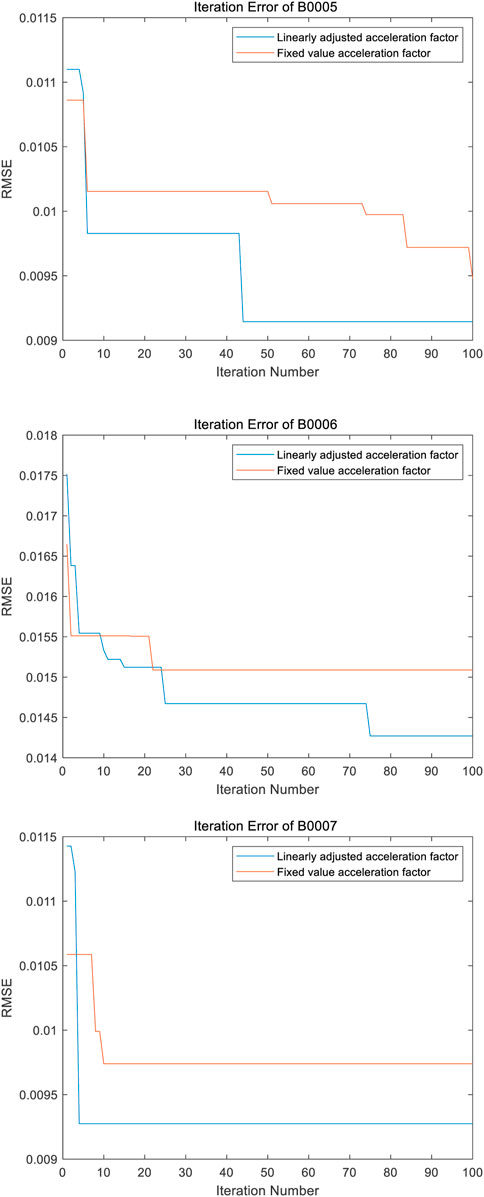
The acceleration factor
When the acceleration factor adopts a linear adjusted acceleration factor and fixed acceleration factors (
3.3 Performance evaluation tools
Three metrics are used in this work to evaluate the accuracy of PSO-RF model-generated predictions.
(1) Mean Absolute Error (MAE)
The MAE is the mean of absolute errors between predicted and observed values. It is defined by Eq 9: The smaller the MAE values, the more accurate the prediction result.
where n is the number of predicted samples,
(2) RMSE
The RMSE is used to describe the difference between prediction and observation value. RMSE is similar to MAE. But it punishes a greater absolute value by giving more weight than MAE. The variance of individual errors becomes more prominent with the increase in the difference between MAE and RMSE. RMSE is defined as
(3) Goodness-of-fit (
where n is the number of predicted samples,
3.4 Analysis of PSO-RF model prediction results
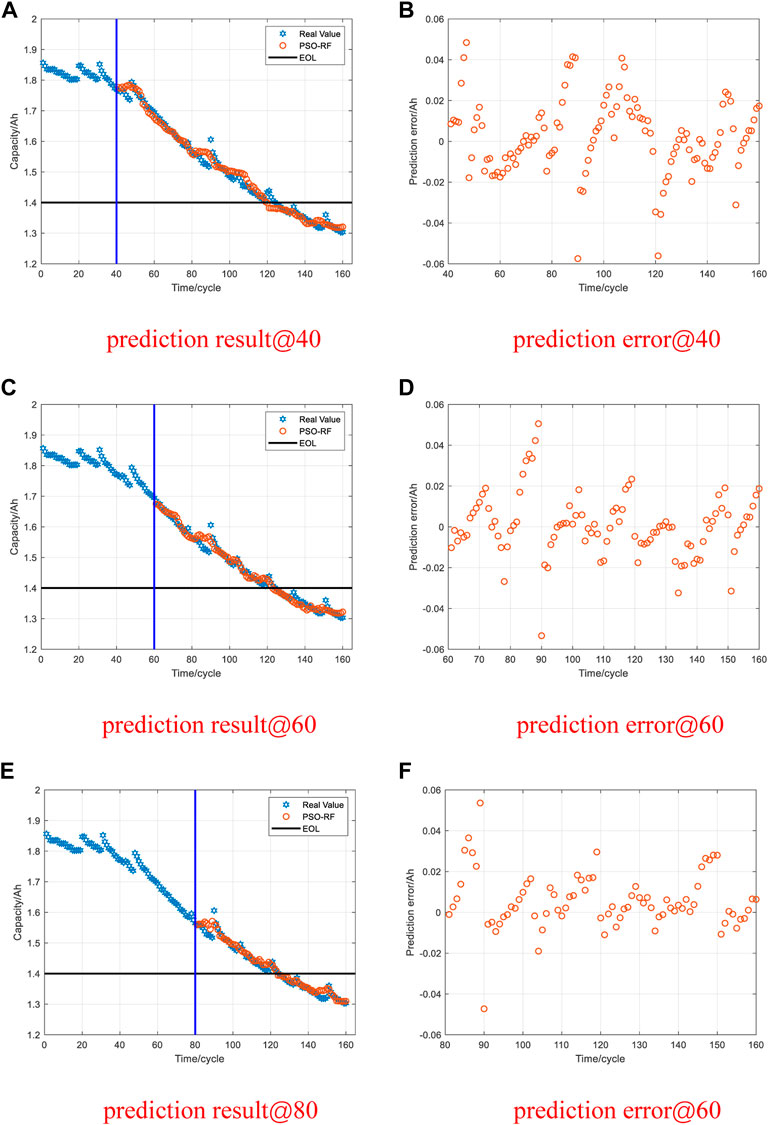
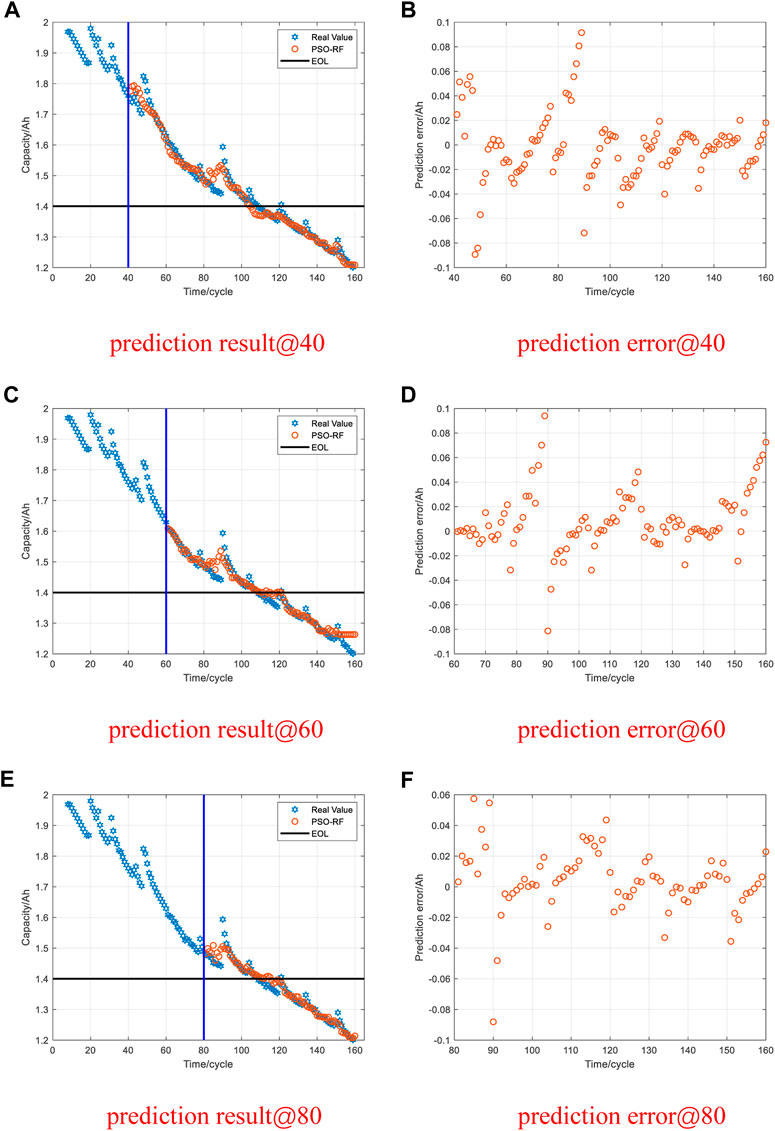
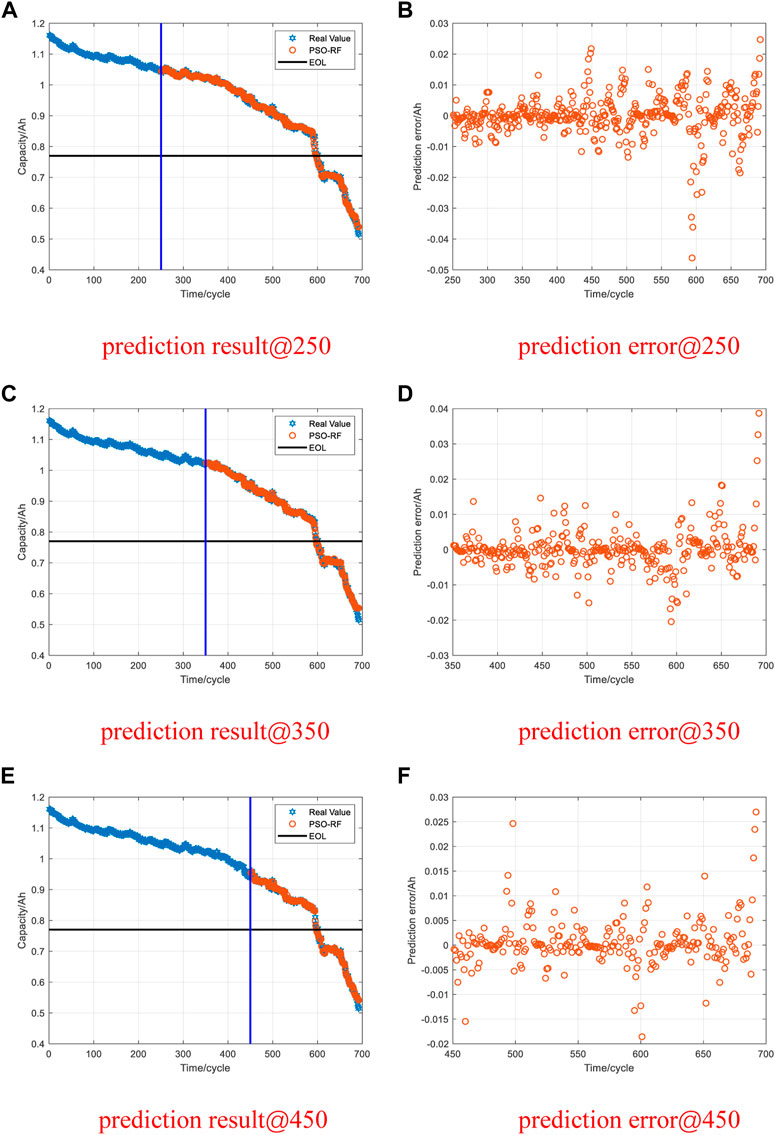
The change in battery capacity directly represents the degradation degree of the battery during the charge-discharge cycle. Consequently, capacity can be used as an input value for evaluating battery performance degradation to predict the RUL. To verify the feasibility of the proposed method in the RUL prediction of the lithium-ion battery, the battery degradation data sets in Section 3.1 are used for testing. To verify the effectualness of the method at different starting points, the prediction starting points of the model are selected as 40, 60, and 80 cycles. The cycle times of B0005, B0006, and B0007 in data set I are all 168. After reconstructing the vector space, they are 160. The prediction starting points for data set Ⅱ are selected as 250, 350, and 450 cycles. The cycle times of CS2-33, CS2-34, CS2-35, and CS2-36 in data set Ⅱ are all 700. After reconstructing the vector space, they are 692.
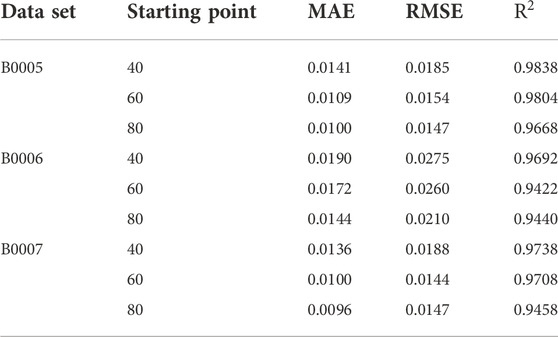
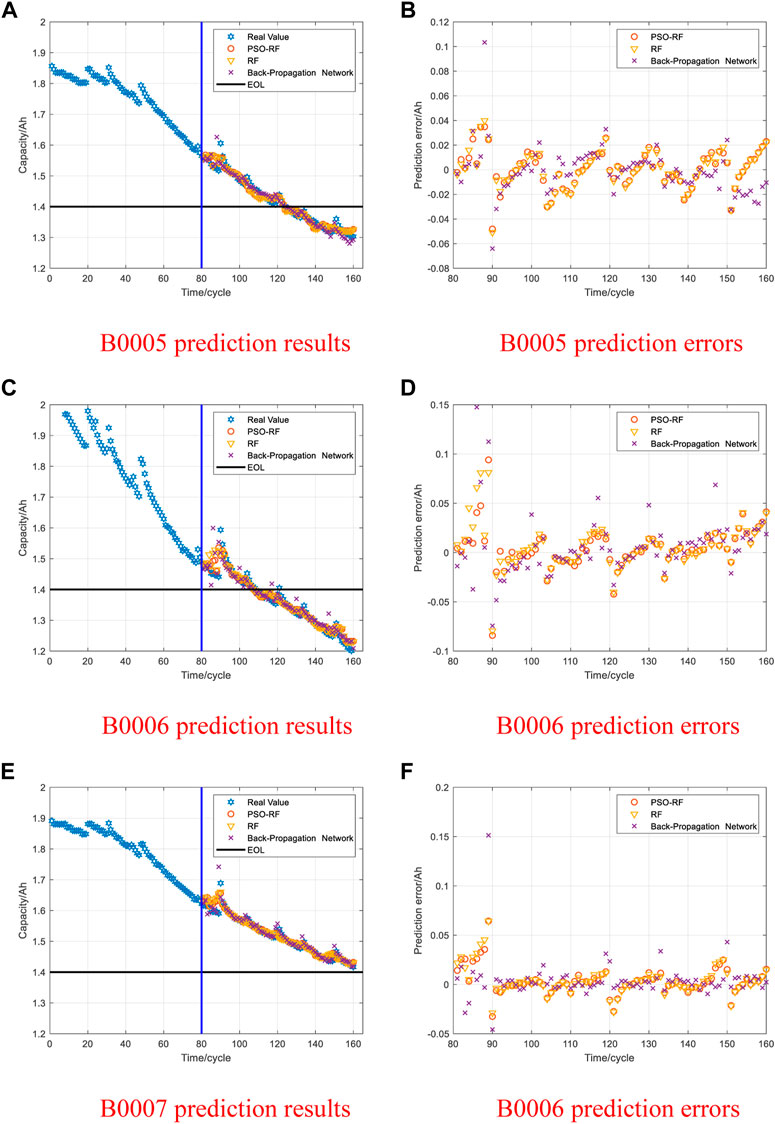
For data set I, graphs (A), (C), and (E) in Figures 9, 10, 11 show that the PSO-RF algorithm exhibits a better convergence effect. The goodnesses of fit of the PSO-RF algorithm for the three types of battery packages in the NASA data set at different prediction starting points are all greater than 0.94. Most of the prediction error data points fluctuate in a small range near 0, as shown in (B), (D), and (F) in Figures 9, 10, 11. Table 3 illustrates that as the prediction starting point moves backward, the data used for training continues to increase. The MAE and RMSE of the prediction results continue to decrease, but the results are not much different. The consistency of results shows that the PSO-RF algorithm has splendid long-term prediction accuracy. When the prediction starting point is 80 cycles, the average MAE and RMSE of the predicted values for the three types of battery packages are 0.0113 and 0.0168, respectively.
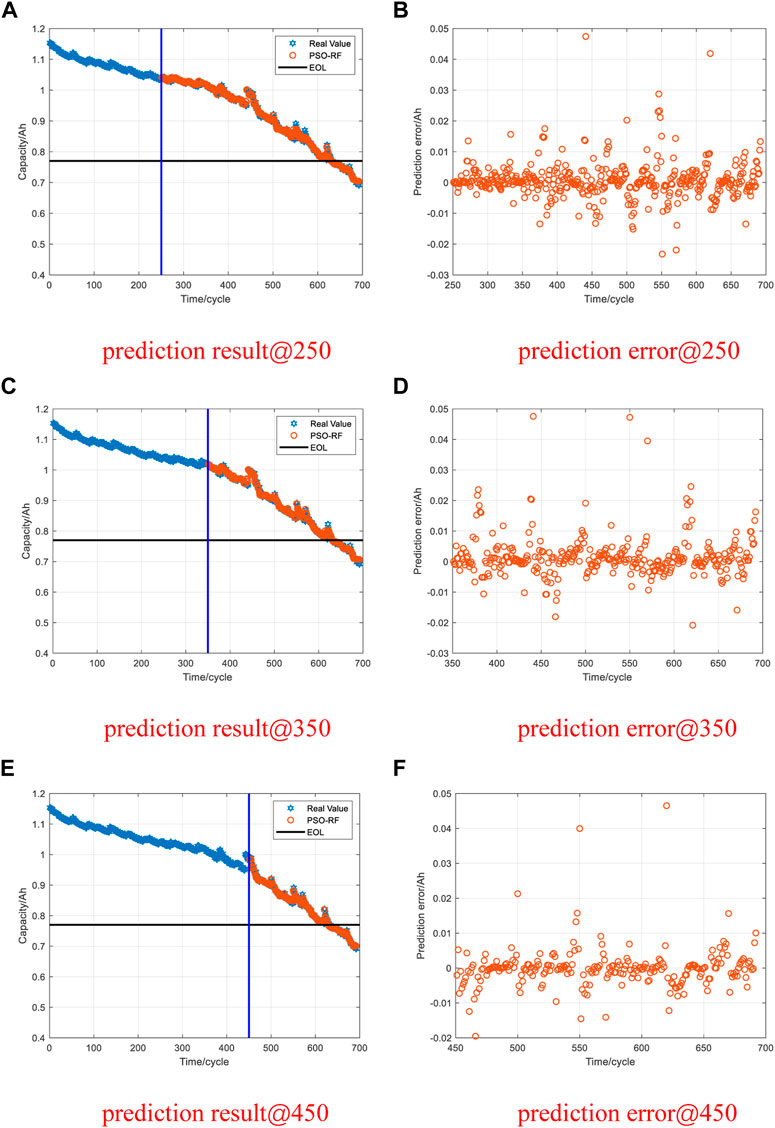
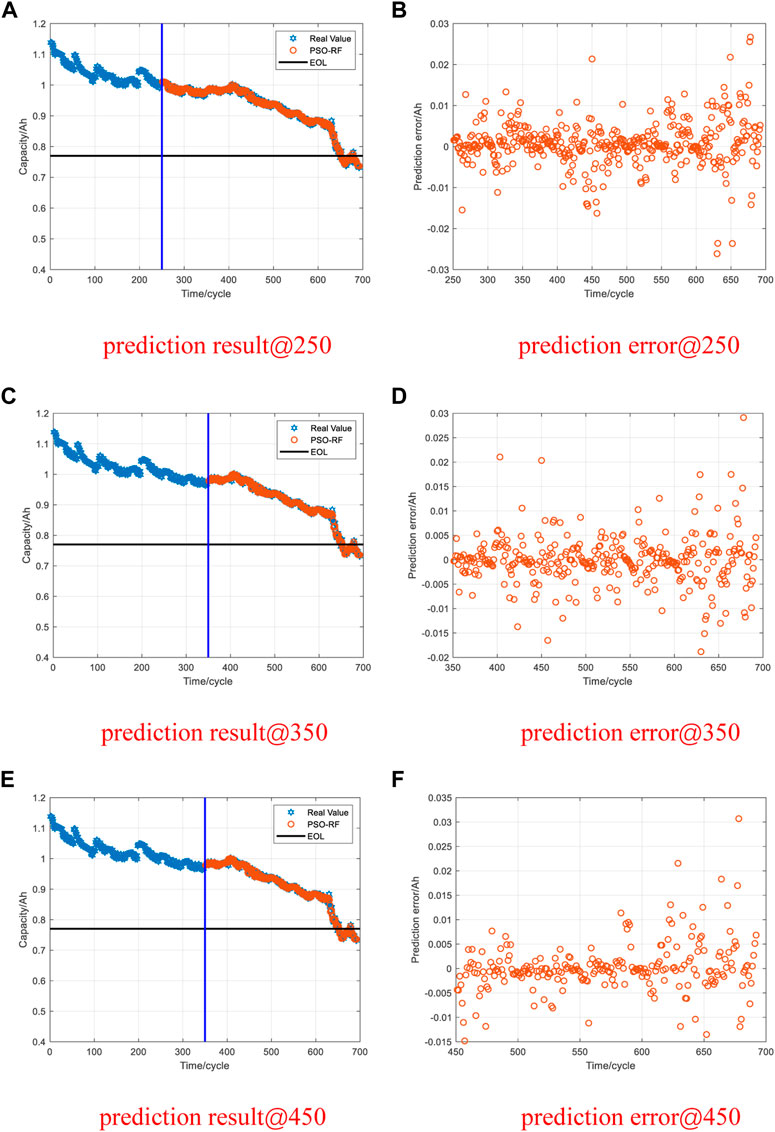
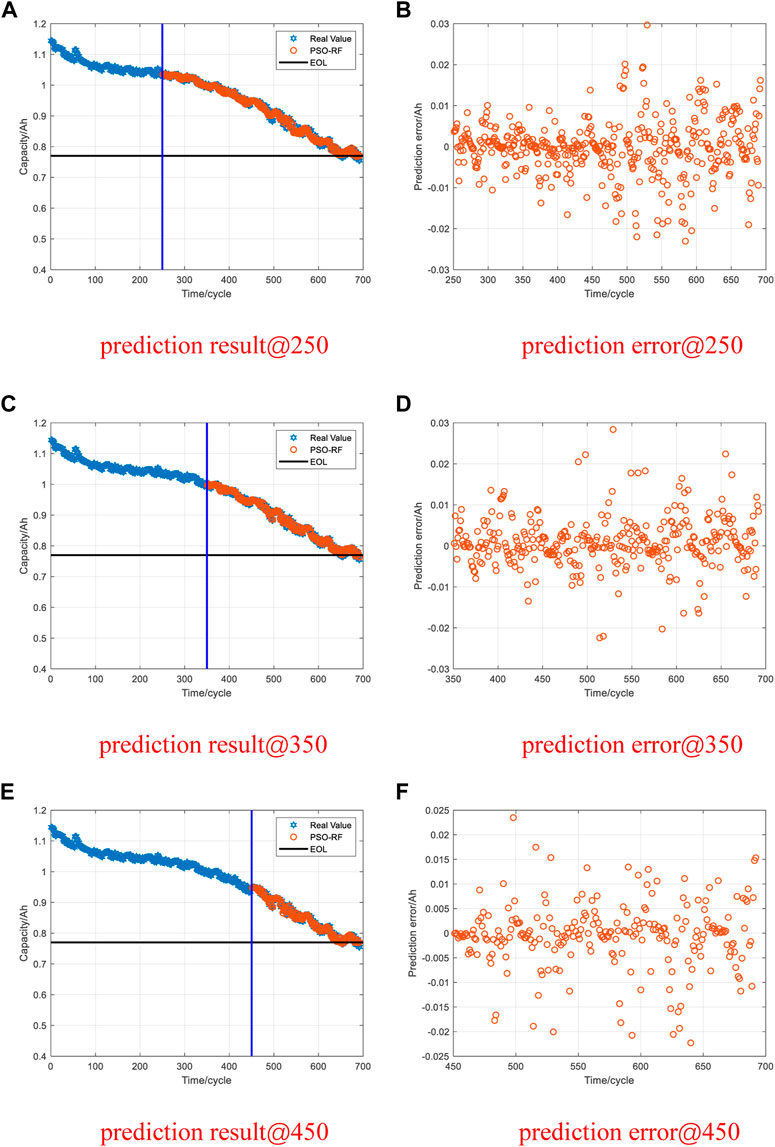
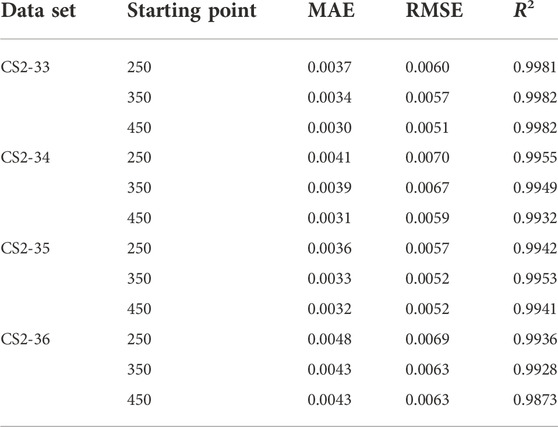
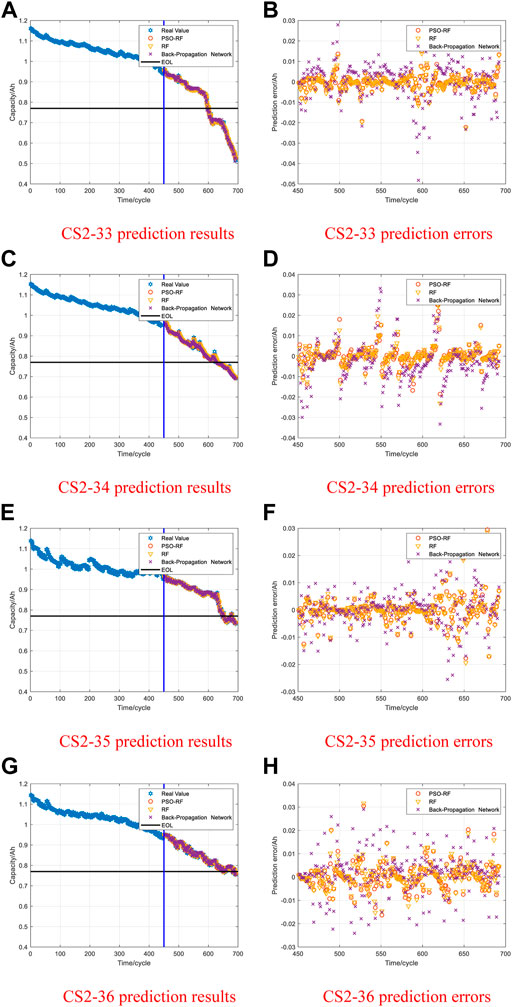
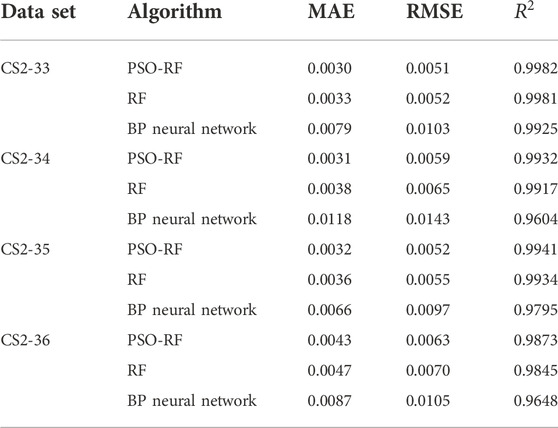
Figures 12–15 show the prediction results of the PSO-RF algorithm for data set II when the prediction starting point is 250, 350, and 450 cycles. The PSO-RF algorithm shows a good convergence effect for all four types of battery packages. When the prediction starting point is 450 cycles, the average MAE and RMSE of the predicted values of the four types of battery packages are 0.0034 and 0.0056, respectively. The rest of the data are shown in Table 4.
3.5 Comparative analysis
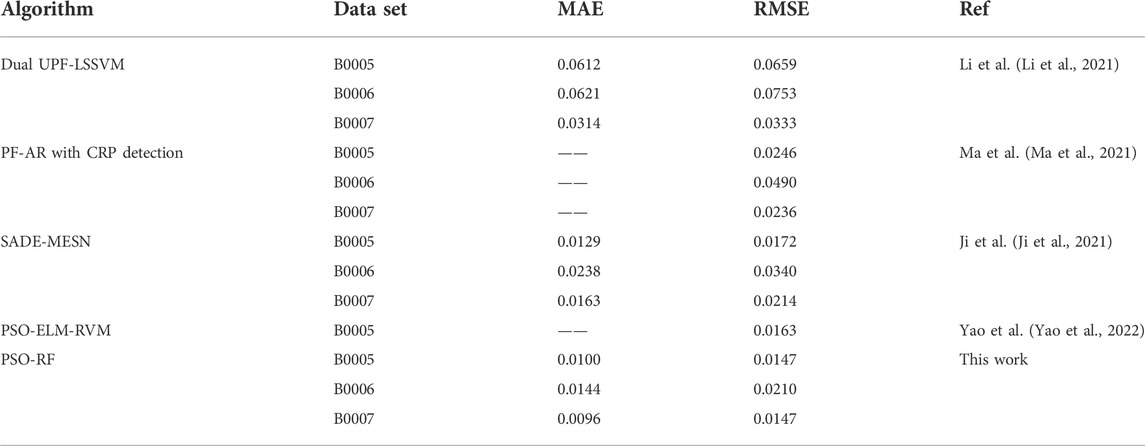
In this paper, we first compared our prediction results with the existing work by taking the NASA data set as an example, as shown in Table 5. And we compared with random forest algorithm and BP neural network algorithm.
3.5.1 Compare with RF algorithm
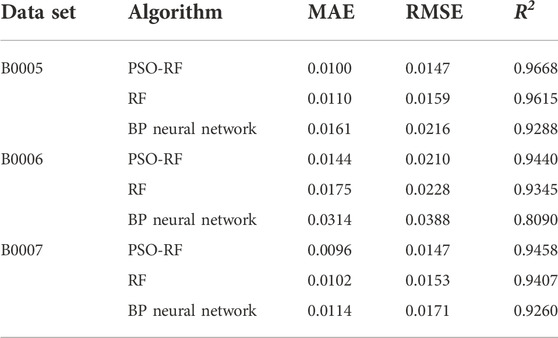
The PSO-RF algorithm is an optimized RF algorithm. The PSO algorithm is applied to search for the optimal parameters of the RF algorithm. Therefore, to verify the feasibility of the PSO-RF algorithm, the RF algorithm selects general parameters for comparison, that is,
3.5.2 Compared with BP neural network
The BP neural network is a multi-layer feedforward network according to the error back propagation training. Its fundamental idea is to minimize the average variance of the real and expected output value of the network by the gradient descent method. Since the BP neural network has robust nonlinear mapping capabilities and flexible network structures, it is used in the URL prediction of lithium-ion batteries. As shown in Figure 16, the average MAE and RMSE values of the predicted values of the three types of battery packages in the NASA data set by the BP neural network are 0.0196 and 0.0258, respectively. The average MAE and RMSE of the predicted value of the BP neural network are larger than that of the predicted value of the PSO-RF algorithm. Figure 17 shown that the average MAE and RMSE values of the BP neural network for the predicted values in the CALCE data set are 0.0088 and 0.0112. The prediction error comparison results of PSO-RF and BP neural network are listed in Tables 6, 7. It is demonstrated that the PSO-RF algorithm showed higher accuracy. The prediction results of MAE, RMSE, and
4 Conclusion
Accurate RUL prediction is essential to ensure the reliability and stability of lithium-ion batteries in the application process. This paper proposes a PSO-RF algorithm to predict the RUL, effectively solving the problem of parameter selection in the RF algorithm. The performance of the proposed method is validated using original battery degradation data sets from NASA and CALCE. The prediction results of the proposed method are compared with the prediction results of the RF method and the BP neural network method to verify the effectiveness of the PSO-RF method. The comparison shows that the PSO algorithm can optimize two parameters of the RF model. The extracted battery capacity data are arranged according to the number of cycles to form a capacity decay curve. Moreover, the curve conforms to the time series and has prominent nonlinear characteristics, which follow the characteristics of the RF solution. The simulation experiment results show that the PSO-RF algorithm can accurately predict the capacity of aging batteries and has a good convergence effect. Therefore, the algorithm is suitable for predicting the RUL.
Data availability statement
Publicly available datasets were analyzed in this study. This data can be found here: https://calce.umd.edu/data CS2 https://ti.arc.nasa.gov/tech/dash/groups/pcoe/prognostic-data-repository/.
Author contributions
Full-paper design, JW, XC, and LZ; writing—review and editing, XC, HH, and JW; funding acquisition, JX and JW; software, LZ, and CF; formal analysis, LZ, JX, and JW; data curation, XZ; writing—original draft preparation, JW and LZ; supervision, JW and LZ; All authors have read and agreed to the published version of the manuscript.
Funding
This work is supported by the scientific research fund of Hainan University (No. kyqd (ZR)1934 and No. RZ2100003112).
Conflict of interest
Author XZ was employed by the Hainan Curium Technology Co., Ltd.
The remaining authors declare that the research was conducted in the absence of any commercial or financial relationships that could be construed as a potential conflict of interest.
Publisher’s note
All claims expressed in this article are solely those of the authors and do not necessarily represent those of their affiliated organizations, or those of the publisher, the editors and the reviewers. Any product that may be evaluated in this article, or claim that may be made by its manufacturer, is not guaranteed or endorsed by the publisher.
References
Ardeshiri, R., Razavi-Far, R., Li, T., Wang, X., Ma, C., and Liu, M. (2022). Gated recurrent unit least-squares generative adversarial network for battery cycle life prediction. Measurement 196, 111046. doi:10.1016/j.measurement.2022.111046
Bai, G., Wang, P., Hu, C., and Pecht, M. (2014). A generic model-free approach for lithium-ion battery health management. Appl. Energy 135, 247–260. doi:10.1016/j.apenergy.2014.08.059
Chang, L., Wang, Y., and Chen, Z. J. E. (2019). Degradation model and cycle life prediction for lithium-ion battery used in hybrid energy storage system. Energy 166, 796–806. doi:10.1016/j.energy.2018.10.131
Deng, Z., Yang, L., Deng, H., Cai, Y., and Li, D. (2018). Polynomial approximation pseudo-two-dimensional battery model for online application in embedded battery management system. Energy 142, 838–850. doi:10.1016/j.energy.2017.10.097
Duan, B., Zhang, Q., Geng, F., and Zhang, C. (2020). Remaining useful life prediction of lithium-ion battery based on extended Kalman particle filter. Int. J. Energy Res. 44 (3), 1724–1734. doi:10.1002/er.5002
Duong, P., and Raghavan, N. J. M. R. (2018). Heuristic Kalman optimized particle filter for remaining useful life prediction of lithium-ion battery. Microelectron. Reliab. 81, 232–243. doi:10.1016/j.microrel.2017.12.028
Filho, C., de Carvalho Junior, W., Bhering, S. B., and Calderano Filho, B. (2016). Spatial prediction of soil surface texture in a semiarid region using random forest and multiple linear regressions. CATENA 139, 232–240. doi:10.1016/j.catena.2016.01.001
Ji, Y., Chen, Z., Shen, Y., Yang, K., Wang, Y., and Cui, J. (2021). An RUL prediction approach for lithium-ion battery based on SADE-MESN. Appl. Soft Comput. 104, 107195. doi:10.1016/j.asoc.2021.107195
Kang, L. W., Zhao, X., and Ma, J. J. A. E. (2014). A new neural network model for the state-of-charge estimation in the battery degradation process. Appl. Energy 121, 20–27. doi:10.1016/j.apenergy.2014.01.066
Kennel, M. B., Brown, R., and Abarbanel, H. D. I. (1992). Determining embedding dimension for phase-space reconstruction using a geometrical construction. Phys. Rev. A . Coll. Park. 45, 3403–3411. doi:10.1103/PhysRevA.45.3403
Klass, V., Behm, M., and Lindbergh, G. J. J. o. P. S. (2014). A support vector machine-based state-of-health estimation method for lithium-ion batteries under electric vehicle operation. J. Power Sources 270, 262–272. doi:10.1016/j.jpowsour.2014.07.116
Lahouar, A., and Slama, J. J. R. E. (2017). Hour-ahead wind power forecast based on random forests. Renew. Energy 109, 529–541. doi:10.1016/j.renene.2017.03.064
Li, F., and Xu, J. J. M. R. (2015). A new prognostics method for state of health estimation of lithium-ion batteries based on a mixture of Gaussian process models and particle filter. Microelectron. Reliab. 55 (7), 1035–1045. doi:10.1016/j.microrel.2015.02.025
Li, X., Ma, Y., and Zhu, J. (2021). An online dual filters RUL prediction method of lithium-ion battery based on unscented particle filter and least squares support vector machine unscented particle filter and least squares support vector machine. Measurement 184, 109935. doi:10.1016/j.measurement.2021.109935
Li, Y., Zou, C., Berecibar, M., Nanini-Maury, E., Chan, J. C. W., van den Bossche, P., et al. (2018). Random forest regression for online capacity estimation of lithium-ion batteries. Appl. Energy 232, 197–210. doi:10.1016/j.apenergy.2018.09.182
Lin, C., Xu, J., Shi, M., and Mei, X. (2022). Constant current charging time based fast state-of-health estimation for lithium-ion batteries. Energy 247, 123556. doi:10.1016/j.energy.2022.123556
Liu, D., Jianbao Zhou, , Haitao Liao, , Yu Peng, , and Xiyuan Peng, (2015). A health indicator extraction and optimization framework for lithium-ion battery degradation modeling and prognostics. IEEE Trans. Syst. Man. Cybern. Syst. 45 (6), 915–928. doi:10.1109/TSMC.2015.2389757
Long, B., Xian, W., Jiang, L., and Liu, Z. (2013). An improved autoregressive model by particle swarm optimization for prognostics of lithium-ion batteries. Microelectron. Reliab. 53 (6), 821–831. doi:10.1016/j.microrel.2013.01.006
Ma, Q., Zheng, Y., Yang, W., Zhang, Y., and Zhang, H. (2021). Remaining useful life prediction of lithium battery based on capacity regeneration point detection. Energy 234, 121233. doi:10.1016/j.energy.2021.121233
Mao, X. J., Song, S. J., and Ding, F. (2022). Optimal BP neural network algorithm for state of charge estimation of lithium-ion battery using PSO with Levy flight. J. Energy Storage 49, 104139. doi:10.1016/j.est.2022.104139
Meng, H., Li, Y. F. J. R., and Reviews, S. E. (2019). A review on prognostics and health management (PHM) methods of lithium-ion batteries. Renew. Sustain. Energy Rev. 116, 109405. doi:10.1016/j.rser.2019.109405
Patil, M. A., Tagade, P., Hariharan, K. S., Kolake, S. M., Song, T., Yeo, T., et al. (2015). A novel multistage Support Vector Machine based approach for Li ion battery remaining useful life estimation. Appl. Energy 159, 285–297. doi:10.1016/j.apenergy.2015.08.119
Pecht, M., He, W., and Hendricks, C. (2013). Lessons learned from the 787 dreamliner issue on lithium-ion battery reliability. Energies 6 (9), 4682–4695. doi:10.3390/en6094682
Qin, T., Zeng, S., and Guo, J. J. M. R. (2015). Robust prognostics for state of health estimation of lithium-ion batteries based on an improved PSO–SVR model. Microelectron. Reliab. 55 (9-10), 1280–1284. doi:10.1016/j.microrel.2015.06.133
Ren, X., Liu, S., Yu, X., and Dong, X. (2021). A method for state-of-charge estimation of lithium-ion batteries based on PSO-LSTM. Energy 234, 121236. doi:10.1016/j.energy.2021.121236
Sun, Y., Li, G., Zhang, J., and Qian, D. (2019). Prediction of the strength of rubberized concrete by an evolved random forest model. Adv. Civ. Eng. 2019, 1–7. doi:10.1155/2019/5198583
Wang, L., Zhou, X., Zhu, X., Dong, Z., and Guo, W. (2016). Estimation of biomass in wheat using random forest regression algorithm and remote sensing data. Crop J. 4 (3), 212–219. doi:10.1016/j.cj.2016.01.008
Wang, W., Fleischer, C., and Sauer, D. U. (2014). Critical review of the methods for monitoring of lithium-ion batteries in electric and hybrid vehicles. J. Power Sources 258, 321–339. doi:10.1016/j.jpowsour.2014.02.064
Yang, B. S., Di, X., and Han, T. (2008). Random forests classifier for machine fault diagnosis. J. Mech. Sci. Technol. 22 (9), 1716–1725. doi:10.1007/s12206-008-0603-6
Yang, F., Wang, D., Xu, F., Huang, Z., and Tsui, K. L. (2020). Lifespan prediction of lithium-ion batteries based on various extracted features and gradient boosting regression tree model. J. Power Sources 476, 228654. doi:10.1016/j.jpowsour.2020.228654
Yang, L., Cai, Y., Yang, Y., and Deng, Z. (2020). Supervisory long-term prediction of state of available power for lithium-ion batteries in electric vehicles. Appl. Energy 257, 114006. doi:10.1016/j.apenergy.2019.114006
Yao, F., He, W., Wu, Y., Ding, F., and Meng, D. (2022). Remaining useful life prediction of lithium-ion batteries using a hybrid model. Energy 248, 123622. doi:10.1016/j.energy.2022.123622
Zhang, Y., Peng, Z., Guan, Y., and Wu, L. (2021). Prognostics of battery cycle life in the early-cycle stage based on hybrid model. Energy 221, 119901. doi:10.1016/j.energy.2021.119901
Keywords: lithium-ion batteries, RUL, RF, PSO, machine learning
Citation: Wu J, Cheng X, Huang H, Fang C, Zhang L, Zhao X, Zhang L and Xing J (2023) Remaining useful life prediction of Lithium-ion batteries based on PSO-RF algorithm. Front. Energy Res. 10:937035. doi: 10.3389/fenrg.2022.937035
Received: 05 May 2022; Accepted: 12 September 2022;
Published: 05 January 2023.
Edited by:
Matthias Finkenrath, Kempten University of Applied Sciences, GermanyReviewed by:
Mahidur Sarker, National University of Malaysia, MalaysiaXiaoyu Li, Hebei University of Technology, China
Copyright © 2023 Wu, Cheng, Huang, Fang, Zhang, Zhao, Zhang and Xing. This is an open-access article distributed under the terms of the Creative Commons Attribution License (CC BY). The use, distribution or reproduction in other forums is permitted, provided the original author(s) and the copyright owner(s) are credited and that the original publication in this journal is cited, in accordance with accepted academic practice. No use, distribution or reproduction is permitted which does not comply with these terms.
*Correspondence: Lina Zhang, emhhbmdsaW5hNjc4OUAxNjMuY29t
 Jingjin Wu
 Xukun Cheng
 Heng Huang
 Chao Fang
 Ling Zhang1