 Zhi Su1,2
 Peng Liu
 Liyan Wu
94% of researchers rate our articles as excellent or good
Learn more about the work of our research integrity team to safeguard the quality of each article we publish.
Find out more
ORIGINAL RESEARCH article
Front. Energy Res., 30 June 2022
Sec. Sustainable Energy Systems
Volume 10 - 2022 | https://doi.org/10.3389/fenrg.2022.935550
This article is part of the Research TopicInteractions Between China’s National Emissions Trading Scheme and Electricity Market: Practices and PoliciesView all 27 articles
While there is extensive literature assessing the impact of command-and-control and market-incentive environmental regulation on carbon emissions, it overlooks the fact that command-and-control environmental regulation and market-incentive environmental regulation are the embodiment of the national concept of green development. When a national leader with a green development philosophy is in power, local governments (due to the competition among them) adjust the economic development strategies and targets in their jurisdictions according to the leaders’ philosophy, resulting in differences in urban carbon emissions. Based on Chinese urban panel data from 2010 to 2016, this study uses a difference-in-differences approach to assess the impact of a national leader with a green development philosophy in power on carbon emissions in cities with different political sensitivities and the mechanisms of the impact. Our study finds that after the change in national leadership, the carbon intensity of high politically sensitive cities decreases significantly compared to low politically sensitive cities. We further find that increasing urban green areas and limiting the development of high-polluting industries are two ways to reduce carbon emission intensity in highly politically sensitive cities. A heterogeneity test demonstrates that the higher the level of economic development of the region where the city is located, the fewer the number of industrial enterprises in the city, the lower the total industrial output value of the city, and the more domestic enterprises in the city, proving that the change of national leaders more significantly impacts the city’s carbon emission. Our study suggests that policymakers should pay careful attention to the system of appraisal of officials, urban greening and development of highly polluting industries, and differentiated environmental policies.
Since China’s reform and opening up in 1978, the Chinese economy has created a remarkable “Chinese miracle.” The rapid economic growth has been accompanied by a significant increase in energy consumption and greenhouse gas (GHG) emissions (An et al., 2021). Since 2006, China has become the world’s largest emitter of carbon dioxide (Zhao et al., 2020), and the issue of GHG emission reduction has become a growing concern. Considering the deteriorating environment and the consequential international pressure, the Chinese government has developed an ambitious GHG reduction plan (Cheong et al., 2016). In the November 2014 US-China Joint Statement on Climate Change, China set a national autonomous contribution target to peak CO2 emissions around 2030. In the general debate of the 75th session of the UN General Assembly in 2020, China further proposed the goal of achieving carbon neutrality by 2060, in addition to the goal of achieving carbon peaking by 2030 (Xian et al., 2022). Reducing CO2 emissions and achieving peak carbon and carbon neutrality have produced a broad and profound social change in China’s economic development.
Economic development goals and policies reflect the central government’s development philosophy. The formulation of the carbon peaking and carbon neutrality goals indicates that green development is an important direction for China’s economic development at this stage and implies that the current central government has a strong green development philosophy. The 18th National Congress of the Communist Party of China, held in November 2012, elected a new central leadership with Xi Jinping as the core; the 12th National People’s Congress, held in March 2013, formally established a new national leadership with Xi Jinping as the president. During his administration, General Secretary Xi Jinping has proposed strong green development concepts, such as: “A good ecological environment is the fairest public product and the most universally beneficial welfare of people’s livelihood,” “Building an ecological civilization is related to people’s welfare and the future of the nation,” and “clean waters and green mountains are gold and silver mountains.” This green development philosophy was evident as early as when he was in power in the local government. In August 2005, when Xi Jinping was the Party Secretary of Zhejiang Province, he first proposed the scientific assertion that “clean waters and green mountains are gold and silver mountains” during an inspection in Anji, Huzhou, and Zhejiang Province. To manage the environmental damage in Zhejiang Province in the course of rapid economic development, Xi Jinping proposed a series of environmental pollution remediation measures during his administration.
This study has remarkable political and institutional context, it is certain that the Chinese government plays an active role in promoting economic development (An et al., 2016; Niu and Zhou, 2022). However, it is important to note that the concept of green development does not act directly on the ecological environment or GHG emissions and that municipal governments play an important role in this process (Shen et al., 2015; Xu et al., 2016). Municipal governments are the main subjects of implementing national macroeconomic policies at the micro-level. Municipal governments have a large, huge, and flexible discretion on whether and how national policies are implemented, which is an important requirement for “politics out of Zhongnanhai” (Xu, 2011). In China, under the system of “political decentralization” and “fiscal decentralization,” local governments often control a series of important resources such as land and credit within their jurisdiction. Under the promotion appraisal mechanism, which uses GDP as the appraisal indicator, local governments constantly seek to maximize regional GDP (Li and Zhou, 2005), hoping to stand out in the competition among local governments. With the changing relationship between the state and society and the adjustment of central government policies, the competitive landscape of local governments is gradually changing, and the space for local governments to derive economic benefits from GDP competition is shrinking (Sun et al., 2021). With the increasing public outcry for environmental protection, the central government adjusted its evaluation criteria for local governments and gradually included the quality of environmental protection in the promotion criteria for local government officials (Pu and Fu, 2018). Performance in environmental protection will positively impact the promotion of local officials (You et al., 2019). This is an important reason why changes in the central government’s green development concept affect urban carbon emissions, and it is also an important theoretical basis for this study.
When local governments have high political sensitivity, they usually adjust local economic policies in time to cope with the economic development trend of the new stage, while local governments with low political sensitivity will adjust economic policies less. Thus, when national leaders with a distinctive green development philosophy are in power, local governments with different political sensitivities adjust their local economic policies, which has a strong political impact on local enterprises, resulting in differences in urban carbon emissions. Subsequently, quantifying the political sensitivity of cities will be an important aspect of analyzing the impact of the change in national leaders on the change in urban carbon emissions. The literature typically measures political uncertainty using synthetic indices or important local leadership changes and lacks a quantification of the degree of political uncertainty at the city level. Therefore, we use economic policy uncertainty in cities as a proxy for political sensitivity to examine the impact of governing by national leaders with a strong green development philosophy on urban carbon emissions.
Economic policy uncertainty is used to portray the frequency of economic policy changes and adjustments in a country, region, or city, and aims to effectively capture the sensitivity of a country, region, or city to changes in national policy. The more frequently and timely a city’s economic policies are adjusted when the country’s leaders change, the higher the uncertainty of the city’s economic policies while reflecting the city’s higher political sensitivity. On the contrary, if certain cities are less likely to adjust their economic policies before and after a change in the country’s leadership, economic policy uncertainty is lower in these cities while reflecting their lower political sensitivity. Thus, economic policy uncertainty is an excellent proxy variable for quantifying political sensitivity in cities. Therefore, this study uses the economic policy uncertainty index at the city level in China constructed by Yu et al. (2021) as a proxy variable for political sensitivity in Chinese cities. We divide cities into high and low political sensitivity groups using the median of economic policy uncertainty for the full sample and analyze the changes in carbon emissions in cities with different political sensitivities when the country leader changes.
This study proceeds as follows. First, based on a panel data of Chinese cities from 2010 to 2016, we use the election of General Secretary Xi Jinping as the national leader as the time of policy occurrence, and cities with higher political sensitivity as the treatment group and cities with lower political sensitivity as the control group. Thereafter, using a difference-in-differences (DID) approach, we assess the impact of a national leader with a green development philosophy in power on urban carbon emissions. Second, this study considers two influence mechanisms, the development of highly polluting industries and urban greening, and analyses whether local governments achieve carbon reduction through these two influence mechanisms after the change of top national leaders. Third, this study considers the impact of city characteristics—such as the location of the city, the number of industrial enterprises in the city, the output value of industrial enterprises, and the number of enterprises of different nature—to evaluate the effect of the governance of national leaders with distinct green development concept on urban carbon emission reduction more comprehensively.
Our main contributions of this study are the following. In the existing literature, synthetic indices or political events are usually used to measure policy sensitivity. For example, Baker et al. (2016) constructed a policy uncertainty index for the Chinese economy. An et al. (2016), Cheng et al. (2021), and Xu et al. (2016) measured policy uncertainty using the change of municipal party secretaries and mayors. The shortcomings of such measures are that they do not consider the regional heterogeneity of economic policy changes in China (Shi et al., 2020) and the lack of the quantification of the degree of political sensitivity in different regions. Moreover, the uncertainty of urban economic policy reflects the city’s political sensitivity, and the frequency and speed of the adjustment of the economic policy system depend on the level of political sensitivity. This study measures urban political sensitivity using an index of economic policy uncertainty at the city level in China constructed by Yu et al. (2021), fully considering economic policies’ regional heterogeneity.
Second, this study examines the impact of governing by leaders with a green development philosophy on urban carbon emissions. The existing literature has adequately assessed the policy effects of environmental regulation in recent years, ignoring the fact that environmental regulation originates from central government decisions. For example, Cui et al. (2021) and Zhu et al. (2022) elevated the policy effect of China’s carbon emission trading. Liu et al. (2021) analyzed the carbon emission reduction effect of sustainable development goals. Chen and Wang (2022) explored the impact of low-carbon city pilot. In essence, environmental regulation reflects the development philosophy of the country’s leaders. Moreover, due to the institutional background of “political decentralization” and “fiscal decentralization” in China and the promotion assessment mechanism focusing on relative performance, the political sensitivity of local governments is an important factor affecting the effect of central policies.
Third, this study analyzes how the leadership with the green development concept affects carbon emission levels in different politically sensitive cities. Since local governments in China have strong control and influence over the local economy, we mainly consider the development of high-pollution industries and urban greening as two influencing mechanisms. Through these two mechanisms, we explore the carbon reduction mechanisms in cities with different political sensitivities when leaders with a green development philosophy are in power.
This study mainly involves two types of research literature. The first type is related to the policy effect assessment of environmental regulation. In recent years, the Chinese government has implemented a series of environmental regulations to meet carbon neutrality and carbon peaking goals. Environmental regulation is the most important factor affecting energy saving and emission reduction (Shuai et al., 2017; Acheampong et al., 2019; Ouyang et al., 2020), including command-and-control environmental regulation and market incentive environmental regulation. These environmental regulations have effectively reduced energy consumption in numerous countries (Laplante and Rilstone, 1996; Omer, 2008; Zhou and Huang, 2016; Shahsavari and Akbari, 2018; Pei et al., 2019). According to existing studies, in terms of command-and-control environmental regulation, the Chinese government has issued a series of policies, such as the “Thousand Enterprises” energy-saving policy (Ma and Liang, 2018), the carbon emission target as a binding indicator in the “Eleventh Five-Year Plan” (Liu et al., 2021), the national fiscal policy on energy saving and emission reduction (Lin and Zhu, 2019), and low-carbon city construction (Song et al., 2020). These command-and-control environmental regulations have led to significant reductions in energy intensity and improvements in energy efficiency in all provinces during the Eleventh Five-Year Plan period (Pan et al., 2019). In terms of market-driven environmental regulation, China has conducted pilot policies, such as sulfur dioxide emission trading (Hou et al., 2020), carbon dioxide emission trading (Wang et al., 2019; Yu et al., 2021; Zhang and Wang, 2021; Yu et al., 2022), and energy consumption permit trading (Zhang et al., 2021). Implementing market-incentivized environmental regulation has significantly reduced pollutant emissions and promoted energy efficiency through technological innovation (Pei et al., 2019), essentially achieving the win-win situation for environmental benefits and efficiency advocated by the Porter hypothesis (Wang et al., 2019). This is not only beneficial for China’s coordinated regional development and green, low-carbon transition but also for sustainable social development (Jiang et al., 2016; Wang et al., 2019).
The second type of literature is related to policy uncertainty, which, as a part of market risk, has an important impact on the economy’s stability and development. There are two main types of measures of policy uncertainty. The first measure is based on a composite index (Shah et al., 2021; Tran and Houston, 2021), and the research related to economic policy uncertainty mainly adopts the Economic Policy Uncertainty Index constructed by Baker et al. (2016), which measures economic policy uncertainty based on the index of newspaper text, and applies this construction method to different countries and regions. Similar to this method, Li et al. (2020) constructed China’s monthly EPU index based on three national newspapers, and Huang and Luk (2020) constructed China’s daily EPU index based on ten local newspapers (Deng et al., 2019; Dong et al., 2022; Huang, 2022; Niu and Zhou, 2022). Julio and Yook (2012) discuss the impact of policy uncertainty on investment in the context of national elections in 48 countries between 1980 and 2005, using the election of national leaders as a proxy variable for policy uncertainty. An et al. (2016), Cheng et al. (2021), and Xu et al. (2016) used municipal secretary or mayoral turnover as a proxy variable for policy uncertainty. Francis et al. (2021) constructed a weighted policy uncertainty index using Google political election news, a tax expiration index, a CPI forecast spread, and a federal procurement forecast spread.
From the available literature, the assessment of the policy effects of environmental regulations implemented in China in recent years has ignored the particular political-institutional context of China, which has a hierarchical tradition; the “leader-will” in the political ecology leads to the widespread “supremacy” thinking of lower-level officials, which is the main reason for effective environmental regulation. Moreover, the central government has absolute authority over the personnel appointments of local officials, and in addition to the Party Congress, the central government adjusts local personnel appointments through promotion, demotion, retirement, exchange, and other institutional provisions. Thus, environmental regulation is essentially a reflection of the development philosophy of the country’s leaders, and leaders who govern with a green development philosophy will naturally enact a range of environmental regulations. When the local officials appointed by the central government have high political sensitivity, the local government will adjust economic policies in time to complete the development goals and tasks in the new stage. On the contrary, when the local officials have low political sensitivity, the local government will adjust economic policies less. Therefore, the economic policy uncertainty of local governments reflects the political sensitivity of local governments. In terms of quantitative policy uncertainty, the uncertainty of China’s economic policy constructed by Baker et al. (2016) ignores regional heterogeneity and fails to account for the differences in policy uncertainty across regions. Consequently, as a proxy variable for policy uncertainty, the local official turnover lacks a quantification of the degree of policy uncertainty.
Based on the above analysis, we choose the economic policy uncertainty index constructed by Yu et al. (2021) at the Chinese city level to reflect the political sensitivity of each city. Yu et al. (2021) improved the Chinese economic policy uncertainty index constructed by Baker et al. (2016) by considering the contextual differences between the Chinese and English expressions, and took 460 newspapers in the CNKI newspaper database as the data source for text analysis and, for the first time, extended the economic policy uncertainty index from China’s national level to China’s provinces and cities.
As mentioned above, in November 2012, the 18th National Congress held in China elected a new central leadership with General Secretary Xi Jinping as the core, and the following year Xi Jinping was formally elected President of the 12th National People’s Congress. New leaders often come to power with new governing philosophies, and such changes may alter the economic policies of local governments, while the political sensitivities of local governments may influence the strength of the policy effects. Secretary Xi Jinping is a leader with a distinct concept of green development. After he took office, he successfully proposed several green development concepts, such as “clean waters and green mountains are gold and silver mountains” and “man and nature coexist in harmony.” Thus, a change in national leaders may lead to significant differences in carbon emission levels in cities with different political sensitivities. The event of the election of General Secretary Xi Jinping as president provides an excellent quasi-natural experiment to assess the relationship between political sensitivity and urban carbon emissions.
We use a DID approach to explore the effect of political sensitivity on urban carbon emissions and the city-level economic policy uncertainty index constructed by Yu et al. (2021) to capture the political sensitivity of cities in China. The index counts the proportion of articles containing economic policy and keywords indicating uncertainty to the total number of articles containing the keyword “economy” in each city’s news daily and uses this value to quantify economic policy uncertainty in each city. We divide the full sample into two groups of high and low political sensitivity using the median of the economic policy uncertainty index for each city and define cities with high political sensitivity as the treatment group and cities with low political sensitivity as the control group. By distinguishing the treatment group and the control group, we obtain the influence of different political sensitivities on the difference in urban carbon emissions. The specific model is as follows:
where the explanatory variable
The carbon intensity of cities (
To control for factors that may affect the intensity of urban carbon emissions, we include a set of city-level control variables in the regressions. First, we use the natural logarithm of urban per capita GDP to measure urban economic development and incorporate its square term into the regression equation to test the possible non-linear relationship between urban economic development level and carbon emission intensity. Second, we use urban public finance expenditures divided by public finance revenues to measure government inputs (
The development of highly polluting industries and the green area of cities are two channels used to analyze the impact of a leader with a distinct green development philosophy in power on the carbon emissions in cities. We use the number of mining employees (MII) and the number of manufacturing employees (MAI) to measure the development of highly polluting industries. Moreover, we use public green space area (PGS), garden green space area (GGS), and built-up area green coverage area (GCA) to measure urban greening. The five variables in the mechanism test are taken to their natural logarithmic values.
All data are from the National Bureau of Statistics and China Urban Statistical Yearbook. The data covers all prefecture-level cities in China’s 30 provinces, municipalities, and autonomous regions (excluding Hong Kong, Macao, Taiwan, and Tibet). The period is from 2010 to 2016, and all nominal data are adjusted for real values based on the 2010 price index. For a few cities with slight data loss, a linear interpolation method is used to supplement the data, but some cities are removed due to serious data loss. To mitigate the effects of outliers, we winsorize the top and bottom 1% of all the continuous variables from their distributions.
Table 1 presents the results of descriptive statistics for all the main variables. In terms of mean values, the carbon emission intensity of the treatment group is 0.436, which is much lower than that of the control group, which is 0.495. The treatment group has higher GDP per capita, government input, level of technological development, and FDI than the control group. This result indicates that the treatment group emits less CO2 levels for the same GDP output compared to the control group of cities. In other words, the cities in the treatment group are more efficient in their energy use.
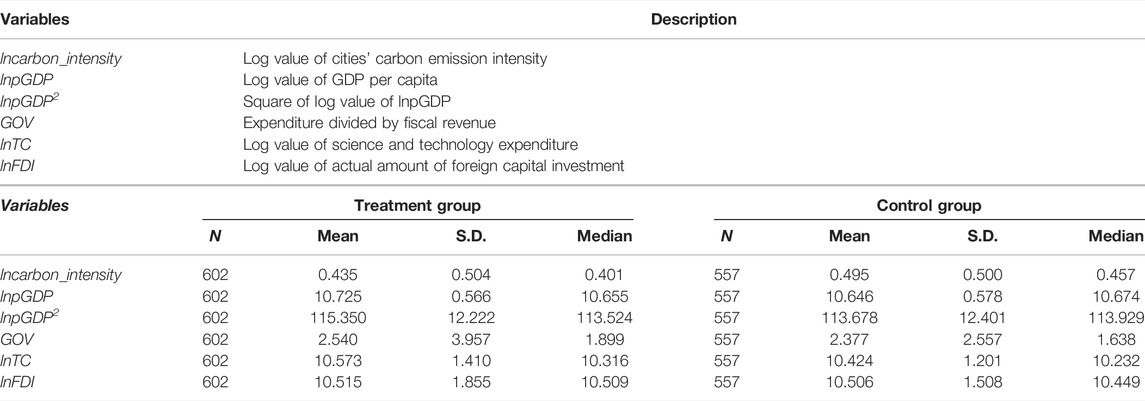
TABLE 1. Descriptive statistics.
We use the full-sample and a DID approach to estimate the difference in carbon emission intensity between the treatment group (high politically sensitive city) and the control group (low politically sensitive city) before and after the leaders with distinct green development concepts took office. Based on the baseline regression results, we test two mechanisms of urban green area and the development of highly polluting industries. Further, we divide the whole sample into different sub-samples to investigate the carbon emission reduction effect of cities with different characteristics. Finally, we perform a series of robustness tests.
Table 2 reports the estimation results of the baseline regression Eq. 1. Column (1) reports estimation results without any control variables, and Column (2) reports estimation results with a series of city-level characteristic variables included. In both columns of the regression results, the coefficient of

TABLE 2. Baseline regression results.
The baseline regression results indicate that cities with different political sensitivities have significant differences in carbon emission reduction after the change in national leaders. In other words, governing by leaders with a green development philosophy helps cities with higher political sensitivity reduce their carbon intensity. One possible mechanism is that when a new national leader with green development philosophy takes office, local governments will refer to the economic development philosophy and development strategy of the leader when they were in local government. In other words, by restricting the development of high-polluting industries and improving the level of urban greening, urban carbon emission intensity can be reduced. To verify this conjecture, we conduct corresponding empirical tests on this view in the mechanism analysis section.
In the part of control variables, we find that the level of economic development and its squared term significantly affect the carbon emission intensity of cities. That is, the economic development level has a U-shaped relationship with carbon intensity. Combined with the level of GDP of each city, Chinese cities are at a stage where the intensity of carbon emissions decreases with GDP growth. The effect of government inputs on the intensity of urban carbon emissions is significantly positive, which indicates that the incremental GDP generated by government spending is less than the incremental CO2 emitted. The higher the level of the city’s technological development, the lower the carbon emission intensity. The higher the FDI, the lower the carbon emission intensity of the city, which indicates that the advanced technology of foreign enterprises contributes to the reduction of the carbon emission level of the city. Subsequently, the regression results of control variables are consistent with the existing literature and conform to our expectations.
Based on the basic regression results, we further examine the mechanism of the impact of the change of national leaders with distinct green development concepts on urban carbon emission intensity. The main channels we consider include changes in high-pollution industries and urban greening. The reason for considering these two aspects is that when a national leader with a distinctive green development philosophy is in power, local governments with higher political sensitivity will consider the development policies of the leader when they were in power at the local level, anticipate thereafter the future development philosophy of the country, and finally adjust the local development strategy in advance. Xi Jinping was the leader of Zhejiang Province before he assumed his post in the central government, and at this stage, he first proposed the scientific assertion that “clean waters and green mountains are gold and silver mountains.” In the subsequent development process, Zhejiang province implemented a series of environmental protection policies, including “Five Water Treatment”, “Three Reform and One Demolition”, “Four Areas and Three Renovations”, and “811” environmental pollution control action. In consideration of the relevant policies that may affect the evaluation of the policy effect in this study, the “811” environmental pollution remediation action is mainly aimed at heavy pollution industries, and the “Four areas and Three Renovations” is mainly aimed at urban greening. For the development of high-pollution industries, we use the number of people employed in the mining industry (MII) and the number of people employed in the manufacturing industry (MAI). For urban greening, we mainly use the urban public green space area (PGS), garden green space area (GGS), and built-up green coverage area (GCA).
We use the number of people employed in the mining industry and manufacturing industry as proxy variables for the development of high-polluting industries for the following reasons. First, high-polluting industries are mainly concentrated in the secondary industry. In the “promotion tournament” of officials with GDP as the assessment index, local governments are unlikely to give up the political incentives brought by the GDP of secondary industries because of leaders with green development concepts in power. Therefore, making significant changes in the total amount or growth rate of GDP is difficult in the secondary industry. Second, the adjustment of industrial structure is usually slow; hence, significant changes in the GDP ratio of the secondary industry are unlikely. Third, the change in the number of employees is usually a leading indicator of industrial structure adjustment, and the change in the number of employees in high-pollution industries reasonably reflects the advanced adjustment of high-pollution industries. Therefore, we choose to measure the development of highly polluting industries by the number of people employed in mining and manufacturing.
We use public green area, garden green area, and green coverage area of built-up areas to measure urban greening because land, as a scarce resource, is the basic production factor of economic development. Under China’s land transfer system, the central and provincial governments do not directly control land, and the prefecture-level city governments monopolize the primary land supply market. The prefecture-level municipal governments are both operators and managers. The government expropriates land and then transfers the right to use it, which is an indispensable production factor for attracting investment and developing the economy of the jurisdiction. Clearly, using land for greening is not the optimal choice for local officials to maximize their own interests under the existing promotion incentive system. When the local government uses the land for urban greening, the land for industrial enterprises is restricted, further limiting the expansion of the production scale of urban industrial enterprises and reducing urban carbon emissions.
In Columns (1) and (2) of Table 3, we test the impact of a national leader with a strong green development philosophy in power on highly polluting industries. The coefficients of
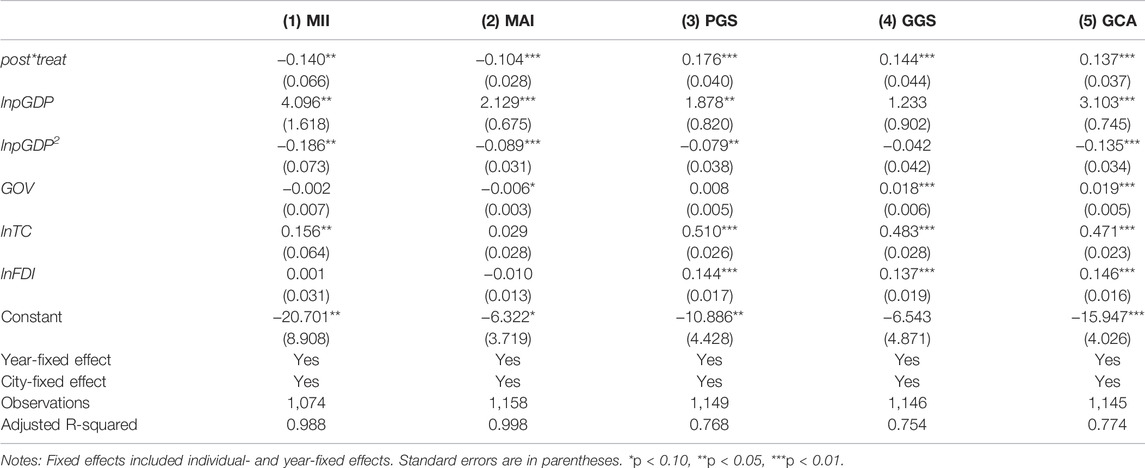
TABLE 3. Mechanism tests.
The findings suggest that limiting the development of highly polluting industries and enhancing urban green areas are effective ways to reduce urban carbon emissions intensity in cities with high political sensitivity. When the national leader with a distinct concept of green development takes office, local governments will refer to the economic development philosophy and development strategy of the leader when they were in local government. Local governments aim to reduce urban carbon emissions by limiting the development of highly polluting industries, restricting land use for industrial enterprises, and increasing the green area of cities.
The previous analysis demonstrates that leaders with strong green development concepts in power can significantly reduce the carbon emission intensity of cities with high political sensitivity. Then for cities with different characteristics, are there differences in carbon emission reduction effects? If so, what are the differences? We mainly consider the carbon reduction effect of the characteristics of the city’s location, the number of industrial enterprises in the city, the total industrial output value of the city, and the number of enterprises of different nature for cities with different political sensitivity. By grouping and regression the samples according to the characteristics of cities, we explore the heterogeneity effect of the ruling of national leaders with strong green development concepts on urban carbon emission reduction. The results of the tests are illustrated in Tables 4, 5.
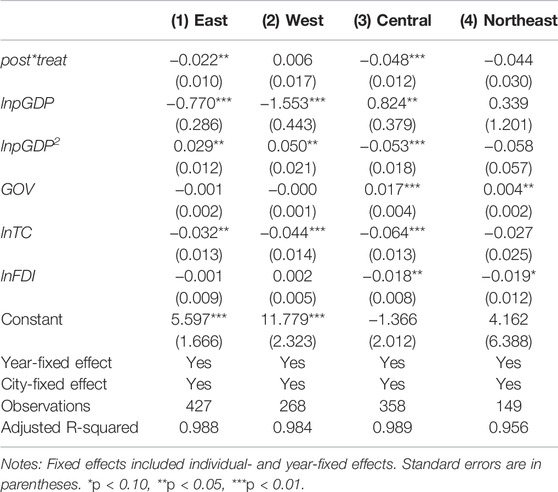
TABLE 4. Heterogeneity effects of city location.
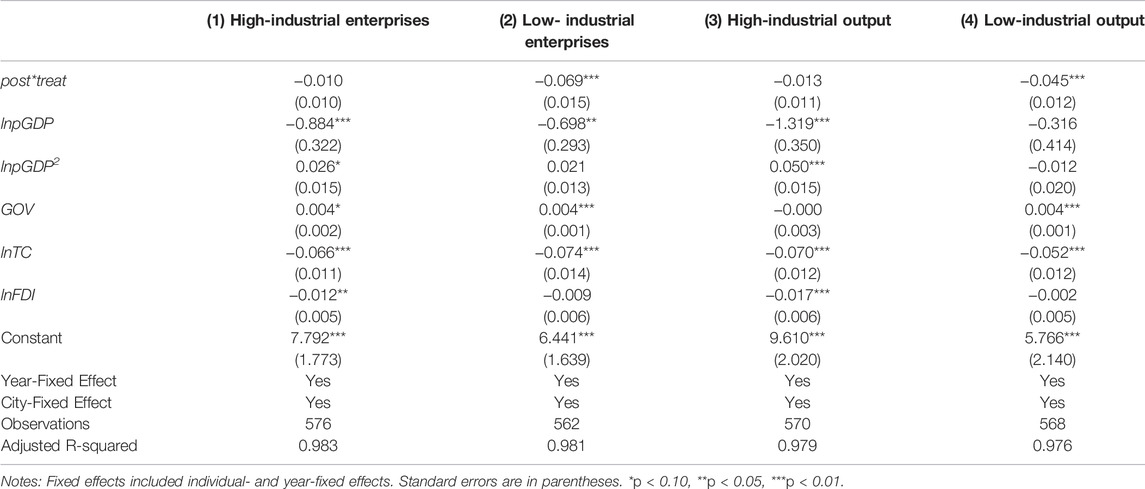
TABLE 5. Heterogeneity effects of the number of industrial enterprises and total industrial output.
In columns (1) to (4) of Table 4, we divide cities into eastern, central, western, and northeastern regions according to their location and run sub-sample regressions. For eastern and central cities, the
We believe that the main reason for this phenomenon is that the eastern and central regions have higher levels of economic development and are more capable of implementing aggressive environmental and energy conservation policies to reduce local carbon emission levels when leaders with a distinct green development philosophy come to power. For the western and central regions, the lower level of economic development makes it difficult to develop the economy while considering environmental issues. For example, the Northeast region is highly dependent on the development of secondary industries, and the local government’s promotion of secondary industries to achieve higher GDP levels will lead to an increase in carbon emission levels instead of a decrease.
In columns (1) and (2) of Table 5, we group cities by the number of industrial enterprises and run subsample regressions. If the number of industrial enterprises in a city exceeds the full sample median level, it is a high industrial enterprise city; otherwise, it is a low industrial enterprise city. For the cities with a large number of industrial enterprises, the
In columns (3) and (4) of Table 5, we group cities by the gross industrial output and run subsample regressions. If the gross industrial output of a city is higher than the full sample median level, it is a city with a high gross industrial output value; otherwise, it is a city with a low gross industrial output value. For cities with high gross industrial output, the
The regression results demonstrate that the decrease in carbon emission intensity mainly comes from the highly politically sensitive cities with a small number of industrial enterprises and a low industrial output value, while the carbon emission intensity of cities with a large number of industrial enterprises and a high industrial output value does not change significantly after the change of national leaders. We believe that the reason for this phenomenon is that the economic development of cities with a large number of industrial enterprises or a high total industrial output value depends on industrial enterprises, and reducing their carbon emission intensity by restricting the entry or development of industrial enterprises is difficult for cities, which are in a dilemma between economic development and environmental protection. In contrast, the development of cities with a low number of industrial enterprises or total industrial output value does not depend on industrial enterprises. When faced with the choice of environmental and economic development, it is easier for them to achieve green urban development by restricting high-polluting industrial enterprises.
The relationship between enterprise nature and policy effect is complex. For domestic enterprises, the relationship between the government and domestic enterprises is closer. Good political connections may protect domestic enterprises from strict administrative restrictions or penalties, and they may become more indifferent to administrative orders or energy-saving policies. However, domestic companies that want to be successful must have the public relations skills to deal with government departments and officials, in addition to being highly sensitive to market opportunities. This places companies in a disadvantaged position likely to be more responsive to government administrative orders or energy efficiency policies. Hong Kong, Macao, Taiwan, or foreign-funded enterprises may move pollution-intensive enterprises to developing countries or regions with relatively lower environmental standards, resulting in higher levels of urban carbon emissions. However, they usually have advanced technology and lower carbon emission intensity than domestic enterprises.
In Table 6, we group cities by the nature of business and run subsample regressions. If the number of domestic-funded enterprises in a city exceeds the full sample median level, the city is a high domestic-funded enterprise city; otherwise, it is a low domestic-funded enterprise city. For Hong Kong, Macao, Taiwan, and foreign-funded enterprise cities, the grouping standards are the same as those for domestic enterprises. In Columns (1) and (2) of Table 6, we group cities by the number of domestic enterprises; in Columns (3) and (4) by the number of Hong Kong, Macao, and Taiwan enterprises; and in Columns (5) and (6) by the number of foreign enterprises. The regression results demonstrate that in the subgroup of cities with a relatively high number of domestic enterprises and a relatively low number of Hong Kong, Macao, Taiwan, and foreign enterprises, the high politically sensitive cities have a significant decrease in carbon emission intensity relative to the low politically sensitive cities before and after the change of top national leaders. This indicates that in the full sample regression, the decline of carbon emission intensity of cities with high political sensitivity mainly comes from cities with a high number of domestic enterprises. Instead of ignoring administrative orders and energy-saving policies due to political ties, domestic enterprises actively respond to local government policies and reduce carbon emissions to gain better political connections.
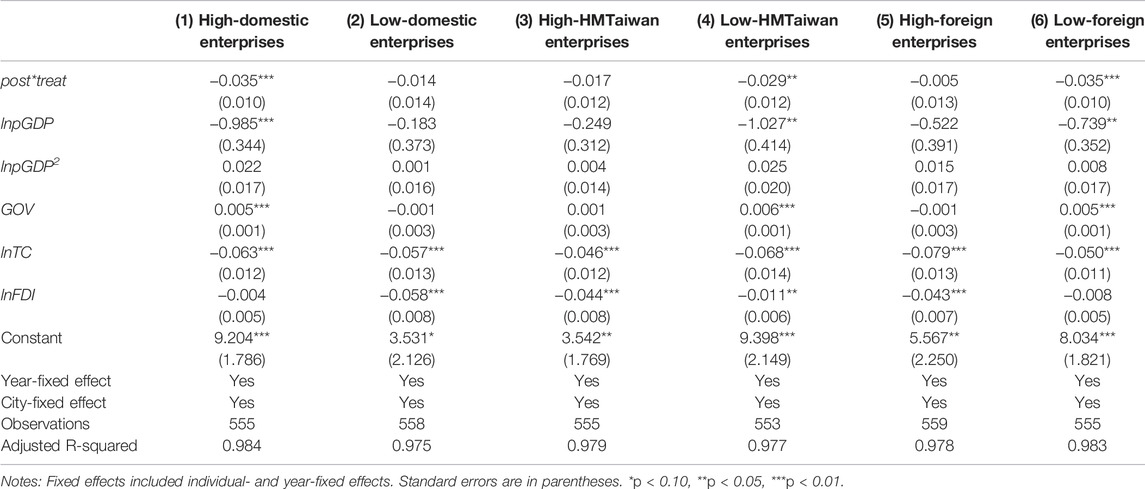
TABLE 6. Heterogeneity effects of different enterprises.
When the treatment and control groups meet the parallel trend hypothesis, the estimation results of DID attain the consistency. In other words, in the absence of policy intervention, the trend of carbon emission intensity between the treatment and control groups is consistent. We refer to the research framework of Borusyak et al. (2021) to test the parallel trend hypothesis and analyze the dynamic policy effects by the event analysis method. The specific model is as follows:
where
As illustrated in Figure 1, the
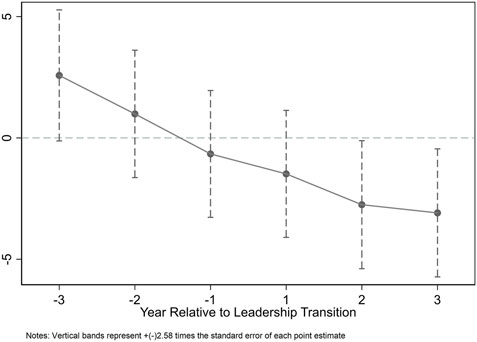
FIGURE 1. Parallel trend test.
Considering possible estimation bias due to the omission of city-time level variables, we refer to studies such as Ferrara et al. (2012), Cai et al. (2016) and others to conduct placebo tests on the main results by randomly selecting cities from the sample as the treatment group sample. We first construct a placebo test dummy variable
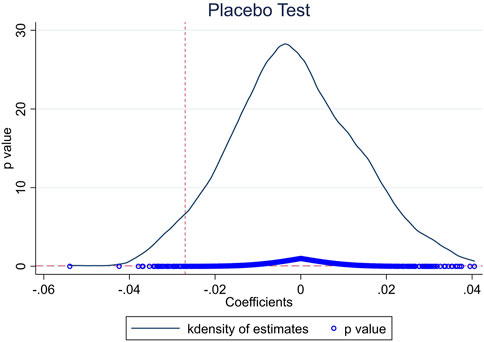
FIGURE 2. Placebo test.
We divide the total carbon emissions by the total urban GDP, add 1, and take the natural logarithm as a proxy variable for carbon emissions intensity. The regression results are illustrated in Column (1) of Table 7. The
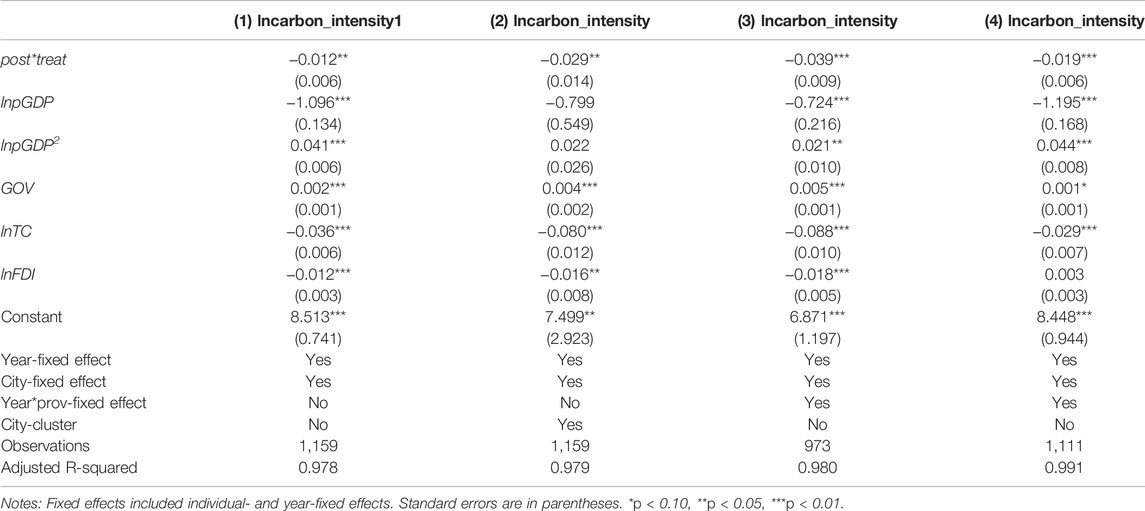
TABLE 7. Variable replacement, sample selection, and model setting.
This study’s baseline regression results demonstrate that national leaders with distinct green development concepts coming into power promote the reduction of carbon emission intensity in cities with high political sensitivity. This raises the following question: What is the impact on the emission of other pollutants? Is there a synergistic effect between carbon reduction and pollution reduction? We mainly consider industrial wastewater emission intensity (IWW), industrial sulfur dioxide emission intensity (ISD), and industrial fume emission intensity (IF)1, and take them as explanatory variables of Eq. 1 for a regression. The regression results are illustrated in Table 8 and demonstrate that the coefficients of
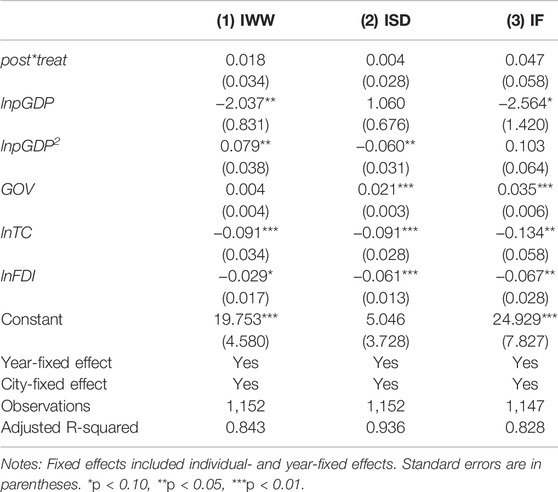
TABLE 8. Regression results from the synergistic effect of carbon reduction and pollution reduction.
In October 2011, the National Development and Reform Commission issued the Notice on Carbon Emissions Trading Pilot Work, and China launched a carbon emissions trading pilot in seven provinces, including Beijing, Tianjin, Shanghai, Chongqing, Hubei, Guangdong, and Shenzhen. This policy is close to the timing of the change of national leaders and may significantly impact the assessment of carbon reduction policy effects in this study. Therefore, we regress Eq. 1 after excluding the seven pilot provinces of carbon emission trading, and the regression results are illustrated in Table 9 and demonstrate that after excluding the seven pilot provinces of carbon emission trading, the carbon emission intensity of different politically sensitive cities still has significant differences after the change in national leaders. The coefficient of the
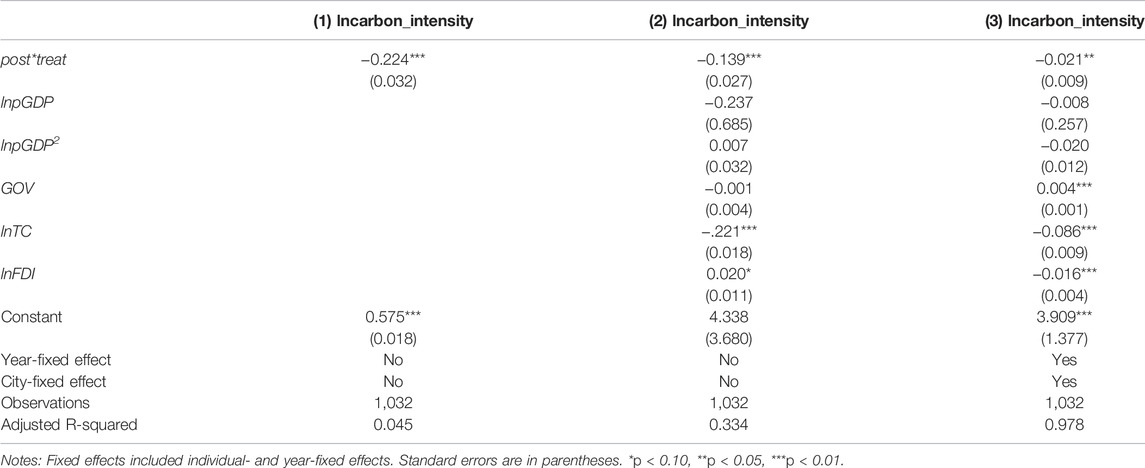
TABLE 9. Regression results excluding the influence of other policies.
Over the past 40 years, China’s economy has achieved rapid growth under the traditional factor-driven development model, accompanied by severe environmental pollution and high carbon emissions. Since 2013, China’s carbon dioxide emissions have grown at an average annual rate of 1.2%, well below the 5.8% average annual growth rate between 1978 and 2012. This is likely the result of the new Chinese government. The 18th Party Congress held in 2012 elected a new central leadership with General Secretary Xi Jinping as the core, and the 12th National People’s Congress held in 2013 established a new national leadership with Xi Jinping as the President. The new central government has proposed a series of carbon emission reduction targets and specific measures as a reflection of the fact that green development has been a part of Xi Jinping’s governing career, and Xi Jinping is a national leader with a distinctive green development philosophy.
Using a quasi-natural experiment of the election of General Secretary Xi Jinping as the top national leader, this study assesses the impact of a national leader with a distinct green development philosophy in power on carbon emissions in cities with different political sensitivities using a DID approach based on a panel dataset of Chinese cities from 2010 to 2016. This study’s main findings are as follows. First, the carbon emission intensity of cities with higher political sensitivity declined significantly after the new government with Xi Jinping as the core took office in 2013. Compared with cities with lower political sensitivity, the carbon emission intensity of cities with higher political sensitivity decreased by about 2.9%. Second, urban greening and the development of high-polluting industries are important tools for high politically sensitive cities to adjust their carbon emissions. When national leaders with a green development philosophy are in power, highly politically sensitive cities will reduce urban carbon emission levels by increasing urban green areas and limiting the development of highly polluting industries. Third, if the regional economic development level of the city is higher, the number of industrial enterprises in the city is lower, the total output value is lower, and the number of domestic enterprises in the city is higher, the enthusiasm for carbon emission reduction is higher. Fourth, the carbon emission reduction effect of cities with high political sensitivity gradually increases over time and is not affected by other carbon emission reduction policies.
Based on the above findings, we propose the following policy recommendations. First, China should improve the political sensitivity of local officials by establishing a multi-level assessment system for local officials. GDP should no longer be used as a single performance indicator, while environmental protection will be taken as an important factor in performance appraisal. Through the adjustment of promotion mechanism, the central government will improve the political sensitivity of local officials, which will help to improve the implementation effect of national policies.
Second, China should strengthen the support and guidance of urban greening and high pollution industries. Urban greening and high pollution industries are two important means for local governments to regulate carbon emissions. The state should support urban greening and relevant scientific research institutions to carry out technological innovation through financial funds, guides technological innovation in high pollution industries, and promotes green transformation and upgrading of enterprises in highly polluting industries.
Third, the state should formulate differentiated environmental protection policies. In the process of formulating command-and-control environmental regulation or market-incentive environmental regulation, the state should fully consider the political sensitivity of the city, the region of the city, the number and output value of industrial enterprises, and the number of enterprises with different property rights in different cities. The government should set different environmental rules according to the characteristics of different cities, and promote different cities to find optimal solutions between economic development and environmental protection to facilitate the achievement of carbon peaking and carbon neutrality goals.
The original contributions presented in the study are included in the article/Supplementary Material, further inquiries can be directed to the corresponding author.
ZS, conceptualization, method, writing, and supervision; PL, Software, data curation, and writing; LW, method, data collection, and writing.
This research was funded by the National Natural Science Foundation of China (grant numbers 71671193, 71871234, and 72173145).
The authors declare that the research was conducted in the absence of any commercial or financial relationships that could be construed as a potential conflict of interest.
All claims expressed in this article are solely those of the authors and do not necessarily represent those of their affiliated organizations, or those of the publisher, the editors and the reviewers. Any product that may be evaluated in this article, or claim that may be made by its manufacturer, is not guaranteed or endorsed by the publisher.
The Supplementary Material for this article can be found online at: https://www.frontiersin.org/articles/10.3389/fenrg.2022.935550/full#supplementary-material
1Industrial wastewater emission intensity (IWW) is equal to the total industrial wastewater emission divided by the total GDP and take the natural logarithm. Industrial sulfur dioxide emission intensity (ISD) is equal to the total industrial wastewater emission divided by the total GDP and take the natural logarithm. Industrial fume emission intensity (IF) is equal to the total industrial fume emission divided by the total GDP and take the natural logarithm.
Acheampong, A. O., Adams, S., and Boateng, E. (2019). Do globalization and Renewable Energy Contribute to Carbon Emissions Mitigation in Sub-saharan Africa? Sci. Total Environ. 677, 436–446. doi:10.1016/j.scitotenv.2019.04.353
An, H., Chen, Y., Luo, D., and Zhang, T. (2016). Political Uncertainty and Corporate Investment: Evidence from China. J. Corp. Finance 36, 174–189. doi:10.1016/j.jcorpfin.2015.11.003
An, Y., Zhou, D., Yu, J., Shi, X., and Wang, Q. (2021). Carbon Emission Reduction Characteristics for China's Manufacturing Firms: Implications for Formulating Carbon Policies. J. Environ. Manag. 284, 112055. doi:10.1016/j.jenvman.2021.112055
Baker, S. R., Bloom, N., and Davis, S. J. (2016). Measuring Economic Policy Uncertainty*. Q. J. Econ. 131, 1593–1636. doi:10.1093/qje/qjw024
Borusyak, K., Jaravel, X., and Spiess, J. (2021). Revisiting Event Study Designs: Robust and Efficient Estimation. arXiv. Available at: https://arxiv.org/abs/2108.12419. doi:10.48550/ARXIV.2108.12419
Cai, X., Lu, Y., Wu, M., and Yu, L. (2016). Does Environmental Regulation Drive Away Inbound Foreign Direct Investment? Evidence from a Quasi-Natural Experiment in China. J. Dev. Econ. 123, 73–85. doi:10.1016/j.jdeveco.2016.08.003
Chen, L., and Wang, K. (2022). The Spatial Spillover Effect of Low-Carbon City Pilot Scheme on Green Efficiency in China's Cities: Evidence from a Quasi-Natural Experiment. Energy Econ. 110, 106018. doi:10.1016/j.eneco.2022.106018
Cheng, M., Guo, P., Jin, J. Y., and Geng, H. (2021). Political Uncertainty and City Bank Lending in China: Evidence from City Government Official Changes. Emerg. Mark. Rev. 49, 100802. doi:10.1016/j.ememar.2021.100802
Cheong, T. S., Wu, Y., and Wu, J. (2016). Evolution of Carbon Dioxide Emissions in Chinese Cities: Trends and Transitional Dynamics. J. Asia Pac. Econ. 21, 357–377. doi:10.1080/13547860.2016.1176642
Cole, M. A. (2004). Trade, the Pollution Haven Hypothesis and the Environmental Kuznets Curve: Examining the Linkages. Ecol. Econ. 48, 71–81. doi:10.1016/j.ecolecon.2003.09.007
Cui, J., Wang, C., Zhang, J., and Zheng, Y. (2021). The Effectiveness of China's Regional Carbon Market Pilots in Reducing Firm Emissions. Proc. Natl. Acad. Sci. U.S.A. 118, e2109912118. doi:10.1073/pnas.2109912118
Deng, Y., Wu, Y., and Xu, H. (2019). Political Turnover and Firm Pollution Discharges: An Empirical Study. China Econ. Rev. 58, 101363. doi:10.1016/j.chieco.2019.101363
Dong, Z., Wang, X., Zhang, T., and Zhong, Y. (2022). The Effects of Local Government Leadership Turnover on Entrepreneurial Behavior. China Econ. Rev. 71, 101727. doi:10.1016/j.chieco.2021.101727
Eskeland, G. S., and Harrison, A. E. (2003). Moving to Greener Pastures? Multinationals and the Pollution Haven Hypothesis. J. Dev. Econ. 70, 1–23. doi:10.1016/S0304-3878(02)00084-6
Ferrara, E. L., Chong, A., and Duryea, S. (2012). Soap Operas and Fertility: Evidence from Brazil. Am. Econ. J. Appl. Econ. 4, 1–31. doi:10.1257/app.4.4.1
Francis, B. B., Hasan, I., and Zhu, Y. (2021). The Impact of Political Uncertainty on Institutional Ownership. J. Financial Stab. 57, 100921. doi:10.1016/j.jfs.2021.100921
Hou, B., Wang, B., Du, M., and Zhang, N. (2020). Does the SO2 Emissions Trading Scheme Encourage Green Total Factor Productivity? an Empirical Assessment on China's Cities. Environ. Sci. Pollut. Res. 27, 6375–6388. doi:10.1007/s11356-019-07273-6
Huang, J. (2022). Corporate Social Responsibility and Financial Performance: The Moderating Role of the Turnover of Local Officials. Finance Res. Lett. 46, 102497. doi:10.1016/j.frl.2021.102497
Huang, Y., and Luk, P. (2020). Measuring Economic Policy Uncertainty in China. China Econ. Rev. 59, 101367. doi:10.1016/j.chieco.2019.101367
Jiang, J., Xie, D., Ye, B., Shen, B., and Chen, Z. (2016). Research on China's Cap-And-Trade Carbon Emission Trading Scheme: Overview and Outlook. Appl. Energy 178, 902–917. doi:10.1016/j.apenergy.2016.06.100
Julio, B., and Yook, Y. (2012). Political Uncertainty and Corporate Investment Cycles. J. Finance 67, 45–83. doi:10.1111/j.1540-6261.2011.01707.x
Laplante, B., and Rilstone, P. (1996). Environmental Inspections and Emissions of the Pulp and Paper Industry in Quebec. J. Environ. Econ. Manag. 31, 19–36. doi:10.1006/jeem.1996.0029
Li, B., Lin, A., and Guo, D. (2020). Product Heterogeneous Effects of Economic Policy Uncertainty on Imports: Big Data Context Analysis Based on Chinese Newspapers (In Chinese). Syst. Eng. - Theory Pract. 40, 1578–1595.
Li, H., and Zhou, L.-A. (2005). Political Turnover and Economic Performance: the Incentive Role of Personnel Control in China. J. Public Econ. 89, 1743–1762. doi:10.1016/j.jpubeco.2004.06.009
Lin, B., and Zhu, J. (2019). Impact of Energy Saving and Emission Reduction Policy on Urban Sustainable Development: Empirical Evidence from China. Appl. Energy 239, 12–22. doi:10.1016/j.apenergy.2019.01.166
Liu, X., Ji, Q., and Yu, J. (2021). Sustainable Development Goals and Firm Carbon Emissions: Evidence from a Quasi-Natural Experiment in China. Energy Econ. 103, 105627. doi:10.1016/j.eneco.2021.105627
Ma, L., and Liang, J. (2018). The Effects of Firm Ownership and Affiliation on Government's Target Setting on Energy Conservation in China. J. Clean. Prod. 199, 459–465. doi:10.1016/j.jclepro.2018.07.170
Niu, Z., and Zhou, X. (2022). Political Uncertainty and Corporate Sustainability: How Does Official Turnover Affect Environmental Investment. Asia-Pacific J. Account. Econ., 1–20. doi:10.1080/16081625.2022.2067200
Omer, A. M. (2008). Energy, Environment and Sustainable Development. Renew. Sustain. Energy Rev. 12, 2265–2300. doi:10.1016/j.rser.2007.05.001
Ouyang, X., Fang, X., Cao, Y., and Sun, C. (2020). Factors behind CO2 Emission Reduction in Chinese Heavy Industries: Do Environmental Regulations Matter? Energy Policy 145, 111765. doi:10.1016/j.enpol.2020.111765
Pan, X., Ai, B., Li, C., Pan, X., and Yan, Y. (2019). Dynamic Relationship Among Environmental Regulation, Technological Innovation and Energy Efficiency Based on Large Scale Provincial Panel Data in China. Technol. Forecast. Soc. Change 144, 428–435. doi:10.1016/j.techfore.2017.12.012
Pei, Y., Zhu, Y., Liu, S., Wang, X., and Cao, J. (2019). Environmental Regulation and Carbon Emission: The Mediation Effect of Technical Efficiency. J. Clean. Prod. 236, 117599. doi:10.1016/j.jclepro.2019.07.074
Pu, Z., and Fu, J. (2018). Economic Growth, Environmental Sustainability and China Mayors' Promotion. J. Clean. Prod. 172, 454–465. doi:10.1016/j.jclepro.2017.10.162
Shah, A. A., Dar, A. B., and Bhanumurthy, N. R. (2021). Are Precious Metals and Equities Immune to Monetary and Fiscal Policy Uncertainties? Resour. Policy 74, 102260. doi:10.1016/j.resourpol.2021.102260
Shahsavari, A., and Akbari, M. (2018). Potential of Solar Energy in Developing Countries for Reducing Energy-Related Emissions. Renew. Sustain. Energy Rev. 90, 275–291. doi:10.1016/j.rser.2018.03.065
Shen, Y., Fu, L., and Zhao, J. (2015). An Empirical Study on the Influence of the Replacement of Municipal Party Secretary on Enterprise Rent-Seeking (In Chinese). China indu. Econ., 1–17. doi:10.19581/j.cnki.ciejournal.2015.09.003
Shi, X., Yu, J., and Cheong, T. S. (2020). Convergence and Distribution Dynamics of Energy Consumption Among China's Households. Energy Policy 142, 111496. doi:10.1016/j.enpol.2020.111496
Shuai, C., Shen, L., Jiao, L., Wu, Y., and Tan, Y. (2017). Identifying Key Impact Factors on Carbon Emission: Evidences from Panel and Time-Series Data of 125 Countries from 1990 to 2011. Appl. Energy 187, 310–325. doi:10.1016/j.apenergy.2016.11.029
Song, M., Zhao, X., and Shang, Y. (2020). The Impact of Low-Carbon City Construction on Ecological Efficiency: Empirical Evidence from Quasi-Natural Experiments. Resour. Conservation Recycl. 157, 104777. doi:10.1016/j.resconrec.2020.104777
Sun, Y., Li, Y., Yu, T., Zhang, X., Liu, L., and Zhang, P. (2021). Resource Extraction, Environmental Pollution and Economic Development: Evidence from Prefecture-Level Cities in China. Resour. Policy 74, 102330. doi:10.1016/j.resourpol.2021.102330
Tran, D. V., and Houston, R. (2021). The Effects of Policy Uncertainty on Bank Loan Loss Provisions. Econ. Model. 102, 105575. doi:10.1016/j.econmod.2021.105575
Wang, H., Chen, Z., Wu, X., and Nie, X. (2019). Can a Carbon Trading System Promote the Transformation of a Low-Carbon Economy under the Framework of the Porter Hypothesis? -Empirical Analysis Based on the PSM-DID Method. Energy Policy 129, 930–938. doi:10.1016/j.enpol.2019.03.007
Xian, Y., Yu, D., Wang, K., Yu, J., and Huang, Z. (2022). Capturing the Least Costly Measure of CO2 Emission Abatement: Evidence from the Iron and Steel Industry in China. Energy Econ. 106, 105812. doi:10.1016/j.eneco.2022.105812
Xu, C. (2011). The Fundamental Institutions of China's Reforms and Development. J. Econ. Literature 49, 1076–1151. doi:10.1257/jel.49.4.1076
Xu, N., Chen, Q., Xu, Y., and Chan, K. C. (2016). Political Uncertainty and Cash Holdings: Evidence from China. J. Corp. Finance 40, 276–295. doi:10.1016/j.jcorpfin.2016.08.007
You, D., Zhang, Y., and Yuan, B. (2019). Environmental Regulation and Firm Eco-Innovation: Evidence of Moderating Effects of Fiscal Decentralization and Political Competition from Listed Chinese Industrial Companies. J. Clean. Prod. 207, 1072–1083. doi:10.1016/j.jclepro.2018.10.106
Yu, J., Shi, X., Guo, D., and Yang, L. (2021). Economic Policy Uncertainty (EPU) and Firm Carbon Emissions: Evidence Using a China Provincial EPU Index. Energy Econ. 94, 105071. doi:10.1016/j.eneco.2020.105071
Yu, P., Hao, R., Cai, Z., Sun, Y., and Zhang, X. (2022). Does Emission Trading System Achieve the Win-Win of Carbon Emission Reduction and Financial Performance Improvement? -Evidence from Chinese A-Share Listed Firms in Industrial Sector. J. Clean. Prod. 333, 130121. doi:10.1016/j.jclepro.2021.130121
Zhang, Y.-J., and Wang, W. (2021). How Does China's Carbon Emissions Trading (CET) Policy Affect the Investment of CET-Covered Enterprises? Energy Econ. 98, 105224. doi:10.1016/j.eneco.2021.105224
Zhang, Y., Guo, S., Shi, X., Qian, X., and Nie, R. (2021). A Market Instrument to Achieve Carbon Neutrality: Is China's Energy-Consumption Permit Trading Scheme Effective? Appl. Energy 299, 117338. doi:10.1016/j.apenergy.2021.117338
Zhao, Z., Yuan, T., Shi, X., and Zhao, L. (2020). Heterogeneity in the Relationship between Carbon Emission Performance and Urbanization: Evidence from China. Mitig. Adapt. Strateg. Glob. Change 25, 1363–1380. doi:10.1007/s11027-020-09924-3
Zhou, Y., and Huang, L. (2016). Have U.S. Power Plants Become Less Technically Efficient? the Impact of Carbon Emission Regulation. Energy Econ. 58, 105–115. doi:10.1016/j.eneco.2016.06.007
Keywords: leadership change, green development concept, political sensitivity, urban carbon intensity, high-pollution industries, urban greening
Citation: Su Z, Liu P and Wu L (2022) Political Sensitivity and Carbon Emissions: Evidence From a Quasi-Natural Experiment of Leadership Change in China. Front. Energy Res. 10:935550. doi: 10.3389/fenrg.2022.935550
Received: 04 May 2022; Accepted: 09 June 2022;
Published: 30 June 2022.
Edited by:
Yongping Sun, Huazhong University of Science and Technology, ChinaReviewed by:
Zhibo Zhao, Qilu University of Technology, ChinaCopyright © 2022 Su, Liu and Wu. This is an open-access article distributed under the terms of the Creative Commons Attribution License (CC BY). The use, distribution or reproduction in other forums is permitted, provided the original author(s) and the copyright owner(s) are credited and that the original publication in this journal is cited, in accordance with accepted academic practice. No use, distribution or reproduction is permitted which does not comply with these terms.
*Correspondence: Liyan Wu, d3VseTE5OTVAZm94bWFpbC5jb20=
Disclaimer: All claims expressed in this article are solely those of the authors and do not necessarily represent those of their affiliated organizations, or those of the publisher, the editors and the reviewers. Any product that may be evaluated in this article or claim that may be made by its manufacturer is not guaranteed or endorsed by the publisher.
Research integrity at Frontiers
Learn more about the work of our research integrity team to safeguard the quality of each article we publish.