- 1School of Electrical Engineering, Southeast University, Nanjing, China
- 2College of Automation and College of Artificial Intelligence, Nanjing University of Posts and Telecommunications, Nanjing, China
- 3Department of Electronic Engineering, Fatima Jinnah Women University, Rawalpindi, Pakistan
- 4Department of Electrical and Computer Engineering, King Abdulaziz University, Jeddah, Saudi Arabia
The permanent magnet (PM) machine has been widely applied in the areas of wind power and electric vehicles. As one of the most common electric faults, high-resistance connection (HRC) will induce 2nd-order components in the dq-axis current and voltage, which can be used for HRC diagnosis. However, these HRC-introduced 2nd-order components are also affected by the current closed-loop control, which ought to be taken into consideration for an accurate HRC diagnosis. In this study, a mathematical model of the 2nd-order components in the dq-axis current and voltage for the current closed-loop controlled PM machine is derived, and based on the model, a new HRC diagnosis method is proposed. In the proposed method, not only the location of HRC but also HRC severity can be accurately obtained. Simulations and experiments have been carried out to validate the effectiveness of the proposed method.
1 Introduction
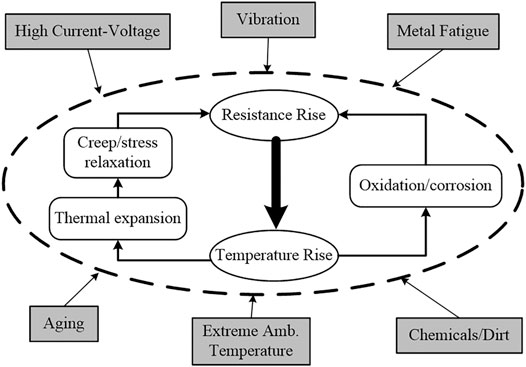
Recently, due to the advantages of high power density and high efficiency, the permanent magnet (PM) machine has been increasingly applied in the area of wind power and electric vehicles. The direct-driven permanent magnet synchronous generator is the most widely used scheme for high-power wind power generation, such as the large-scale intertidal and offshore wind turbines. However, the complex operating environment may cause unexpected faults to the machine. The high-resistance connection (HRC) (or called a resistance unbalance fault) is one of the common electrical faults for the PM machine (Hang et al., 2020a; Hang et al., 2021). Figure 1 (Braunovic et al., 2006) shows the failure mechanism of HRC. It is found that HRC can cause increased torque pulsation, decreased average torque, increased current, and voltage imbalance in the machine. The continuous HRC status of the PM machine may lead to excessive heating, which further increases the connection resistance. If these positive feedback loops are not broken, the HRC may propagate into uncontrolled consequences and even lead to catastrophic failure. Thus, it is of significant importance to detect the HRC fault and prevent potential severe damages (Gritli et al., 2013; Zarri et al., 2013).
Many methods have been put forward to detect the HRC for induction machines, which are mainly based on stator current and voltage signals (Yun et al., 2007; Yun et al., 2009; Gritli et al., 2013; de la Barrera et al., 2014; de la Barrera et al., 2015; Mengoni et al., 2015; Antonino-Daviu et al., 2017; Hang et al., 2019; Hang et al., 2020b; Hang et al., 2020a; Hang et al., 2020c; Hang et al., 2021). In the study by Antonino-Daviu et al. (2017), the HRC of the wound rotor induction machine is detected by a series of frequency-domain characteristics of stator current. In the study by Yun et al. (2007), a dynamic model of the induction machine with HRC is established, and the negative-sequence current and the zero-sequence voltage are used for HRC diagnosis. An additional negative-sequence current controller is introduced by Mengoni et al., (2015) to compensate for the current imbalance caused by HRC and the output of the negative-sequence PI regulators is used to detect HRC. In the study by Yun et al. (2009), the negative-sequence current and zero-sequence voltage features are combined to realize the detection and classification of HRC and interturn fault. In the study by de la Barrera et al. (2014), the voltage between the machine’s neutral point and the dc-link negative terminal is measured to detect HRC. In the study de la Barrera et al. (2015), the improved dc signal injection is proposed to generate dc current components in the machine stator and the dc component in the line voltage is extracted online to calculate the HRC indicator. Recently, literature focusing on HRC detection for the PM machine has been put forward. In a study by (Hang et al. 2017; Hang et al. (2019); Hu et al. (2020); Hang et al. (2020b), the HRC is detected based on the zero-sequence voltage measured through a resistor network, where the faulty phase can be located and the fault severity can be estimated. In the study by Hang et al. (2020c), flux linkage biases are injected into the flux control loop to generate dc current in the stator. Then, the dc component in the measured zero-sequence voltage is extracted to estimate the resistance deviations. However, for all the fault diagnosis methods based on zero-sequence voltage, the neutral point of the machine must be accessible, which is not always available in real applications. In the study by Hang et al. (2020a), the HRC is detected by estimating the voltage distortions using the reference model. Similar to the idea of Hang et al. (2020b), high-order sliding mode controllers are proposed by Kommuri et al. (2020) to realize HRC-tolerant control and fault severity estimation. However, the dq-axis current of the faulty PM machine is assumed to be constant by Hang et al., (2020c), which may not be satisfied when the PI current controllers have relatively low control bandwidth or when the HRC resistance deviation is significant. In contrast, the bandwidth of the PI current controllers in the study by Kommuri et al., (2020) is set to be relatively low, which results in the apparent asymmetrics of the stator current when HRC occurs. In application, the current closed-loop control affects both the current and voltage fault features, but this effect has not been well-analyzed in previous works.
In this study, the mathematical model of the HRC-induced 2nd-order components in the dq-axis current and voltage is derived, where the current closed-loop effect is taken into consideration. Based on the established mathematical model, a new HRC diagnosis method is proposed. In the proposed method, not only the location of HRC can be identified but also the HRC severity can be accurately estimated.
The whole article is organized as follows: In Section 2, the model of the PM machine with HRC is established, and the current closed-loop effect is analyzed in Section 3. In Section 4, the proposed HRC diagnosis method is presented. Section 5 validates the proposed diagnosis method by simulations. In addition, experiment results are presented in Section 6 to show the effectiveness of the proposed method. Finally, conclusions are drawn in Section 7.
2 Permanent Magnet Machine With High-Resistance Connection
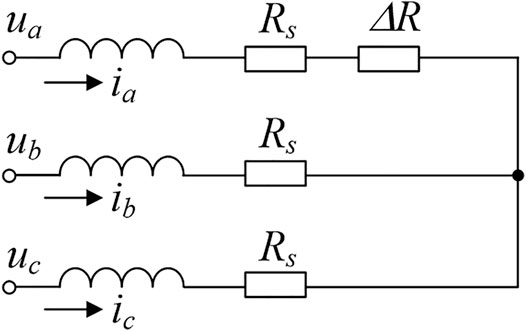
The HRC in the PM machine can be modeled by adding resistance in the faulty phase. Without loss of generality, the HRC is assumed in phase A, as shown in Figure 2, where the ua, ub, and uc are the stator voltage, ia, ib, and ic are the stator current, Rs is the stator phase resistance, and ΔR represents the resistance deviation in phase A. Then, the voltage equations of the PM machine under HRC conditions can be expressed as (Hang et al., 2017).
where
The ea, eb, and ec are the back-EMF of the PM machine. In the stator inductance matrix [Ls], the La, Lb, and Lc are the stator phase self-inductance and Mac, Mbc, and Mab are the mutual-inductance. The PM machine model in the synchronous frame can be obtained by applying Park’s transform to Eq. 1, and it yields.
where ud and uq are the dq-axis voltages, id and iq are the dq-axis current, and Ld and Lq are the dq-axis inductances of the PM machine. The ed and eq represent the coupling terms between the dq-axis voltage equations of the PM machine and can be expressed as
where ωe is the electrical angular speed and ψf is the PM flux linkage. The eHRCd and eHRCq are the terms introduced by the HRC and can be expressed as follows:
where θe is the electrical angle of the PM machine rotor.
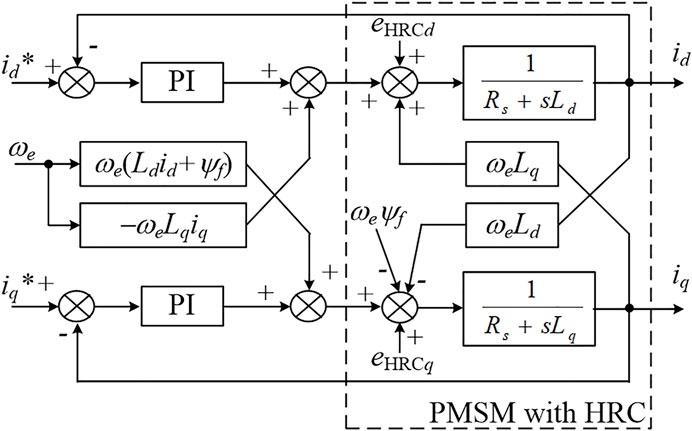
In the permanent magnet synchronous power generation (PMSG) and the PM machine drive system, the feed-forward compensation is commonly used to realize the dq-axis decoupling of the PM machine, as shown in Figure 3.
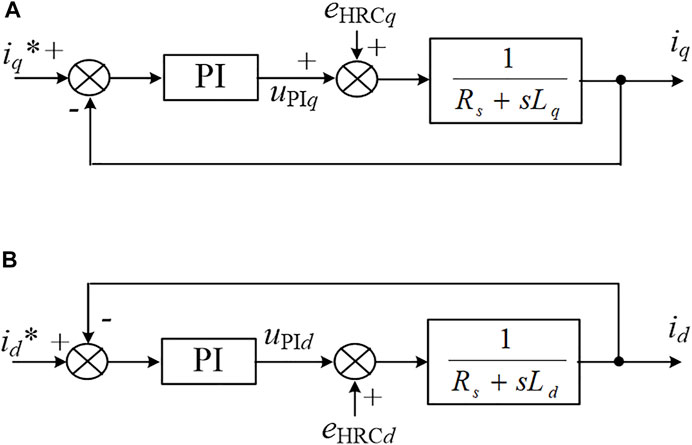
Then, the current controller diagram of the PM machine with HRC can be simplified after dq-axis decoupling, as shown in Figure 4.
For a healthy PM machine, namely, the eHRCd and eHRCq equal 0 and the ideal dq-axis currents and voltages are of constant values. But, the eHRCd and eHRCq can induce harmonics in the dq-axis currents and voltages. According to Eq. 9, the eHRCd and eHRCq mainly comprise the 2nd-order and dc components. Thus, the 2nd-order component will appear in the dq-axis signals, such as current signals id and iq, and the voltage signals uPId and uPIq. Figure 5 can be derived from Figure 4A, where only the 2nd-order components are considered (the subscript 2 represents the 2nd-order component). As the HRC can introduce 2nd-order torque to the PM machine (Braunovic et al., 2006), perturbation of the same frequency will be induced in the speed signal. Considering that the iq* is the output of the speed closed-loop controller, the iq* signal will also contain a 2nd-order component iq,2*, which is significantly affected by the speed closed-loop controller and the mechanical parameters of the machine. Therefore, it can be drawn that the iq,2 and uPIq,2 are also affected by the speed closed-loop controller and the machine’s mechanical parameters.
Similarly, the 2nd-order components in the d-axis current control diagram can be derived, as shown in Figure 6. For the commonly used id* = 0 method in the PM machine drive system, no 2nd-order component exists in the id* signal. It is apparent that the id,2 and uPId,2 are generated only by the eHRCd,2 and are independent of the mechanical-related parameters. Thus, the id,2 and uPId,2 may be better signals for HRC diagnosis.
3 Current Closed-Loop Effect
In this section, the expressions of the id,2 and uPId,2 for the PM machine with HRC fault are derived in detail, where the current closed-loop effect is taken into consideration. It can be drawn from Figure 6 that the id,2 satisfies.
where Kp and Ki are the proportional and integral gains, respectively, and ωe is the electric angular speed of the PM machine. Therefore, the id,2 and uPId,2 satisfy.
where Tid is
The id,2 and eHRCd,2 can be expressed as
where the Id,2 and θid,2 are the amplitude and initial phase angle of the id,2. The EHRCd,2 and θeHRCd,2 are the amplitude and initial phase angle of the eHRCd,2, respectively. Also, it has
Similarly, the uPId,2 can be expressed as
where the UPId,2 and θuPId,2 are the amplitude and initial phase angle of the uPId,2, respectively. Also, the uPId,2 satisfies
where
where the ωe is the electric angular speed of the PM machine. Thus, it has
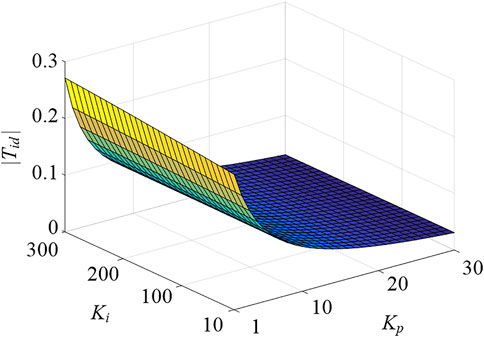
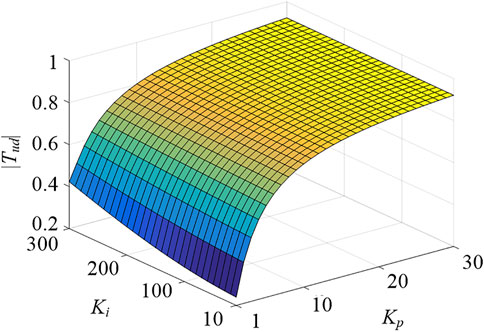
It is apparent that |Tid| and |Tud | are greatly affected by the values of Kp and Ki. Figures 7, 8 show the |Tid| and |Tud| versus different Kp and Ki values, where the PM machine operates at the speed of 300 r/min and its parameters are shown in Table 1. For the current closed-loop controller with high bandwidth, namely, when the Kp and Ki are relatively large, the amplitude of |Tid| is close to 0, while the |Tud| is close to 1. Therefore, the id,2 is well-suppressed by the high bandwidth current closed-loop and only has quite a decreased amplitude. But the uPId,2 has an increased amplitude under this condition. On the contrary, for the current closed-loop controller with low bandwidth, the amplitude of uPId,2 may be small, while the id,2 may have a relatively larger amplitude.
4 High-Resistance Connection Diagnosis
In industrial applications, it is preferred to design a high bandwidth current closed-loop to obtain better control performance of the PM machine. Therefore, the HRC induced uPId,2 commonly has a relatively large amplitude and is more suitable for the diagnosis of HRC.
The frequency tracking algorithm (Hang et al., 2017) is used for online extraction of the 2nd-order component from the uPId signal, and it has
where LP represents the low-pass filter. Thus, the uPId,2 can be written as
In addition, it has
The amplitude UPId,2 can be defined as the HRC detection indicator, which is 0 in theory for a healthy PM machine. According to (20), the amplitude and initial phase of id,2 and eHRCd,2 can be calculated as
where TPI and Tud can be easily calculated since the ωe can be obtained through the encoder and the parameters of the current controller are known.
According to Eq. 9, for the case that the HRC occurs in phase A, the eHRCd,2 can also be expressed as
where id,0 and iq,0 are the dc components of id and iq. The Ca is defined as the characteristic current of phase A and can be obtained by
where
Combining Eqs 14, 27, and 28 yields
If the HRC occurs in phase B, the eHRCd,2 can be written as
where
Similarly, if the HRC occurs in phase C, the eHRCd,2 can be written as
where
The Icb and θcb are the amplitude and initial phase angle of the Cb, and Icc and θcc are the amplitude and initial phase angle of the Cc, respectively. If the HRC occurs in phase A, only the θca equals θeHRCd,2, and the θcb and θcc will keep a distance to the θeHRCd,2. Therefore, the location of the HRC can be simply judged by respectively comparing the extracted θca, θcb, and θcc with the calculated θeHRCd,2. Also, after the HRC is located in phase A, the resistance deviation in the faulty phase can be easily calculated according to Eq. 31, and it has
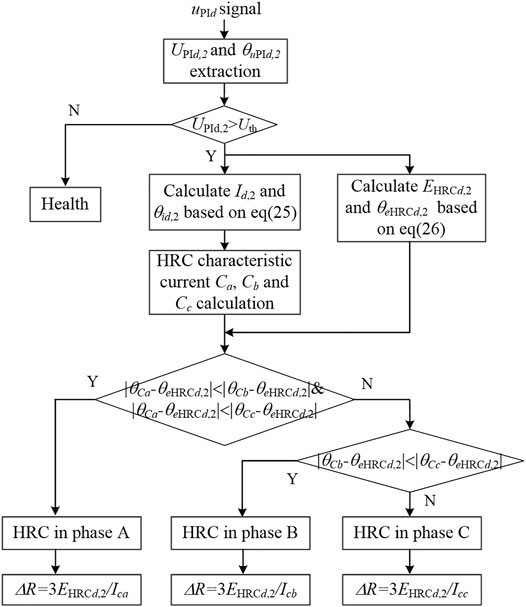
Figure 9 shows the flow chart of the HRC diagnosis process. The online HRC diagnosis process steps are summarized as follows:
Step 1. HRC detection. The 2nd-order component of uPId is extracted online using the frequency tracking algorithm. Then, the HRC can be detected once the amplitude UPId,2 is larger than the preset detection threshold Uth.
Step 2. HRC location. After the HRC is detected, the eHRCd,2 and the three HRC characteristic current Ca, Cb, and Cc are calculated. The characteristic current for the faulty phase has the initial phase closest to the θeHRCd,2.
Step 3. HRC severity estimation. After the faulty phase is located, the resistance deviation ΔR can be calculated according to the ΕHRCd,2 and the amplitude of the characteristic current of the faulty phase.
5 Simulations
The PM machine drive system with HRC is established in Matlab/Simulink, where the parameters of the PM machine are listed in Table 1.
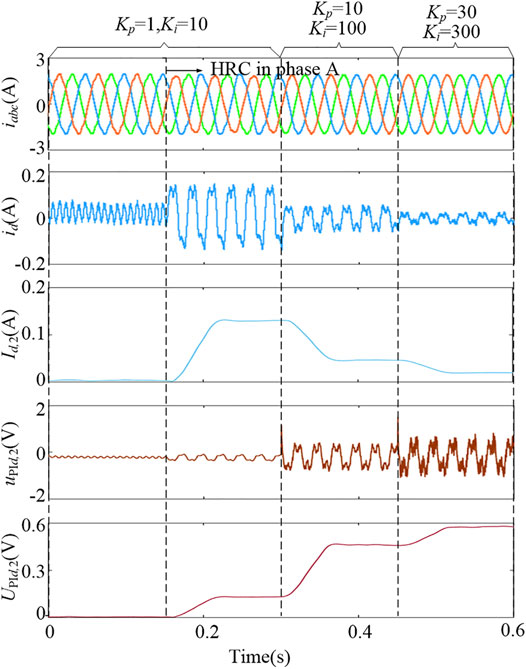
Figure 10 shows the simulation results of the PM machine with different Kp and Ki, where the PM machine operates with a rated load at a speed of 300 r/min. The Kp and Ki are, respectively, set to be 1 and 10 for t∈[0, 0.3]. Before t = 0.15 s, no HRC occurs to the PM machine, and the sinusoidal degree of the stator current is not high because of the low control bandwidth. The ripple in the d-axis current id is mainly made up of the 6th-order component, which is caused by the inverter nonlinearity, such as the dead-time effect. But, nearly no 2nd-order component exists in the id and uPId. HRC (ΔR = 1Ω) is set in phase A at t = 0.15 s, and then the 2nd-order component appears in the id and uPId signals. In addition, for the larger Kp and Ki (the higher control bandwidth), the harmonics in the stator current are well-suppressed by the current closed-loop controller. The Id,2 decreases with the increase of control bandwidth, while the UPId,2 increases with the increase of control bandwidth, which agrees well with the analysis in Section 3.
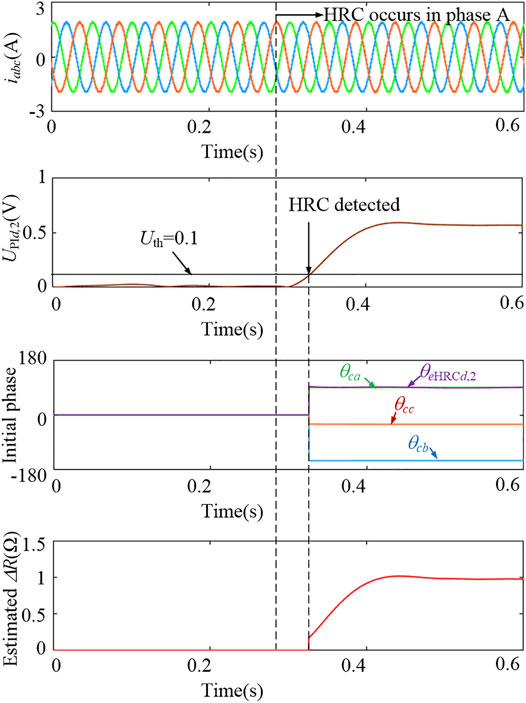
Considering that the high bandwidth current closed-loop is preferred in industry application, the case Kp = 30 and Ki = 300 is analyzed in the following part. Figure 11 shows the waveforms of the PM machine operating with rated load at a speed of 300 r/min, where the HRC (ΔR = 1Ω) occurs in phase A at t = 0.3 s. With the high bandwidth current closed-loop control, the stator current is well-controlled to be sinusoidal, and nearly no changes can be seen in the stator current after the HRC occurs. But when the HRC (ΔR = 1Ω) occurs in phase A at t = 0.3 s, the amplitude of UPId,2 immediately increases, and the HRC can be detected when the UPId,2 is larger than the preset detection threshold Uth. After the HRC is detected, the HRC location and severity estimation is activated. It can be seen in Figure 11 that the extracted θca is quite closest to the θeHRCd,2. Thus, the HRC can be located in phase A. The calculated ΔR eventually converges to 0.98Ω, which agrees well with the real ΔR value.
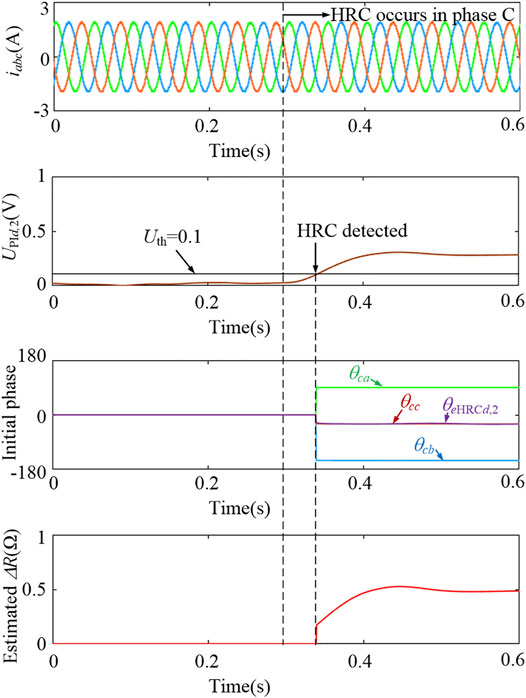
Figure 12 shows the waveforms of the PM machine operating with rated load at a speed of 300 r/min, where the HRC (ΔR = 0.5Ω) occurs in phase C at t = 0.3 s. The HRC can be quickly detected in less than 0.1 s, and the faulty phase can be accurately located in phase C. In addition, the estimated ΔR is 0.49Ω and is almost the same as the theoretical value. More simulations are conducted for the PM machine operating under different conditions, where the HRC (ΔR = 0.5Ω) is set in phase A. Figure 13A shows the estimated ΔR for the PM machine operating with rated load at different speeds. Also, Figure 13B shows the estimated ΔR for the PM machine operating with different loads at 300 r/min. It is shown in Figure 13 that the estimated ΔR is quite accurate under most operating conditions. But the ΔR cannot be directly estimated for the PM machine with a very light load. This is because the HRC-induced fault feature is dependent on the stator current, which only has small amplitude under light load. The d-axis current injection is used to solve this problem.
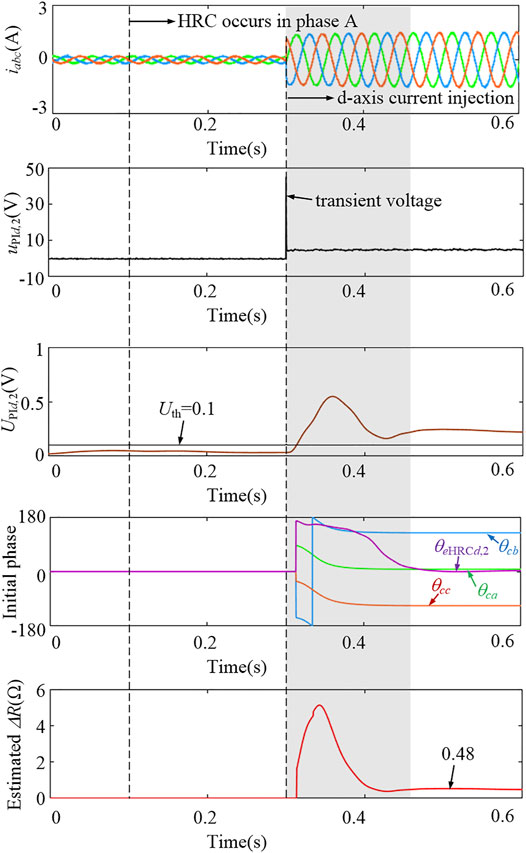
Figure 14 shows the waveforms of the HRC detection under 10% load at 300 r/min speed. After HRC (ΔR = 0.5Ω) occurs in phase A at t = 0.1 s, the extracted amplitude UPId,2 remains smaller than the Uth, and the HRC may not be detected. With the d-axis current of 1.5 A injected into the machine, the stator current amplitude is immediately increased. However, the transient voltage in the uPId signal can cause a large fluctuation to the extracted UPId,2 and lead to a false diagnosis result, as shown in the shadow part in Figure 14. But a simple time delay can be inserted after the d-axis current injection to avoid the transient voltage effect. As shown in Figure 14, the estimated ΔR converges to 0.48Ω about 0.2 s after the d-axis current injection, and the faulty phase is located in phase A. It is worth mentioning that the interturn fault in the stator can also induce the 2nd-order component in the id and uPId (Ebrahimi and Faiz, 2010), which might cause false detection for the proposed method. The d-axis current injection can also be used to realize the discrimination between the HRC and interturn fault since the HRC fault feature can be apparently enlarged, while the interturn fault feature may not vary obviously due to the d-axis current injection (Urresty et al., 2015).
6 Experiment
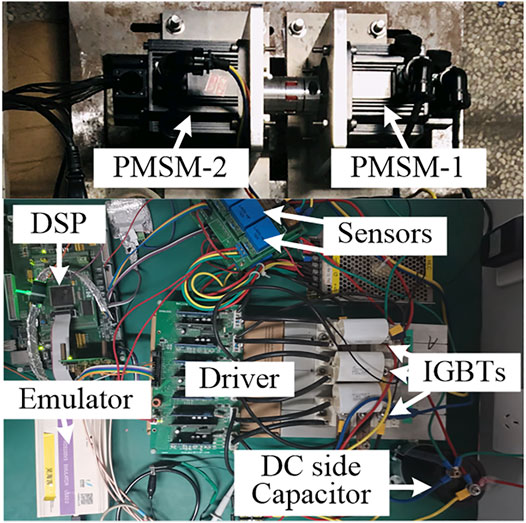
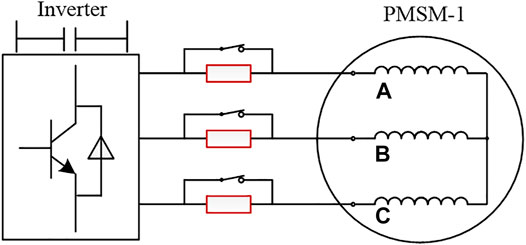
An experimental platform has been built to validate the proposed method, as shown in Figure 15. The PM machine-1 and PM machine-2 have the same parameters as presented in Table 1, and the PM machine-1 is used as a load, while PM machine-2 is used as the test machine. The HRC can be implemented by connecting an additional resistor in series with the phase winding, as shown in Figure 16. Also, the parallel switches are used to control whether the additional resistor is inserted.
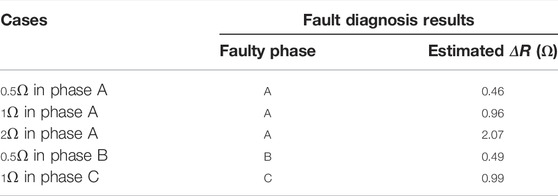
Figure 17 shows the experimental waveforms of the PM machine operating at 300 r/min with rated load. Also, the HRC (ΔR = 1Ω) is set in phase A. In Figure 13A, the parameters of the current closed-loop controller are set as Kp = 1 and Ki = 10. After the occurrence of HRC, the uPId,2x increases to 0.05 V and the uPId,2y changes to −0.14 V. Thus, the amplitude of UPId,2 can be obtained based on Eq. 23, and it is only around 0.15 V. In Figure 17B, the current closed-loop controller parameters are set as Kp = 30 and Ki = 300. After the same HRC occurs to phase A, the extracted uPId,2x is 0.04V and the uPId,2y is to −0.56 V. Therefore, the amplitude UPId,2 is 0.56 V, and it is much larger than the case where Kp = 1 and Ki = 10, which agrees well with the analysis in Section 3. The experiment results considering different cases of HRC conditions are presented in Table 2, where the PM machine operates at 300 r/min with rated load. Also, the current closed-loop controller parameters are set as Kp = 30 and Ki = 300. It can be seen that the faulty phase can be accurately located, and the estimated ΔR values are quite close to the theoretical ones.
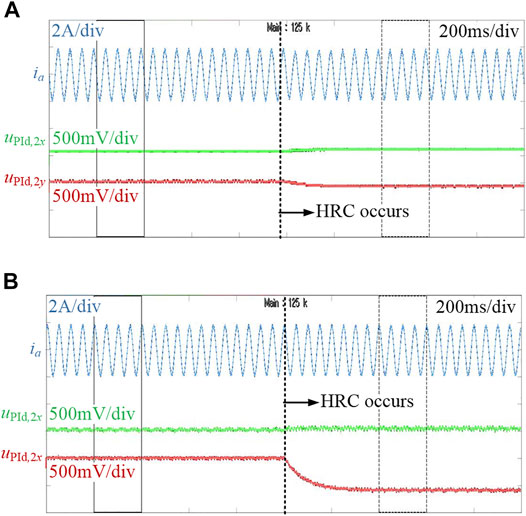
FIGURE 17. Stator current, extracted uPId,2x, and uPId,2y of the PM machine. (A) Kp = 1 and Ki = 10; (B) Kp = 30 and Ki = 300.
To further validate the proposed method, more experiments are conducted under different operating conditions. The HRC (ΔR = 1Ω) is set in phase C. The Kp and Ki are set to be 30 and 300, respectively. It can be seen in Figure 18 that the ΔR can be accurately estimated at different operating conditions. In Figure 18B, the estimated ΔR is obtained with d-axis current injection. Also, the corresponding waveforms are shown in Figure 19. As the PM machine operates at 300 r/min with only 15% load, the extracted uPId,2x and uPId,2y are 0.06 V; thus, the UPId,2 only has a value of 0.085 V, which is not larger than the detection threshold of 0.1 V, and the HRC fault may not be detected. By injecting the d-axis current of 1 A into the PM machine, the stator current is increased, and the fault feature is also enlarged as a result. It can be seen in Figure 15 that the uPId,2x changes to −0.16 V and the uPId,2y rises to −0.27 V after a short transient period. The expanded UPId,2 is 0.31 V; thus, the HRC can be detected under the light load condition.

FIGURE 18. Experimental estimated ΔR. (A) Rated load at different speed; (B) different loads at 300 r/min.
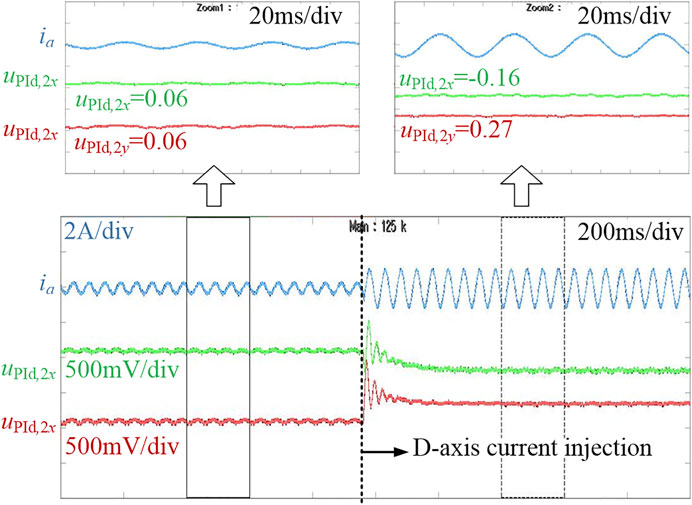
FIGURE 19. Stator current, extracted uPId,2x, and uPId,2y of the PM machine with d-axis current injection.
7 Conclusion
The HRC can induce a 2nd-order component in the dq-axis signals of the PM machine. However, as the current closed-loop bandwidth increases, the 2nd-order components in the dq-axis voltage increase. But, the 2nd-order components in the dq-axis current have an opposite trend. This study derives the mathematical model of the HRC-induced 2nd-order components in the dq-axis current and voltage. Also a new HRC diagnosis method is proposed based on the established mathematical model. In the proposed method, not only the location but also the resistance deviation ΔR can be accurately estimated. Also, the proposed method has been proven by the simulation and experiment results.
Data Availability Statement
The raw data supporting the conclusion of this article will be made available by the authors, without undue reservation.
Author Contributions
ZX did the conceptual design, simulation analysis, and writing of the manuscript. ZD and YJ revised and improved the manuscript. KC, AM, and SA organized case studies.
Funding
This work was supported by the Natural Science Research Start-up Foundation of Recruiting Talents of Nanjing University of Posts and Telecommunications (Grant No. NY219154) and the Foundation of Jiangsu Provincial Double-Innovation Doctor Program under Grant (2020) 30639.
Conflict of Interest
The authors declare that the research was conducted in the absence of any commercial or financial relationships that could be construed as a potential conflict of interest.
Publisher’s Note
All claims expressed in this article are solely those of the authors and do not necessarily represent those of their affiliated organizations, or those of the publisher, the editors, and the reviewers. Any product that may be evaluated in this article, or claim that may be made by its manufacturer, is not guaranteed or endorsed by the publisher.
References
Antonino-Daviu, J., Quijano-Lopez, A., Climente-Alarcon, V., and Garin-Abellan, C. (2017). Reliable Detection of Rotor Winding Asymmetries in Wound Rotor Induction Motors via Integral Current Analysis. IEEE Trans. Ind. Appl. 53 (3), 2040–2048. doi:10.1109/tia.2017.2672524
Braunovic, M., Myshkin, N., and Konchits, V. (2006). Electrical Contacts: Fundamentals, Applications and Technology. New York, NY, USA: Taylor & Francis.
de la Barrera, P. M., Bossio, G. R., and Leidhold, R. (2015). Online Voltage Sensorless High-Resistance Connection Diagnosis in Induction Motor Drives. IEEE Trans. Ind. Electron. 62 (7), 4374–4384. doi:10.1109/tie.2014.2385038
de la Barrera, P. M., Bossio, G. R., and Solsona, J. A. (2014). High-Resistance Connection Detection in Induction Motor Drives Using Signal Injection. IEEE Trans. Ind. Electron. 61 (7), 3563–3573. doi:10.1109/tie.2013.2278957
Ebrahimi, B. M., and Faiz, J. (2010). Feature Extraction for Short-Circuit Fault Detection in Permanent-Magnet Synchronous Motors Using Stator-Current Monitoring. IEEE Trans. Power Electron. 25 (10), 2673–2682. doi:10.1109/tpel.2010.2050496
Gritli, Y., Zarri, L., Rossi, C., Filippetti, F., Capolino, G.-A., and Casadei, D. (2013). Advanced Diagnosis of Electrical Faults in Wound-Rotor Induction Machines. IEEE Trans. Ind. Electron. 60 (9), 4012–4024. doi:10.1109/tie.2012.2236992
Hang, S., Zhang, J., Ding, S., and Cheng, M. (2017). Online Diagnosis and Localization of High-Resistance Connection in PMSM with Improved Fault Indicator. IEEE Trans. Power Electron. 32, 3585–3594.
Hang, J., Ren, X., Tang, C., Tong, M., and Ding, S. (2021). Fault-Tolerant Control Strategy for Five-phase PMSM Drive System with High-Resistance Connection. IEEE Trans. Transp. Electrific. 7 (3), 1390–1400. doi:10.1109/tte.2020.3037894
Hang, J., Wu, H., Ding, S., Hua, W., and Wang, Q. (2020b). A DC-Flux-Injection Method for Fault Diagnosis of High-Resistance Connection in Direct-Torque-Controlled PMSM Drive System. IEEE Trans. Power Electron. 35 (3), 3029–3042. doi:10.1109/tpel.2019.2924929
Hang, J., Xia, M., Ding, S., Li, Y., Sun, L., and Wang, Q. (2020a). Research on Vector Control Strategy of Surface-Mounted Permanent Magnet Synchronous Machine Drive System with High-Resistance Connection. IEEE Trans. Power Electron. 35 (2), 2023–2033. doi:10.1109/TPEL.2019.2918683
Hang, J., Yan, D., Xia, M., Ding, S., and Wang, Q. (2019). Quantitative Fault Severity Estimation for High-Resistance Connection in PMSM Drive System. IEEE Access 7, 26855–26866. doi:10.1109/access.2019.2901121
Hang, J., Zhang, J., Ding, S., Huang, Y., and Wang, Q. (2020c). A Model-Based Strategy with Robust Parameter Mismatch for Online HRC Diagnosis and Location in PMSM Drive System. IEEE Trans. Power Electron. 35 (10), 10917–10929. doi:10.1109/tpel.2020.2978139
Hu, R., Wang, J., Mills, A. R., Chong, E., and Sun, Z. (2020). Detection and Classification of Turn Fault and High Resistance Connection Fault in Permanent Magnet Machines Based on Zero Sequence Voltage. IEEE Trans. Power Electron. 35 (2), 1922–1933. doi:10.1109/tpel.2019.2922114
Kommuri, S. K., Park, Y., and Lee, S. B. (2020). High-Resistance Fault Control in Permanent Magnet Synchronous Motors. IEEE/ASME Trans. Mechatron. 25 (1), 271–281. doi:10.1109/tmech.2019.2951015
Mengoni, M., Zarri, L., Gritli, Y., Tani, A., Filippetti, F., and Lee, S. B. (2015). Online Detection of High-Resistance Connections with Negative-Sequence Regulators in Three-phase Induction Motor Drives. IEEE Trans. Ind. Appl. 51 (2), 1579–1586. doi:10.1109/tia.2014.2360963
Urresty, J.-C., Riba, J.-R., Romeral, L., and Ortega, J. A. (2015). Mixed Resistive Unbalance and Winding Inter-turn Faults Model of Permanent Magnet Synchronous Motors. Electr. Eng. 97 (1), 75–85. doi:10.1007/s00202-014-0316-z
Yun, J., Cho, J., Lee, S. B., and Yoo, J. (2007). On-line Detection of High-Resistance Connections in the Incoming Electrical Circuit for Induction Motors. IEEE Int. Electr. Mach. Drives Conf., 583–589. doi:10.1109/IEMDC.2007.382732
Yun, J., Lee, K., Lee, K.-W., Lee, S. B., and Yoo, J.-Y. (2009). Detection and Classification of Stator Turn Faults and High-Resistance Electrical Connections for Induction Machines. IEEE Trans. Ind. Appl. 45 (2), 666–675. doi:10.1109/tia.2009.2013557
Zarri, L., Mengoni, M., Gritli, Y., Tani, A., Filippetti, F., Serra, G., et al. (2013). Detection and Localization of Stator Resistance Dissymmetry Based on Multiple Reference Frame Controllers in Multiphase Induction Motor Drives. IEEE Trans. Ind. Electron. 60 (8), 3506–3518. doi:10.1109/tie.2012.2235393
Keywords: permanent magnet machine, direct-driven permanent magnet synchronous generator, wind turbine, fault diagnosis, high-resistance connection, current closed-loop control
Citation: Xu Z, Din Z, Jiang Y, Cheema KM, Milyani AH and Alghamdi S (2022) High-Resistance Connection Diagnosis Considering Current Closed-Loop Effect for Permanent Magnet Machine. Front. Energy Res. 10:933246. doi: 10.3389/fenrg.2022.933246
Received: 30 April 2022; Accepted: 20 May 2022;
Published: 04 July 2022.
Edited by:
Liansong Xiong, Nanjing Institute of Technology (NJIT), ChinaReviewed by:
Zhang Donghui, Nanjing University of Aeronautics and Astronautics, ChinaLiancheng Xiu, Wuhan University, China
Quan Sun, Nanjing Institute of Technology (NJIT), China
Xiaokang Liu, Politecnico di Milano, Italy
Copyright © 2022 Xu, Din, Jiang, Cheema, Milyani and Alghamdi. This is an open-access article distributed under the terms of the Creative Commons Attribution License (CC BY). The use, distribution or reproduction in other forums is permitted, provided the original author(s) and the copyright owner(s) are credited and that the original publication in this journal is cited, in accordance with accepted academic practice. No use, distribution or reproduction is permitted which does not comply with these terms.
*Correspondence: Yongjiang Jiang, eW9uZ2pAbmp1cHQuZWR1LmNu
 Zheng Xu
 Zakiud Din
 Yongjiang Jiang
 Khalid Mehmood Cheema
 Ahmad H. Milyani
 Sultan Alghamdi