- 1School of Mechanical and Electrical Engineering, Shandong Jianzhu University, Jinan, China
- 2School of Energy and Power Engineering, Shandong University, Jinan, China
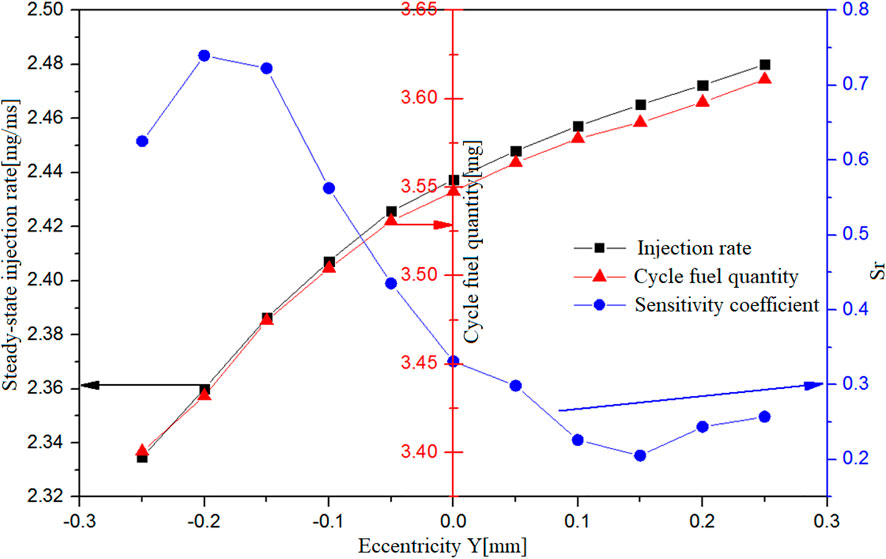
The increase in injection pressure makes it more challenging to accurately control the injection quantity of the injector of a gasoline direct injection (GDI), thus necessitating the optimization of the parameters of the nozzle holes and the clarification of such parameters in terms of their influence on the injection characteristics, so as to improve the injector’s consistency of injection characteristics. This article adopts the computational fluid dynamics (CFD) approach to investigate the influence of nozzle angle on the gas-liquid flow, cavitation state, and fuel injection rate in the hole. The results show that when the angle of concentric holes of the nozzle exceeds 65° and keeps rising further, it will lead to the gradual decrease of the injection rate during the stable period and the continuous rise of the sensitivity to the nozzle angle. The rising injection pressure would increase the sensitivity of the injection characteristics to the angle of the concentric holes, with the strongest level of sensitivity ranging between 70° and 75°. The negative pressure area on the upper inner wall of the hole would increase with the accretion of the hole angle. As the negative eccentricity rises, the injection rate would gradually drop in both the transition period and the stable period. In contrast, the increase of positive eccentricity would lead to the gradient escalation of the injection rate in the stable period. The impact of negative eccentricity is greater than that of positive eccentricity, implying that it is necessary to reduce the deviation of negative eccentricity as much as possible during the machining and positioning process so as to ensure positioning accuracy.
1 Introduction
As environmental problems are getting increasingly prominent across the globe, environmental laws and regulations have also been more and more stringent, pushing the engine industry to an unprecedented pursuit of energy conservation and environmental protection, while the fuel system of an engine plays a pivotal role in the engine’s overall performance and emission control. The injector’s characteristics affect the combustion process of the GDI engine significantly (Duan et al., 2021). Presently, the injection pressure in the fuel system of gasoline engines keeps increasing, posing more and more challenges to the accurate control of the circulating injection quantity. To improve the consistency in fuel injection characteristics of injectors and thus enhance the product performance, it is imperative to optimize the injector’s structural parameters.
It is necessary to design the injection angle between the holes of a gasoline direct injection (GDI) injector according to the positions where the injection spray drops and the status of the spray changes with the airflow. Brandon et al. (Sforzo et al., 2022) studied the detailed internal geometry of the GDI injector through the use of hard X-ray tomography, the counterbore dimensions affected the injection characteristics significantly. Due to the relation between the axial and the radial positioning, the machining process includes both concentric and eccentric nozzles when nozzle machining is carried out in the same coordinate position of the injector’s nozzle. The structure of the nozzles is an important factor that affects the characteristics of in-nozzle flow (Wu et al., 2016). Jeonghwan et al. (Park and Park, 2022) studied the step holes of GDI injectors, and the results show that the step hole dimension has a strong effect on the spray characteristics and prevent the accumulation of combustion by-products in the step hole. Substantial studies have investigated the influence of nozzle structure on the internal flow of a nozzle from the perspectives of experiment and simulation (Yao et al., 2016) and proved that the nozzle structure has a significant impact on the spray process and subsequent combustion (von Kuensberg Sarre et al., 1999; Dong et al., 2016; Som et al., 2011; Salvador et al., 2018). Zhang et al. (2016) have used the approach of high-speed X-ray phase-contrast imaging to carry out an experimental study on the impact of hole-to-hole angle on the characteristics of the near-field spray of diesel nozzles, which specifically includes the investigation of the near-field flow state at the angles of 0°, 70°, 130°, and 160°. The results show that the increase of the angle in an umbrella-shaped spray will induce a vortex flow, which would reach its strongest state at the angle of 130°. Jun et al. (2010) have simulated and analyzed the internal flow process of VOC (value covered orifice)-type and sac-type diesel nozzles, and the results show that increasing the injection pressure would aggravate the cavitation in the nozzle while enlarging the angle between the nozzle axis and the surface of the needle valve seat could smoothen the flow in the hole and reduce the cavitation.
This article discusses the influence of the difference in injection angle between the nozzle holes of a GDI injector on the injection characteristics by a CFD software AVL fire. The sensitivity of the injection characteristics to the variation of nozzle angle is analyzed. The definition of the angle between the positive and negative orifice based on the orifice axis is proposed, and the influence of the relative position between the nozzle axis and the ball center of the needle valve seat on the cavitation phenomenon in the nozzle is studied. It attempts to provide references for the optimized design of consistent injection characteristics of the holes and the identification of a reasonable eccentricity range in the machining of each nozzle.
2 Mathematical Model and Validation
To investigate the internal flow process inside the nozzle holes of a GDI injector, it is necessary to consider different factors, including the two-phase flow, turbulence, and cavitation. As the cavitating flow of a hole would contain a large amount of micro-bubble swarms, the Euler–Euler approach would be suitable to analyze the multi-phase flow (Xie and Jia, 2016). This model treats both the liquid and bubble swarms as two different phases in the same flow field and regards them as continuous media, while the phases at the inner-nozzle points in the flow field can coexist and penetrate each other. This article has used the Reynolds-averaged Navier-Stokes method (RANS) to represent the turbulence of fuel flow inside the nozzle holes of the GDI injector and adopted the modifiable two-equation (the model) eddy viscosity model as the turbulence model.
2.1 Turbulence Model
The turbulent kinetic energy could be expressed by the following equation:
where
(2) The dissipation of turbulent kinetic energy could be expressed by the following equation:
To close the turbulence equation, the following assumptions are listed:
1) The equation of turbulent kinetic energy and the equation of dissipation for single-phase flow is assumed to be closed;
2) The dissipation term is assumed to be identical to the turbulence intensity of the continuous phase;
3) The inter-phase interaction on the interaction surface could be ignored.
In terms of turbulent viscosity, the viscosity caused by shear stress (SI) and that caused by bubbles (BI) could be calculated through the Sato viscosity method as follows (Sato and Sekoguchi, 1975; Sato et al., 1981; Theofanus and Sullivan, 1982):
where the turbulent viscosity caused by shear stress is represented as:
And the turbulent viscosity caused by bubbles is represented as:
where
In the turbulence equation, the empirical coefficients for the equation of turbulent kinetic energy and that of dissipation are shown in Table 1:
2.2 Cavitation Model
Cavitation directly affects the distribution of the gas and liquid phases in the nozzle holes, and one phase is of different parameters than another, such as volume fraction, velocity, density, and temperature. Furthermore, through the exchange of momentum, energy, and mass, one phase would be coupled with another. Nevertheless, bubble dynamics equations are needed as supplements to close all the governing equations. If n0 is defined as the number of bubbles contained in a unit volume of pure liquid, the following correlation would exist in the volume fraction between the vapor phase and the liquid phase (von Kuensberg Sarre et al., 1999):
where R is the bubble radius.
Through the continuity equation, we could obtain the steam generation rate (Sato et al., 1981) as follows:
Therefore, we could calculate the variation rate of the bubble size according to the Rayleigh equation:
where
2.3 Model Verification
To verify the gas-liquid flow in the micro-nozzles, it is necessary to verify the cavitation model and the turbulence model. As mentioned earlier, a visualization experiment through a simplified nozzle at the angle of 0° has been carried out (Salvador et al., 2010; Qiu et al., 2016; Li et al., 2018; Li et al., 2019). The results show that with the increase of the injection pressure, a variation process of cavitation that is approximate to that in the experiment is simulated as Figure 1. The generation, development, and stability of cavitation are in good agreement with the experimental results. The number of mesh models is 974,000; the grid independence analysis shows that the simulation results are not affected by the number of grids when the number of grids exceed 500,000.
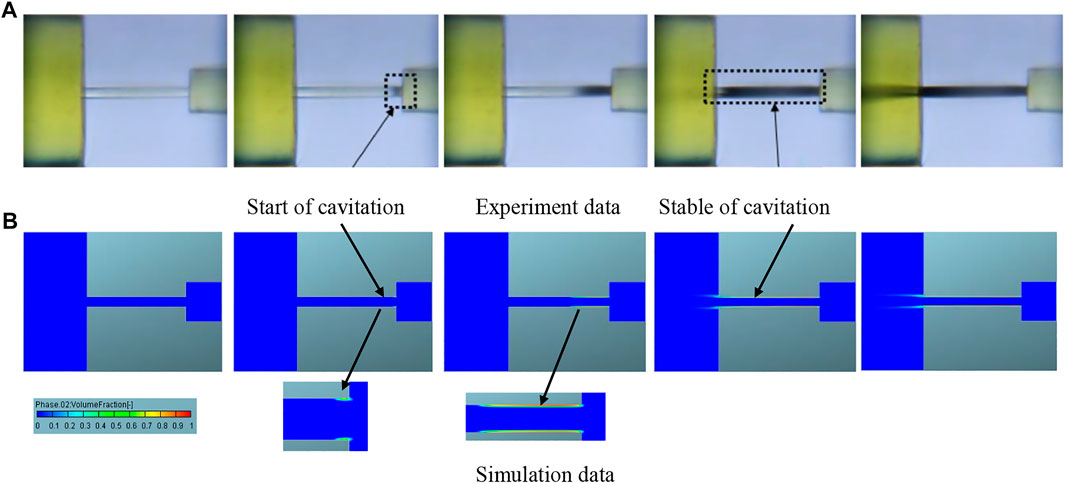
FIGURE 1. Cavitation comparison between experiment and simulation. (A) Experiment data. (B) Simulation data.
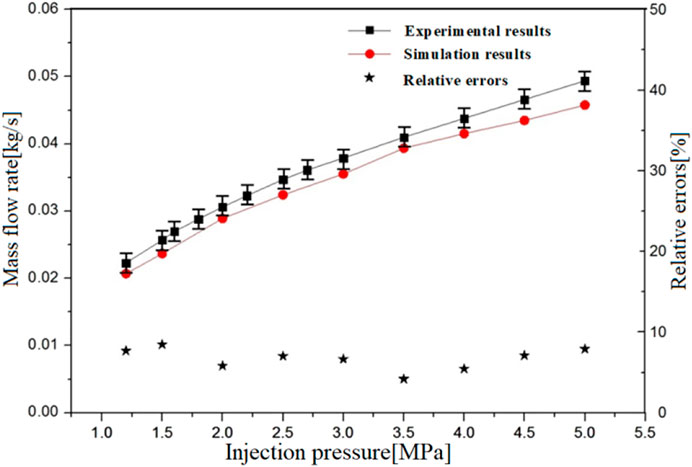
Figure 2 represents the variation curves of the mass flow rate of corresponding holes under different boundary conditions, from which we can see that as the injection pressure rises, both the experimental and simulation results show an identical variation trend. The figure also presents the relative errors between the simulation results and the experimental results, which indicates that the maximum relative error between the simulation and experimental results of mass flow under different pressure differences is less than 8%. Therefore, we could conclude that the selected turbulence model is effective for the quantitative analysis of the mass flow rate in the holes.
3 Classification and Modeling of Nozzle Angle
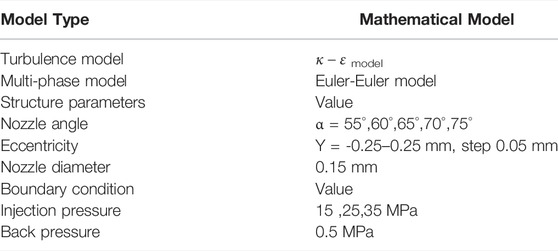
To better understand the concepts of concentric and eccentric holes, the structure of the related nozzles is presented in Figure 3. Specifically, Figure 3A shows the partial structure of the injector nozzle, where the hole is of a “Spray G″ structure that includes the needle valve, a single hole, and the needle seat. Conversely, Figure 3B presents the schematic diagram of the nozzle parameters. Figure 3C shows the grid mesh. The angle between the hole axis and the injector axis is defined as α/2, which is half of the nozzle angle, and the connecting line between the spherical center on the inner wall of the needle valve seat and the inlet center of the nozzle is regarded as the benchmark to define the nozzle angle. In that case, the nozzle angle can be defined as the angle of concentric nozzles (hereafter referred to as “concentric nozzle angle”) when the nozzle axis passes through the spherical center on the inner wall of the needle valve seat. The offset distance relative to the spherical center on the inner wall of the needle seat could be defined as Y when the nozzle axis passes through a point on the injector axis. When Y=Y1, that is, the intersection point is distant from the spherical surface of the needle seat, it would be defined as a positive nozzle angle (the actual nozzle angle is less than the concentric nozzle angle); when Y=Y2, that is, the intersection point is close to the spherical surface of the needle seat, it would be defined as a negative nozzle angle (the actual nozzle angle is greater than the concentric nozzle angle). We could use the eccentricity f Y1 and Y2 as a variable in the subsequent analysis for ease of analysis. Therefore, Y1 is defined as a positive value during the modeling analysis with a variation range at 0.05, 0.10, 0.15, 0.20, and 0.25 mm, while Y2 is defined as a negative value during the analysis with a variation range at -0.25, -0.20, -0.15, -0.10, and -0.05 mm. In terms of investigating the injection characteristics of the injector under different injection angles, the variation of the concentric nozzel angle ranges from 55°, 60°, 65°, 70°, and 75°. Based on the aforementioned definitions of the dimensions, the fluid domain model of the nozzles with different eccentricities was constructed and analyzed, and the sensitivity of injection characteristics to the variation in injection angle of different nozzles was obtained by comparing the internal flow characteristics. As a result, it identified the influence of the deviation in angle positioning on the injection characteristics during the machining process of the nozzles.
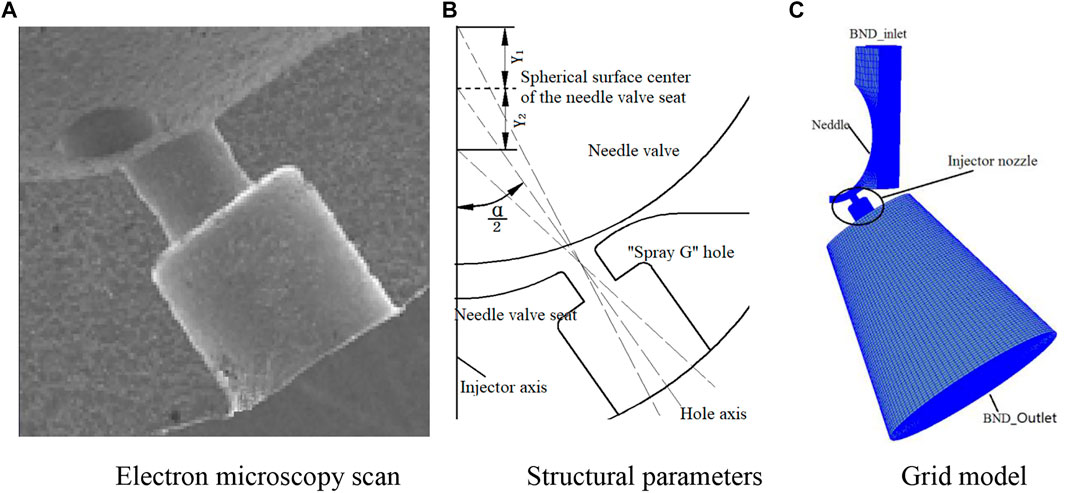
FIGURE 3. Schematic diagram of the definitions of nozzle angles of the injector. (A) Electron microscopy scan. (B) Structural parameters. (C) Grid model.
4 Result Analysis
4.1 Influence of Concentric Nozzle Angle on Injection Characteristics
4.1.1 Influence of Concentric Nozzle Angle on the Pattern of Injection
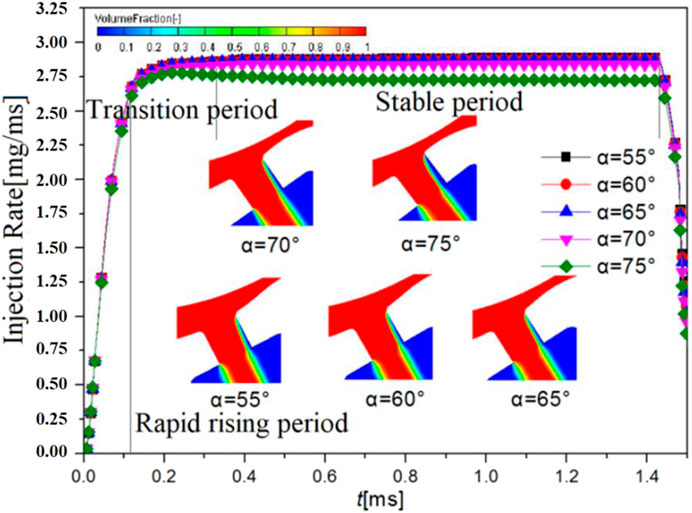
Figure 4 shows the curves of the injection pattern at different injection angles and the distribution of gas and liquid phases in the nozzle when the injection rate of the corresponding angle is stable under the injection pressure of 35 MPa and injection back pressure of 0.5 MPa. As can be seen from the figure, in the stage of needle valve opening, that is, during the rapid rising period, the opening of the needle valve makes the injection rate spike rapidly with no impact from the concentric nozzle angle, while the variation trend of the injection rate stays mostly consistent. Conversely, during the transition period, as the nozzle angle increases, the transition period lengthens with a relatively low injection rate. And, when the nozzle angle is less than 65° during the stable period of the injection rate, the nozzle angle basically does not influence the injection rate. However, the steady injection rate drops with the further increase of the nozzle angle. According to the cavitation degree in the hole under different hole angles, an excessive hole angle will easily lead to the enhancement of jet flow and the aggravation of cavitation, thus reducing the liquid phase ratio in the cross-sectional area of the nozzle outlet. Furthermore, according to the mass flow formula, it can be deduced that the mass flow injection rate also decreases, and the injection pattern under different nozzle angles will be consistent as the needle valve is settling down in the seat. As the injection pressure varies, the variation trend of the nozzle angle on the injection rate remains unchanged, but the transition time and the variation gradient of the injection rate are different under different injection pressures.
To further quantify the relationship between the liquid phase ratio at the outlet of the inner hole and the injection rate during the stable period, Figure 5 shows how the liquid phase ratio at the outlet and the injection rate during the stable period change to the nozzle angle under different concentric nozzle angles. As can be seen from the figure, when the angle is small, the gradient of the injection rate and liquid phase ratio changing to the nozzle angle is also small, indicating a low sensitivity level for both. When the nozzle angle reaches 70°, the variation range of both the injection rate and the outlet liquid phase ratio spikes sharply, indicating the abrupt increase in the intensity of jet flow and local cavitation.
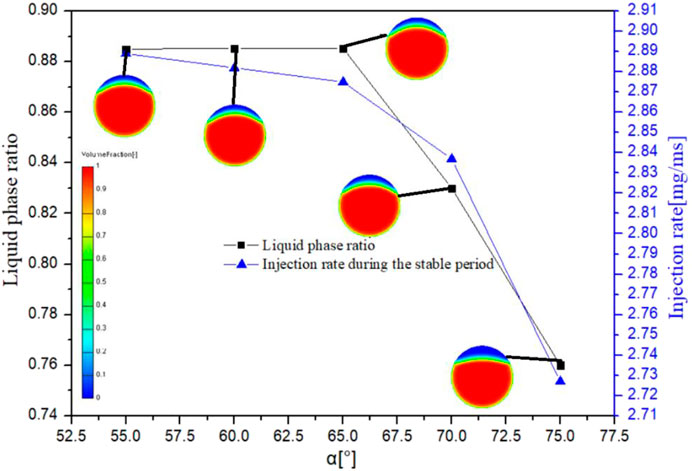
FIGURE 5. Influence of the concentric nozzle angle on the injection rate and distribution of gas and liquid phases at the nozzle outlet during the stable period.
4.2 Sensitivity Analysis of Injection Characteristics to Concentric Nozzle Angle
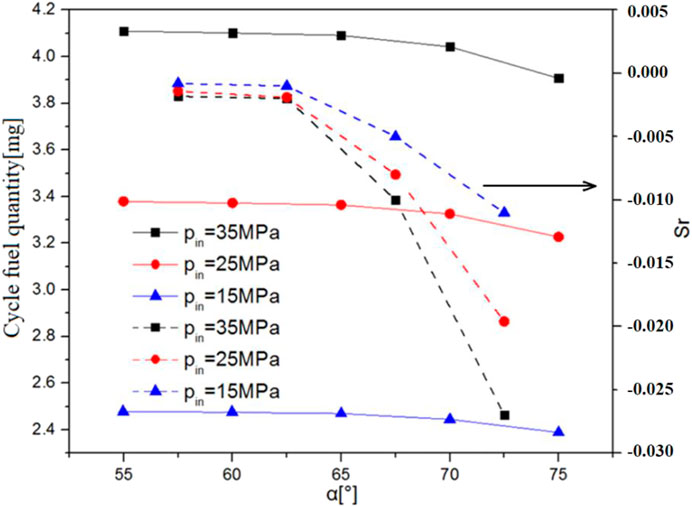
To identify the consistency of the injection characteristics of different nozzles in a multi-nozzle GDI injector under different nozzle angles, it is necessary to analyze the sensitivity of the circulating injection quantity to the nozzle angle. The sensitivity coefficient (Sr) indicates the influence of the current structural parameter value on the fuel injection characteristics. Figure 6 shows the pattern of single-nozzle circulating injection quantity and corresponding sensitivity coefficient changing with the increase of the nozzle angle under different injection pressures. As can be seen from the figure, with the increase of the angle, the single-nozzle circulating injection quantity decreases, but the gradient varies in different ranges of the change. Specifically, when the angle is large, the nozzle angle will have a greater influence on the difference in single-hole circulating injection quantity, but such impact is basically gone when the nozzle angle is small. The sensitivity of each section can be obtained through the sensitivity coefficient calculation formula. As can be seen from the results, with the increase of the injection pressure and nozzle angle, the sensitivity of single-nozzle injection characteristics to the concentric nozzle angle also increases. Within the range of the nozzle angle, the sensitivity is the strongest when the single-nozzle circulating injection quantity is between 70° and 75°. The machining accuracy of the nozzle angle is about ±1°. Therefore, within the allowable range of machining fluctuation, the injection pressure is 35 MPa, the injection back pressure is 0.5 MPa, the injection pulse width is 1.5 ms, and the fluctuation of single-hole circulating injection quantity is about 0.054 mg/cycle.
4.3 The Difference Pressure and Velocity Field of Inner-Nozzle Under Concentric Nozzle Angle
By analyzing the in-nozzle pressure and distribution of the gas-liquid phases, the influence mechanism of the concentric nozzle angle on the injection pattern and circulating injection quantity can be identified. Figure 7 is a representation of the pressure distribution field and the distribution field of in-hole gas-liquid phases under different concentric nozzle angles. As shown in the figure, with the increase of the hole angle, the negative pressure area on the upper wall of the nozzle hole and the cavitation intensity in the relative area increases accordingly. Therefore, the proportion of liquid phase in the outlet section of the hole sees a gradual decrease while the cross-sectional area for effective flow also drops. According to the flow calculation formula, it can be seen that the mass flow also goes down.
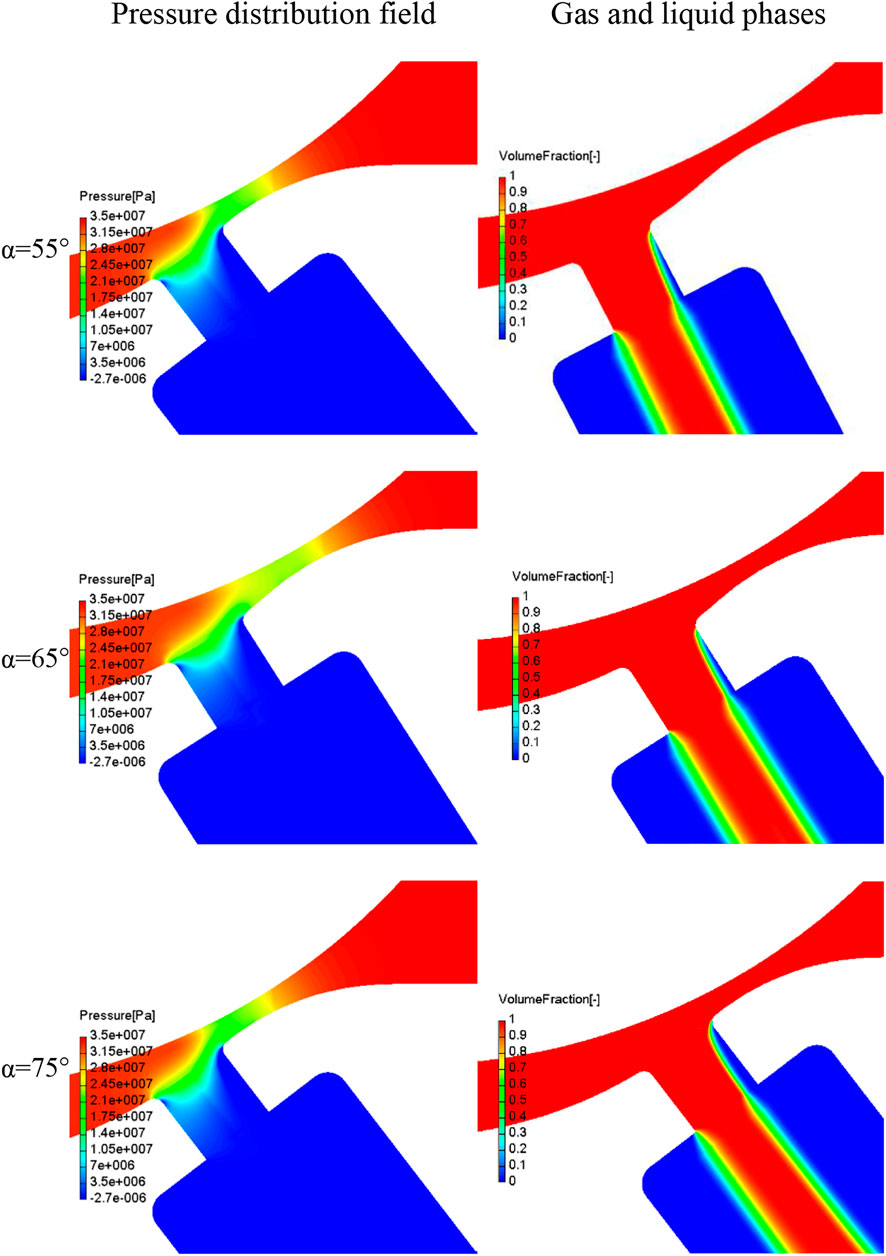
FIGURE 7. Pressure field and distribution field of gas-liquid phases under different concentric nozzle angles.
4.4 Influence of Nozzle-Axis Eccentricity on Injection Characteristic
During the machining of an injector, the positioning deviation of the nozzle axis will make the injector prone to eccentric nozzle angle, which will influence the injection characteristics. To clarify the degree of such an influence, the sensitivity degree of injection characteristics to eccentricity has been identified by analyzing the influence of different eccentricities on the injection pattern, circulating injection quantity, and cavitation in the nozzle, providing references for machining positioning.
4.4.1 Sensitivity Analysis of Injection Characteristics to Axis Eccentricity
According to the definition of eccentricity in the previous section of this article, the curves of the injection pattern have been obtained through modeling and simulation. Figure 8 shows the difference in the injection pattern curves under different eccentricities. To reduce modeling complexity and make the process more specific, the inlet chamfer angle of the eccentric nozzle angle was set at r = 0.00 mm. Specifically, Figure 8A shows the injection pattern under negative eccentricity (i.e., negative angle of the eccentric nozzles), from which it can see that the variation trend of the injection pattern is consistent with the trend of r = 0.00 mm, the inlet chamfer of nozzle mentioned earlier. As the negative eccentricity increases, the injection rate in the transition period and the stable period drops accordingly. This is because the angle between the nozzle axis and injector axis increases with the rise of negative eccentricity, and the acute angle of flow on the upper wall at the inlet of the nozzle decreases while the jet flow increases, under the prerequisite that the intersection point between the nozzle axis and the inlet center remains unchanged. Figure 8B shows the injection pattern under positive eccentricity (i.e., positive angle of the eccentric holes), it can see that as the positive eccentricity increases, the injection rate gradually rises during the stable period because the increases in the positive eccentricity would lead to the drop in the angle between the hole axis and the injector axis. Meanwhile, the obtuse angle of the upper wall of the hole inlet increases, while the intensity of the jet flow decreases, and the acute angle of the lower wall of the inlet also decreases, making it prone to cavitation and thus affecting the flow. However, due to the substantial difference in flow velocity between the upper and lower sides of the inlet, the lower wall has a limited effect on the increase of the flow rate.
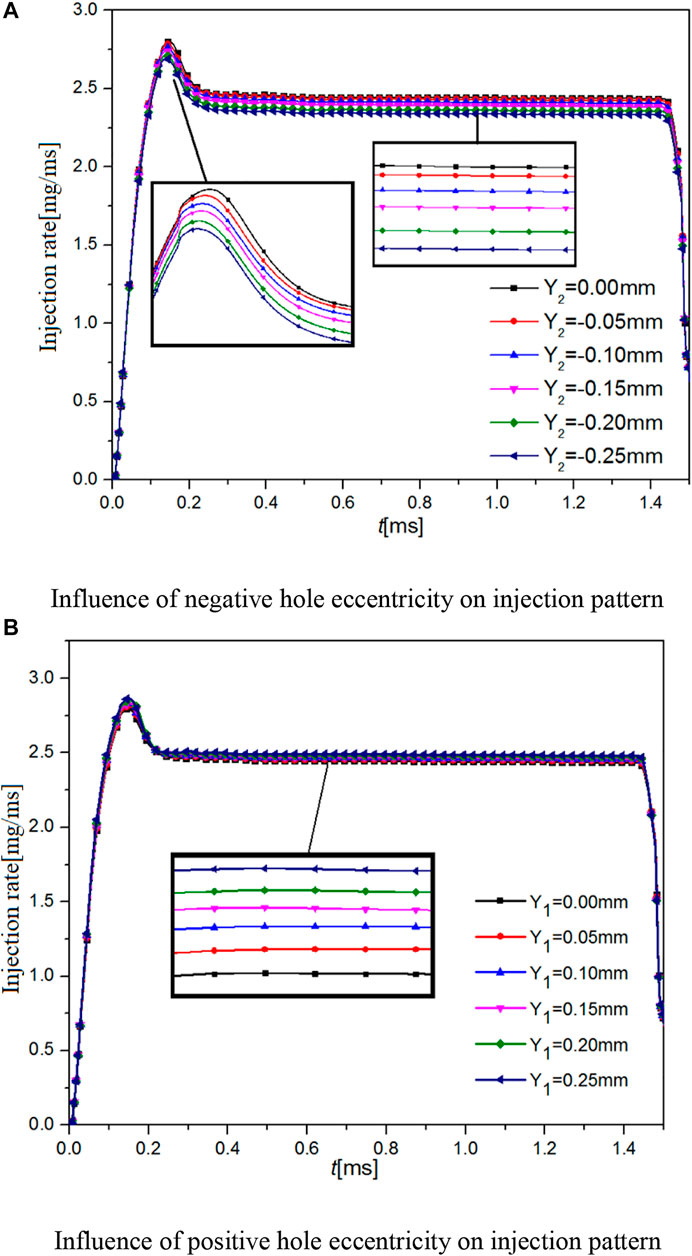
FIGURE 8. Influence of eccentricity on injection rate (pin = 35 MPa). (A) Influence of negative hole eccentricity on injection pattern. (B) Influence of positive hole eccentricity on injection pattern.
In the above text, the influence of eccentricity on injection patterns has been analyzed and the direction of the influence trend has been identified. To further clarify the degree of such influence, Figure 9 presents the injection rate, the circulating injection quantity, and the sensitivity coefficients in response to the eccentricity variation during the stable period. As can be seen, the injection rate and single-nozzle circulating injection quantity increase during the stable period with the increase of eccentricity, and the trends of the two better coincide with each other when the eccentricity is negative, while a certain level of deviation would occur as the eccentricity increases. From the curves of the sensitivity coefficient of circulating injection quantity to eccentricity, it could be seen that the influence degree of negative eccentricity is greater than that of positive eccentricity, in view of which it can be concluded that the deviation of negative eccentricity should be curtailed as much as possible to ensure the accuracy of positioning.
4.5 Influence of Eccentricity on Cavitation
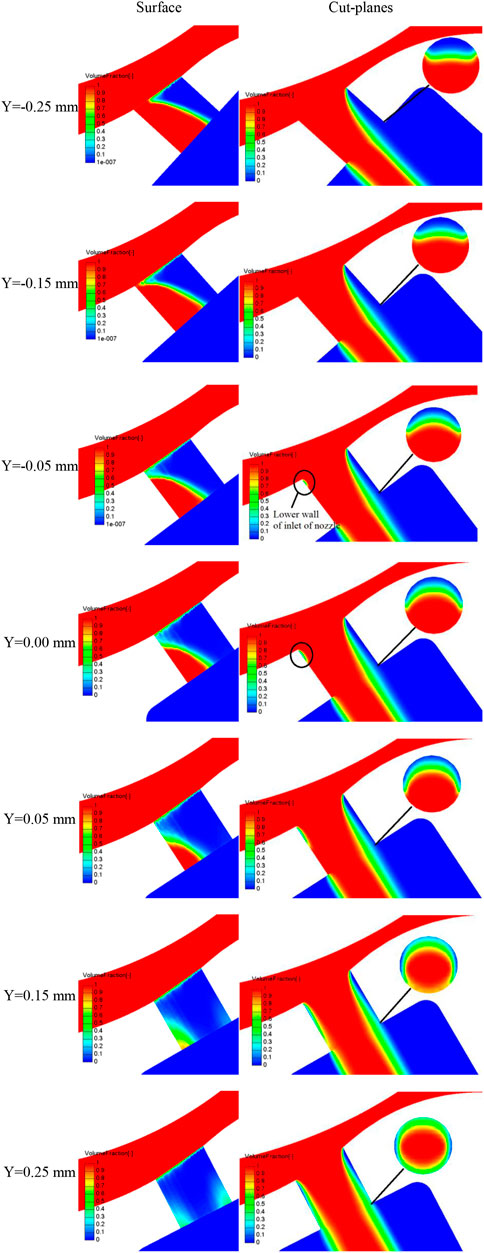
To clarify the influence of both positive and negative eccentricities on injection rate, circulating injection quantity, and internal flow area, Figure 10 shows the distribution of the gas-liquid phases in the nozzle hole under some eccentricities. Also, the distribution of the liquid phase has been analyzed by using the cavitation on the surface and cut-plane cross-section, so as to understand the influence of eccentricity on cavitation in the nozzle. As can be seen from the change of surface cavitation to eccentricity, the image of surface cavitation when R = 0.00 mm and Y = 0.00 mm will still have some areas covered by the liquid phase on the lower inner wall of the nozzle near the outlet. Compared with the cut-planes of the same dimension, a smaller gas phase has appeared on the lower wall of the inlet of the nozzle, indicating that cavitation has developed at the time in this area, and the proportion of liquid phase in the outlet section of the nozzle is 0.7441. As the negative eccentricity increases, the cavitation area on the surface decreases gradually, and judging from the proportion of liquid phase on the cut-plane, the cavitation on the lower wall of the nozzle inlet starts disappearing gradually. However, the cavitation on the upper wall of the nozzle increases, and when Y = -0.25 mm, the liquid phase ratio at the outlet of the nozzle decreases to 0.7122, with the cross-sectional area of effective flow decreased. As the positive eccentricity increases, the cavitation area expands gradually, and when Y = 0.15 mm, fuel vapor materializes on the wall of the nozzle. Also, the proportion of gas-phase increases with the rise in the value of Y. From the cut-planes under corresponding parameters, it can be seen that the cavitation on the lower wall of the hole keeps increasing, and when Y = 0.25 mm, the proportion of liquid phase in the outlet section of the nozzle is 0.7534, indicating the increase in the cross-sectional area of effective flow.
5. Conclusion
In view of the machining consistency of injector nozzle holes and machining deviation of the nozzle axis, this article has investigated the sensitivity of gas-liquid flow in the nozzle hole, as well as the circulating injection quantity to the nozzle angle and the deviation of the nozzle axis, and drawn the following conclusions:
1) When the concentric nozzle angle exceeds 65° and increases further, it will lead to a gradual decrease in the injection rate during the steady period. When the hole angle is larger (α ≥ 65°), the degree of cavitation in the hole and the sensitivity of the injection rate to the angle will continue to rise.
2) As the injection pressure and nozzle angle increase, the sensitivity of single-hole injection characteristics to the angle between the concentric nozzle holes is enhanced, and the sensitivity of single-hole circulating injection quantity gets to the strongest level between 70°–75°. As the angle enlarges, the negative pressure area on the upper wall of the nozzle enlarges, and the intensity of cavitation in the corresponding area also increases.
3) With the increase of the negative eccentricity, the injection rates in both the transition period and the stable period decrease correspondingly. As the positive eccentricity rises, the injection rate in the stable period gradually increases. From the sensitivity coefficient curve of circulating injection quantity to eccentricity, it can be seen that the influence degree of negative eccentricity is greater than that of positive eccentricity. Therefore, during machining and positioning, it is worth trying to reduce the deviation of the negative eccentricity to ensure positioning accuracy.
4) When Y = -0.25 mm, the liquid phase proportion at the outlet of the inner nozzle decreases to 0.7122, and the effective flow cross-sectional area decreases. With the increase of positive eccentricity, the cavitation area on the surface gradually becomes larger. When Y = 0.15 mm, fuel vapor basically appears on the inner nozzle wall, and the gas phase proportion increases with the increase of the Y value. At this time, the sensitivity of circulating fuel injection quantity to eccentricity is the lowest.
Data Availability Statement
The raw data supporting the conclusions of this article will be made available by the authors, without undue reservation.
Author Contributions
XL: Make the simulation and write the manuscript XS: Collect the data LW: Typesetting and data sorting YC: Guiding research ideas.
Conflict of Interest
The authors declare that the research was conducted in the absence of any commercial or financial relationships that could be construed as a potential conflict of interest.
Publisher’s Note
All claims expressed in this article are solely those of the authors and do not necessarily represent those of their affiliated organizations, or those of the publisher, the editors, and the reviewers. Any product that may be evaluated in this article, or claim that may be made by its manufacturer, is not guaranteed or endorsed by the publisher.
References
Dong, P., Nishida, K., and Ogata, Y. (2016). Characterization of Multi-Hole Nozzle Sprays and Internal Flow for Different Nozzle Hole Lengths in Direct-Injection Diesel Engines. Proc. IMechE Part D. J. Automob. Eng. 231, 500–515. doi:10.1177/0954407016653890
Duan, X., Lai, M.-C., Jansons, M., Guo, G., and Liu, J. (2021). A Review of Controlling Strategies of the Ignition Timing and Combustion Phase in Homogeneous Charge Compression Ignition (HCCI) Engine. Fuel 285, 119142. doi:10.1016/j.fuel.2020.119142
Jun, Z., Qing, D., Yan, X. Y., and Jian, S. (2010). Study on Cavitating Flow in Different Types of Diesel Nozzle Orifice. Trans. Csice 28 (2), 133–140.
Li, X., Cheng, Y., Ji, S., and Yang, X. (2019). Sensitivity Analysis of Fuel Injection Characteristics of GDI Injector to Injector Nozzle Diameter. Energies 12 (3), 434. doi:10.3390/en12030434
Li, X., Cheng, Y., Ma, X., and Yang, X. (2018). A Correction Method of Hole-To-Hole Variation Mass Flow of Diesel Injector Equipped on a Common-Rail DI Diesel Engine. Eur. Phys. J. Appl. Phys. 83 (3), 30902. doi:10.1051/epjap/2018180155
Park, J., and Park, S. (2022). Spray Development Process Utilizing a Multi-Hole GDI Injector with Different Spray Hole Lengths and Step Hole Diameters. Int. J. Automot. Technol. 23, 641–649. doi:10.1007/s12239-022-0058-2
Qiu, T., Song, X., Lei, Y., Liu, X., An, X., and Lai, M. (2016). Influence of Inlet Pressure on Cavitation Flow in Diesel Nozzle. Appl. Therm. Eng. 109, 364–372. doi:10.1016/j.applthermaleng.2016.08.046
Salvador, F. J., Lopez, J. J., Morena, J. D. L., and Crialesi-Esposito, M. (2018). Experimental Investigation of the Effect of Orifices Inclination Angle in Multihole Diesel Injector Nozzles. Part 1 – Hydraulic Performance. Fuel 213, 207–214. doi:10.1016/j.fuel.2017.04.019
Salvador, F. J., Romero, J.-V., Roselló, M.-D., and Martínez-Lópeza, J. (2010). Validation of a Code for Modeling Cavitation Phenomena in Diesel Injector Nozzles. Math. Comput. Model. 52, 1123–1132. doi:10.1016/j.mcm.2010.02.027
Sato, Y., Sadatomi, M., and Sekoguchi, K. (1981). Momentum and Heat Transfer in Two-phase Bubble Flow-I. Theory. Int. J. Multiph. Flow 7, 167–177. doi:10.1016/0301-9322(81)90003-3
Sato, Y., and Sekoguchi, K. (1975). Liquid Velocity Distribution in Two-phase Bubble Flow. Int. J. Multiph. Flow 2, 79–95. doi:10.1016/0301-9322(75)90030-0
Sforzo, B. A., Tekawade, A., Kastengren, A. L., Fezzaa, K., Ilavsky, J., Powell, C. F., et al. (2022). X-Ray Characterization of Real Fuel Sprays for Gasoline Direct Injection. J. Energy Resour. Technol. 144 (2), 10. doi:10.1115/1.4050979
Som, S., Ramirez, A. I., Longman, D. E., and Aggarwal, S. K. (2011). Effect of Nozzle Orifice Geometry on Spray, Combustion, and Emission Characteristics under Diesel Engine Conditions. Fuel 90, 1267–1276. doi:10.1016/j.fuel.2010.10.048
von Kuensberg Sarre, C., Kong, S., and Reitz, R. D. (1999), Modelling the Effects of Injector Nozzle Geometry on Diesel Sprays. SAE Tech. Pap. 1999-01-01, 1999. 16 doi:10.4271/1999-01-0912
Wu, S., Xu, M., Hung, D. L. S., Li, T., and Pan, H. (2016). Near-nozzle Spray and Spray Collapse Characteristics of Spark-Ignition Direct-Injection Fuel Injectors under Sub-cooled and Superheated Conditions. Fuel 183, 322–334. doi:10.1016/j.fuel.2016.06.080
Xie, M. Z., and Jia, M. (2016). Computational Combustion of Internal Combustion Engines. Beijing, China, 147–152.
Yao, C., Geng, P., Yin, Z., Hu, J., Chen, D., and Ju, Y. (2016). Impacts of Nozzle Geometry on Spray Combustion of High Pressure Common Rail Injectors in a Constant Volume Combustion Chamber. Fuel 179, 235–245. doi:10.1016/j.fuel.2016.03.097
Keywords: GDI injector, nozzle hole angle, cavitation, sensitivity analysis, gas-liquid (two phase) transient flow
Citation: Li X, Shang X, Wang L and Cheng Y (2022) Sensitivity of Injection Characteristics to the Nozzle Hole Angle of a GDI Injector: A CFD Analysis. Front. Energy Res. 10:932389. doi: 10.3389/fenrg.2022.932389
Received: 29 April 2022; Accepted: 15 June 2022;
Published: 22 July 2022.
Edited by:
Xiaoke Ku, Zhejiang University, ChinaReviewed by:
Xiongbo Duan, Hunan University, ChinaBiplab Kumar Debnath, National Institute of Technology Meghalaya, India
Copyright © 2022 Li, Shang, Wang and Cheng. This is an open-access article distributed under the terms of the Creative Commons Attribution License (CC BY). The use, distribution or reproduction in other forums is permitted, provided the original author(s) and the copyright owner(s) are credited and that the original publication in this journal is cited, in accordance with accepted academic practice. No use, distribution or reproduction is permitted which does not comply with these terms.
*Correspondence: Xinhai Li, eGluaGFpbG92ZTlAMTI2LmNvbQ==
 Xinhai Li
 Xianshang Shang1
