 Zhenhua Wang
 Jirui Hou1,2*
- 1Enhanced Oil Recovery Institute, China University of Petroleum, Beijing, China
- 2Basic Theory Laboratory of Improving Oil Recovery in Low Permeability Oilfields, Tertiary Oil Recovery Key Laboratory, CNPC, Beijing, China
- 3School of Petroleum Engineering, Changzhou University, Changzhou, China
CO2 flooding and burial efficiency can be improved by establishing a standard for screening suitable CO2 flooding reservoirs for the Daqing Oilfield. Moreover, the influencing factors of CO2 flooding can be classified into geological factors, fluid properties, and development factors. An evaluation index system and hierarchical structure are created based on the importance of multiple factors. The subjective analysis error of human beings is quite large when establishing the evaluation index system, especially in the fitting curves that are drawn by different analysts. Based on the geological characteristics of block Bei14 in the Daqing Oilfield, a typical CMG model is presented in this article. A total of 15 factors in the 72 models are used as independent variables, and the recovery factor is used as a dependent variable for multiple linear regression calculations. In addition to sensitivity tests based on how much significance is indicated by the t value in the results, a unique result can be calculated using standard statistical methods when analyzing the calculation results of the multiple linear regression model. The results of the screening standard evaluation system are consistent with the production history of the oilfield based on the mathematical understanding of multiple factors of CO2 flooding. Around the high-score well group, oil saturation decreases significantly, and the cumulative production is generally higher than that of the low-score well group. The calculation results of block Bei 14 show that 74% of well groups have an evaluation value greater than 0.50, and 72% of well groups have an annual oil exchange ratio above 40%, which means that over 70% of well groups can benefit from CO2 flooding. Thus, CO2 flooding can be applied in the Daqing Oilfield, and multiple linear regression can provide effective guidance for the Daqing Oilfield’s development.
1 Introduction
In the past few decades, greenhouse gas emissions have become increasingly serious, and a solution to the carbon dioxide problem is imminent with the use of fossil fuels (Zandalinas et al., 2021). Many countries and regions have proposed policies to address carbon emissions, including initiatives such as gasoline taxes, new energy sources, and emission subsidies (Finke et al., 2021). China still faces the challenge of reaching peak total CO2 emissions by 2030 and achieving 21 carbon neutrality by 2060 (Liu et al., 2021). China has also proposed solutions for its own energy structure, including green energy saving and emission reduction, carbon capture, carbon burial, and other technological innovation directions (Li, 2021). Low-permeability and extra-low-permeability reservoirs make up a large proportion of the reservoirs in China, so water-driven mining is easy to encounter the situation of not being able to inject and recover oil, and the recovery rate of water-driven mining is generally low compared with that of CO2-driven technology (Li et al., 2021; Yu et al., 2021). CO2 flooding technology can improve recovery while storing greenhouse gases in the ground, responding to today’s carbon neutrality policy (Jiang and Ashworth, 2021; Xu et al., 2021). However, in CO2 flooding, the effect of formation development is not understood, which leads to the lack of obvious effects of CO2 flooding to improve recovery. Moreover, the influence of temperature, formation inclination, development method, and other factors on the effect of CO2 flooding is not fully recognized (Feng et al., 2016; Xiaolong et al., 2021). For this reason, it is necessary to evaluate CO2 flooding blocks and establish a complete selection index to provide a basis for the gas injection and extraction plan (DaneshFar et al., 2021; Angarita et al., 2022).
The change in recovery is frequently affected by various essential aspects in the research of practical problems, such as effective temperature, viscosity, and permeability. For example, oil reservoirs extracted at high temperatures can result in lower crude oil viscosity, which leads to less resistance of the subsurface fluid when driven by CO2, and under the condition of low permeability, CO2 is easily retained in the rock micropore throat, resulting in a poor CO2 oil production effect (Zhou et al., 2019; Pu et al., 2022). At this point, two or more factors must be used as independent variables to explain the change in recovery. Nevertheless, the error of subjective analysis is relatively large when determining the impact of multiple factors on recovery (Mellor, 1965; Colclough, 1987). This is because while analyzing the experimental results of multi-factor CO2 flooding-enhanced recovery, some individuals will focus on temperature, while others will focus on permeability, demonstrating that various people have different perspectives on experimental data. With the multiple linear regression method, this problem can be effectively solved as long as the data and model are identical, and a unique result can be calculated by using standard statistical methods (Etemadi and Khashei, 2021; Maaouane et al., 2021; Piekutowska et al., 2021). In order to establish the screening standard of CO2 flooding reservoirs in the Daqing Oilfield more scientifically, after using the multiple linear regression method to judge the sensitivity, according to the influence of various factors on oil recovery, it is divided into multi-factor categories, and the effect indicators of CO2 flooding are divided into three categories: geological factors, fluid properties, and development indicators. According to the importance of sorting, the evaluation index system is established, and the hierarchical structure is constructed. The screening standard of CO2 flooding reservoirs in low-permeability reservoirs in the Daqing Oilfield is established (Chai et al., 2021; Pokoradi et al., 2021; Sun, 2021). When calculating the evaluation value of enhanced oil recovery by CO2 flooding, because the reservoir data are complex and the units of different factors are different, the geological data of the field should be normalized (Gao et al., 2021; Moreira et al., 2021). According to the normalized data, the reservoir suitability evaluation of CO2 flooding is calculated. This method can be used in all blocks of the whole Daqing Oilfield, and the evaluation value of all blocks will be calculated (Bhatti et al., 2019; Foukerdi et al., 2021; Zheng et al., 2022).
This article mainly focuses on the multi-factor experiment of CO2 miscible flooding numerical simulation in ultra-low-permeability reservoirs on the basis of calculation results, typical model design of reservoir engineering numerical simulation, and the multi-factor screening criteria. With the sensitivity of experimental results by the multiple linear regression method, screening criteria are established by the analytic hierarchy process (AHP), and the CO2 gas drive well groups in ultra-low-permeability reservoirs of the Daqing Oilfield are evaluated and divided. The purpose is to establish a screening index and provide technical support for field test demonstration zones for enhanced oil recovery in the Daqing Oilfield (Yu et al., 2021; Zhou, 2021). The novelty of this study is to apply the regression equation to the gas injection evaluation of ultra-low-permeability reservoirs. While calculating the suitability of well groups for CO2 flooding, it can provide suggestions on readjusting for the gas injection wells with various evaluation values.
2 CO2 Flooding Sensitivity Evaluation Modeling
2.1 Model Building
The Bei14 block, with an area of about 4.5 km2, is located in the western Sudeerte tectonic belt of the Hailar Basin. The main oil-bearing reservoirs are fan delta front subfacies with formation temperatures ranging from 45.7 to 72.0°C and burial depths ranging from 1775 to 1820 m. This block’s rock types are mostly tuffaceous sandstone with a few conglomerates that mostly exist in the form of a bottom conglomerate.
As formation water in the Xinganling formation in the Bei14 block is not well developed, the CMG-GEM simulator was used to create a typical reservoir model without marginal bottom water (Figure 1). The typical model has a crude oil density of 0.8389 g/cm3 under surface conditions and an average rock compression coefficient of 13.74 × 10⁴ MPa−1 and uses typical oil–water and oil–gas relative permeability curves for low-permeability reservoirs (Figure 2). Based on well testing and production data, the model reservoir temperature is set as 65 °C, the original formation pressure is set as 17.60 MPa, and the average oil saturation is set as 44%. According to the porosity and permeability distribution of different well test depths in the Bei14 block, the average porosity of the model is set to 13%, and the average permeability is set to 1.2 mD (Table1). The typical model is divided vertically into 26 small layers, each with a thickness of 1 m and a uniform thickness in the plane. An orthogonal grid system is used to construct the typical model, which has a size of 410 m × 350 m × 15 m, grids of 41 × 35 × 26 = 37,310, a depth of 1815 m in the center, a height of 1830 m at the oil–water interface, a dip angle of 0° for the formation, and a geological reserve of 25.69 × 10⁴ t. INJ-1, the gas injection well, is located in the models center, and the production mode of the production well is consistent with that of the oilfield site. Eight production wells are distributed by the nine-point method, and the well spacing is set to 300 m.

FIGURE 1. Permeability model.
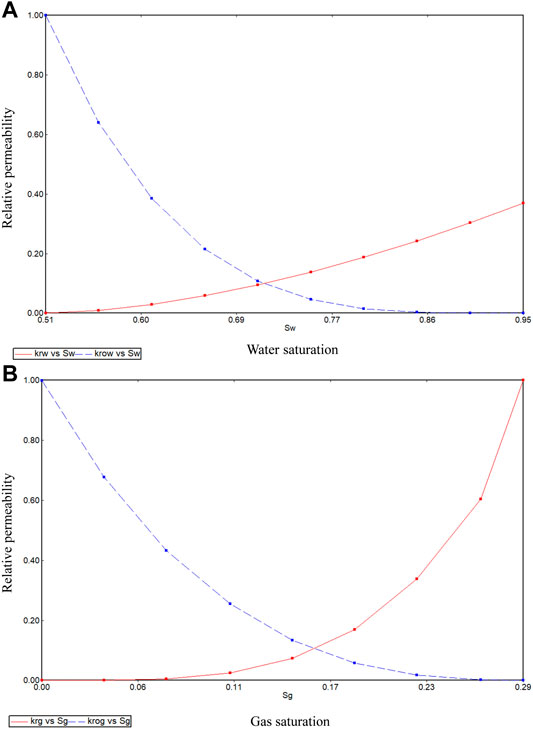
FIGURE 2. (A) Oil–water relative permeability; (B) oil–gas relative permeability.

TABLE 1. Modeled permeability and porosity.
2.2 Phase Matching
In order to improve the prediction accuracy of oil reservoir fluid properties, well fluid components are combined into seven components according to the principle of similar component properties without affecting the simulation results. CMG-Winprop software is used to fit the relative volumes, oil density, and oil viscosity at different pressures by adjusting more than 10 component critical state parameters of each component (Figure 3). Repeated trial calculations of the constant component expansion experimental data with high accuracy, within 5% of the fitting accuracy, are performed. The results of the component fitting show ‘CO2’ for 0, ‘C1′ for 0.086144, ‘C2+’ for 0.054421, ‘C4+’ for 0.030105, ‘C6+’ for 0.22996, ‘C9+’ for 0.28357, and ‘C11+’ for 0.3158.
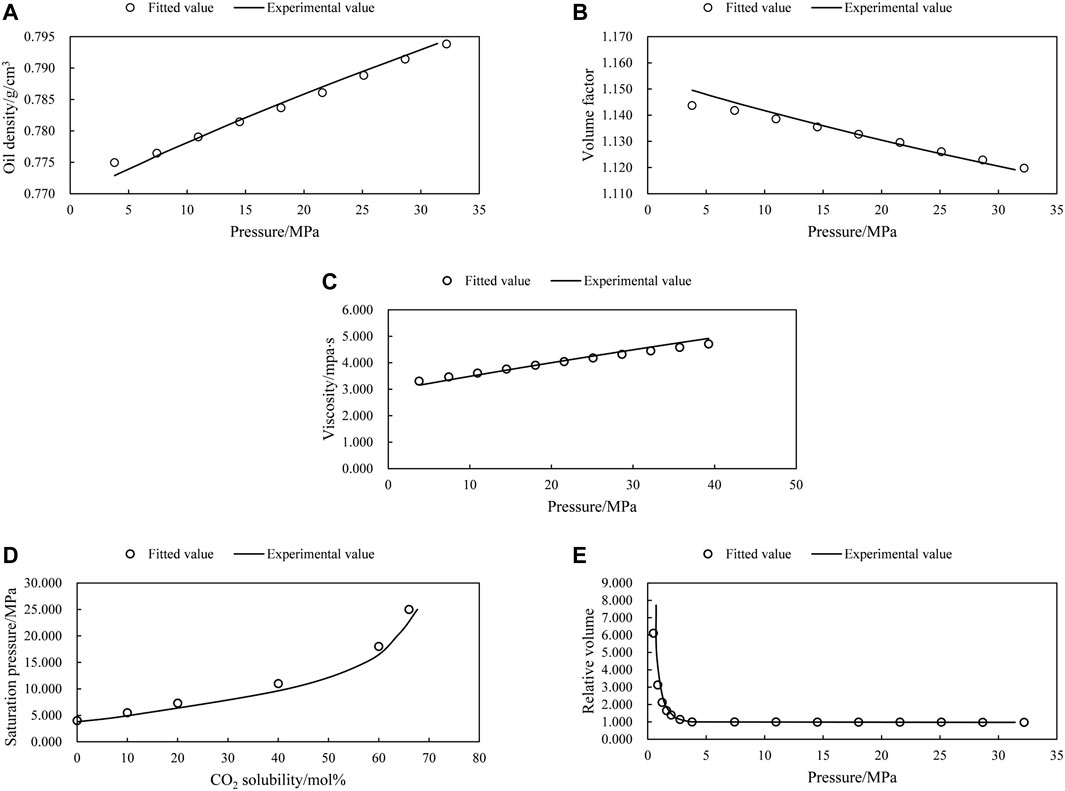
FIGURE 3. (A) Oil density fitting; (B) volume factor fitting; (C) viscosity fitting; (D) saturation pressure fitting; (E) relative volume fitting.
After setting the corresponding components in the initial typical model, the resultant operations can be performed. When the production gas–oil ratio reaches 1000 m3/m3, the cumulative production is 4.705 × 10⁴ t, which corresponds to an oil recovery rate of 18.32%.
2.3 Dynamic Model
A total of 72 reservoir models are designed to determine CO2 flooding screening criteria for the Daqing Oilfield based on 17 factors, including formation pressure (5–20 MPa), formation temperature (35–45°C), effective thickness (6–56 m), average permeability (0.1–50 mD), and well spacing (100–500 m) (Table2).
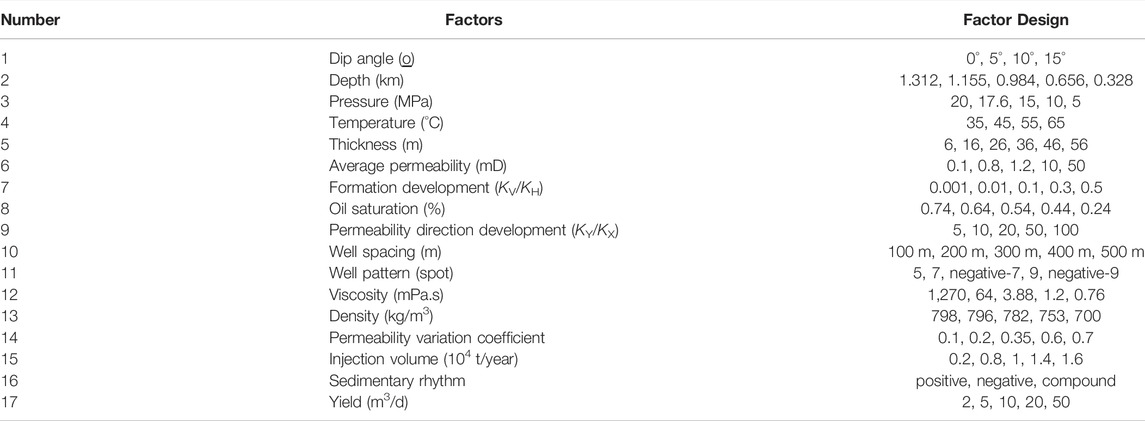
TABLE 2. Model factor design.
3 Sensitivity Analysis
3.1 Model Calculation Results
In terms of the calculation results of 72 models, it is known that in the geological factors, oil saturation and thickness of the oil reservoir have the most obvious influence on the enhanced oil in place. A thicker effective thickness and a steeper dip angle are detrimental to the recovery rate, but the effect of oil saturation on the recovery rate is the opposite with the recovery rate increasing from 19.40 to 32.68% with an increase from 44 to 74%. The recovery of the heterogeneity model is significantly lower when there is CO2 flooding in the layer due to the vertical heterogeneity of multilayer reservoirs, which results in notable interlayer interference. Since increases in temperature and pressure lead to lower crude oil viscosity and increased CO2 solubility in crude oil, it is easier to induce a miscible phase and thus increase the recovery rate. An inflection point occurs in the oil recovery ratio at around 1.2 mD, which is due to the theory that high gas flow rates at high permeability lead to high recovery rates that are not suitable for CO2 flooding processes; when the permeability is too large, the CO2 breakthrough time is too early and the contact time with oil is too short, all of which prevent gas flooding from making full use of its advantages (Figures 4A–J). In the fluid properties, viscosity and density of the oil play a similar role in enhanced oil recovery of CO2 flooding because the decrease of oil viscosity and density leads to the decrease of seepage resistance of CO2 flooding and the increase of oil displacement efficiency (Figures 4M,N. In the development index, the inverse 9-point well pattern has higher cumulative oil production and a higher burial rate than the 5-point well pattern and inverse 7-point well pattern; a smaller distance between wells leads to the larger driving area of CO2 flooding. In the process of gas flooding, CO2 tends to advance rapidly along the upper part of the reservoir, the negative rhyme accelerates the trend with the worst recovery effect, and the positive rhyme slows down the trend with the best recovery effect, while in the compound rhyme, the superposition of the two rhymes has the middle effect on the recovery improvement (Figures 4K, 5). Due to the higher sweeping volume, greater gas injection facilitates better oil displacement performance, which is advantageous for the daily oil production of well groups (Figures 4L,O).
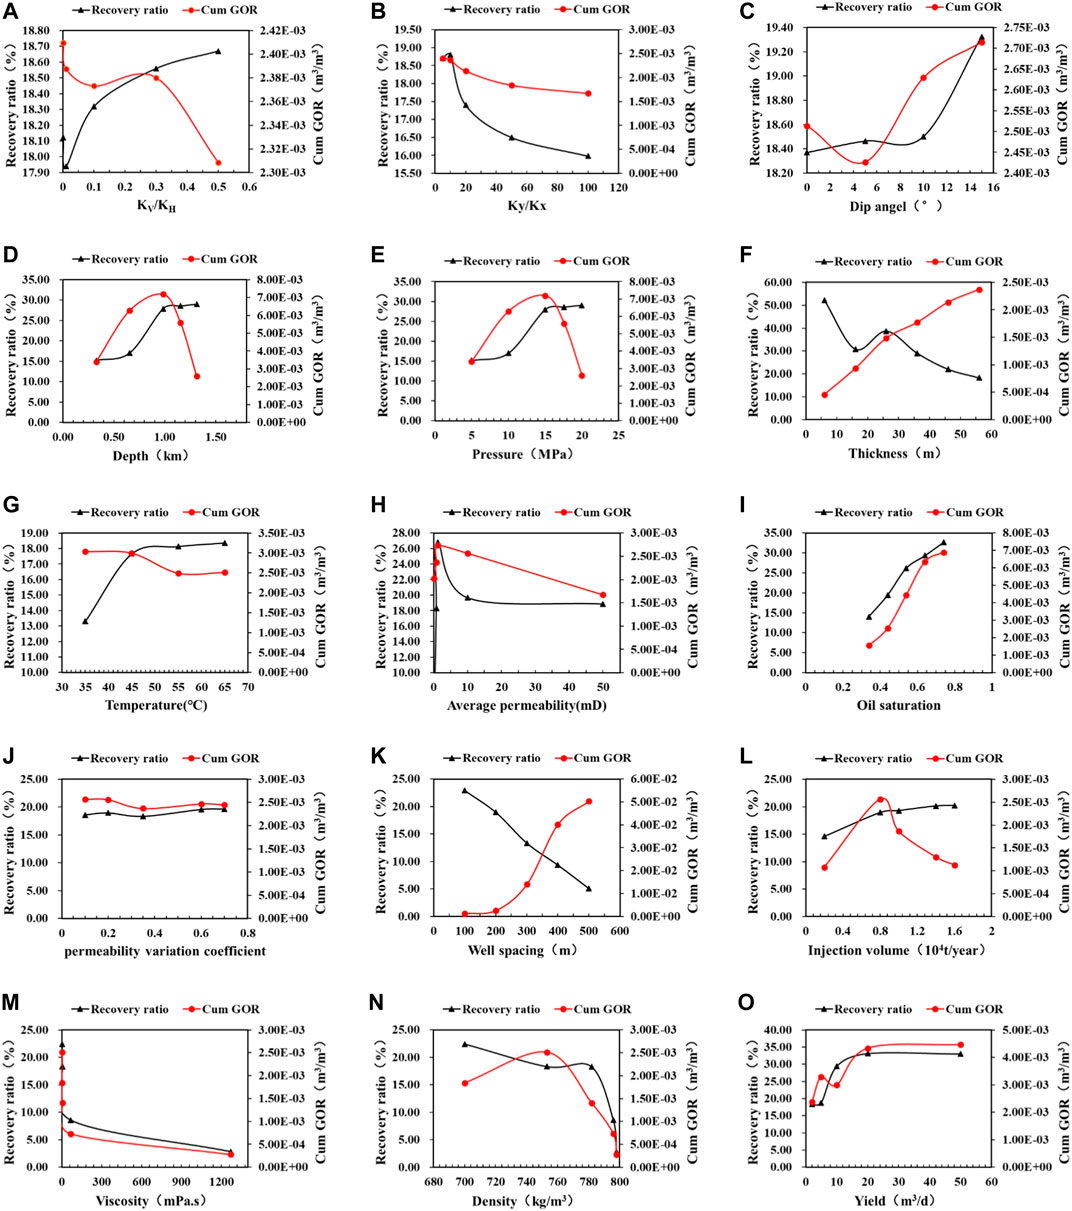
FIGURE 4. (A) Effect of KV/KH; (B) effect of Ky/Kx; (C) effect of dip angle; (D) effect of depth; (E) effect of pressure; (F) effect of thickness; (G) effect of temperature; (H) effect of average permeability; (I) effect of oil saturation; (J) effect of permeability variation coefficient; (K) effect of well spacing; (L) effect of injection volume; (M) effect of viscosity; (N) effect of density; (O) effect of yield on oil recovery ratio and cumulative gas–oil ratio.
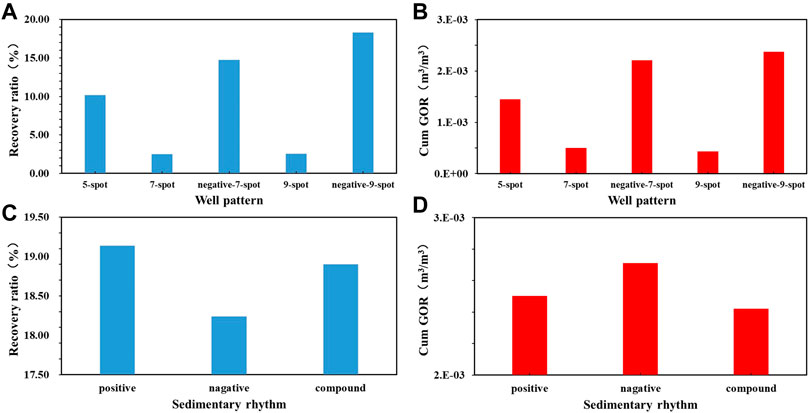
FIGURE 5. (A) Effect of well pattern on recovery ratio; (B) effect of well pattern on cumulative gas–oil ratio; (C) effect of sedimentary rhythm on recovery ratio; (D) effect of sedimentary rhythm on cumulative gas–oil ratio.
Based on the data obtained in the factor sensitivity analysis, multiple linear regression is performed by integrating pressure and depth as one-factor consideration, viscosity and density as one-factor consideration, and 15 factors from the 72 models as independent variables with recovery rate as the dependent variable. The reason for combining some of them into one variable, such as pressure and depth, and viscosity and density, in this article is the extreme similarity of their effects on recovery, in order to avoid the multi-collinearity that arises in regression analysis (Gunst and Webster, 1975; Montgomery and Voth, 1994). Let
In Eq. 1,
Equation 2 is a matrix solution equation, where it is possible to solve for the value of
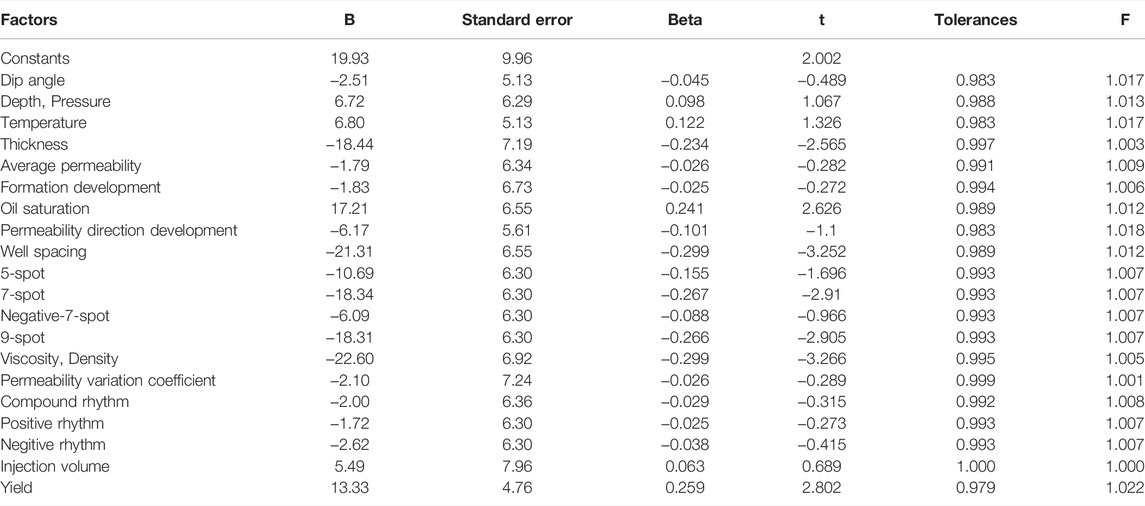
TABLE 3. Multiple linear regression table for CO2 flooding in the Daqing low-permeability reservoir.
In Eqs. 3 and 4,
In Eq. 5,
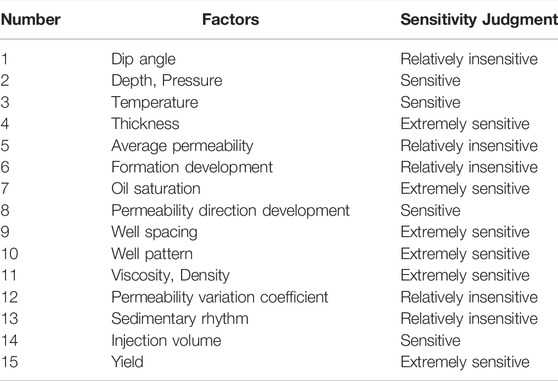
TABLE 4. Sensitivity judgment.
3.2 CO2 Flooding Reservoir Suitability Ranking in the Daqing Oilfield
All the indicators affecting the effect of CO2 flooding are divided into three categories: geological factors, fluid properties, and development indicators. According to the importance of the ranking, the evaluation index system is established, and the hierarchical structure is constructed. Using the principle of hierarchical analysis, the calculation can be derived from the weights of indicators at all levels as shown in Table 5. The better indicators in the given reservoir geological data are the effective thickness of the oil layer, depth pressure of the oil layer, average permeability of the reservoir, oil saturation, single-well injection of CO2, and single-well production of recovery wells. Therefore, the indicator weights need to be proportionally assigned to these six indicators, and the final weights of each indicator after the assignment are shown in Table 6.
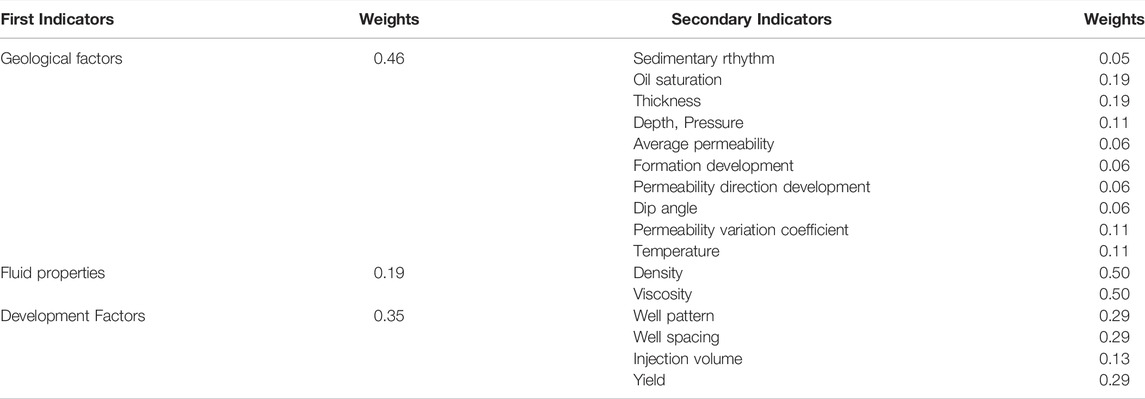
TABLE 5. CO2-driven reservoir screening index weighting values for the Daqing Oilfield.
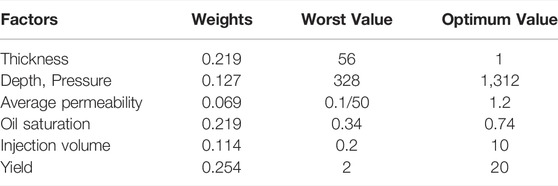
TABLE 6. CO2-driven reservoir screening index weighting values and best values/worst values used for reservoir index normalization in the Daqing Oilfield.
The reservoir geological data are normalized, assuming that there are
In Eq. 1, the optimal value
In Eq. 2,
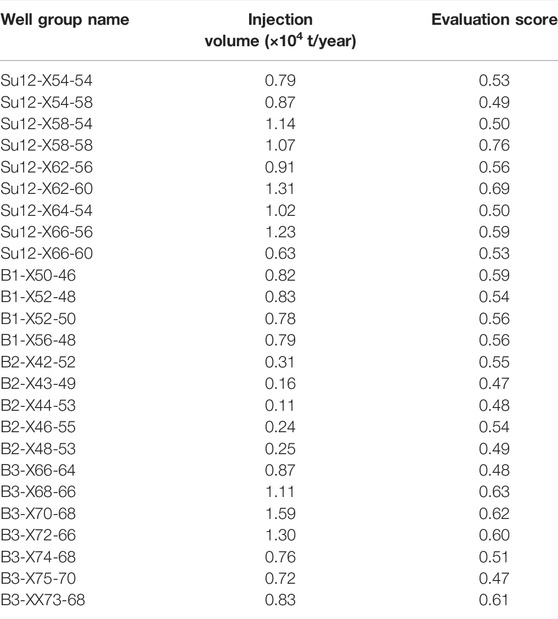
TABLE 7. CO2 flooding scoring for low-permeability reservoirs in the Daqing Oilfield.
3.3 Production Effect Evaluation of the Daqing Oilfield
In order to facilitate fine management in the production process of the Daqing Oilfield, block Bei14 of the Daqing Oilfield is divided into four sub-blocks, and the formation pressure of four sub-blocks can reach the minimum miscibility pressure of 16.6 MPa. Block SU12 has accumulated gas injection for about 10 years since February 2022, and blocks B1, B2, and B3 have accumulated gas injection for about 6 years since October 2016. The maximum reservoir capacity of block SU12 is 330 × 104 t, followed by block B3 is 292 × 104 t, and the reservoir capacity of blocks B1 and B2 is about 150 × 104 t. Statistics of the annual production of major well groups in the Bei14 block in Table 8 shows that the average annual gas injection volume is 0.81 × 10⁴ t, the average annual oil production volume is 0.30 × 10⁴ t, the average annual oil change rate of well groups is about 41%, and the reservoir development effect is splendid.
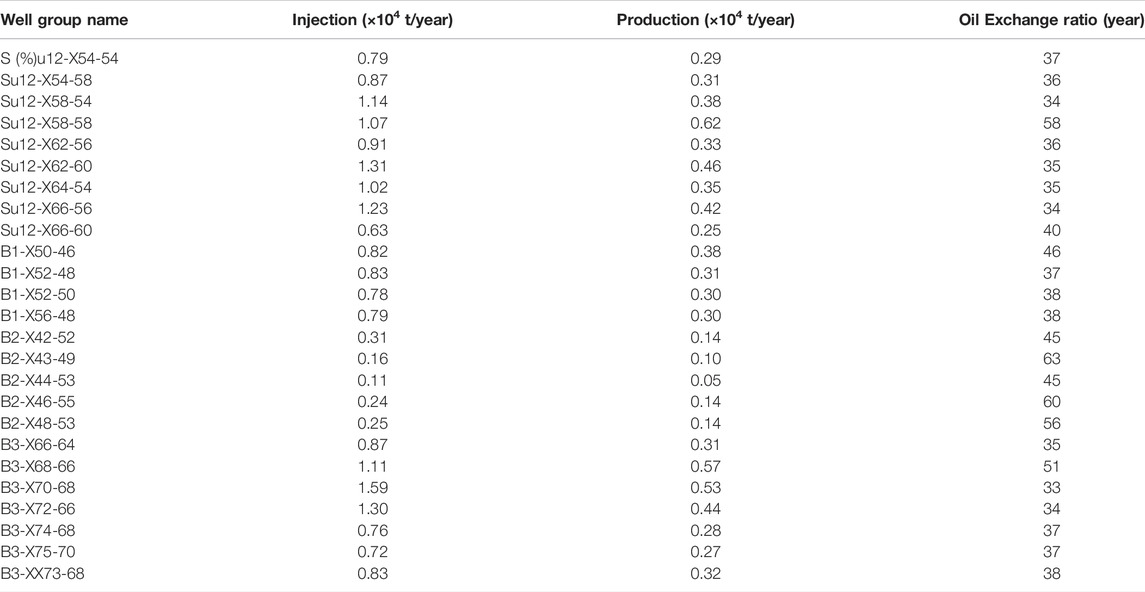
TABLE 8. Daqing Oilfield well group production data.
According to the historical production data of the Bei14 block in the Daqing Oilfield, it can be seen that in the development process of the SU12 block, taking the oil saturation of the 16th simulated layer of SU12 as an example, the development spread area is mainly in the middle part of the oil group, and the spread range of the second half is large. Among them, the central part of the field is centered on the X58-58 well group with 0.62 × 10⁴ t/year and bordered by the surrounding well groups with 0.30 × 10⁴ t/year, forming a CO2 flooding belt through the SU12 block. Taking the oil saturation of the 20th simulation layer in the B1 block as an example, the development-affected area is mainly in the middle of the oil group, and the edge angle affected is less. The development effect of the X56-48 well group and X50-46 well group is the best with the production of 0.30 × 10⁴ t/year and 0.38 × 10⁴ t/year, respectively; the oil saturation is centered on the gas injection well and decreases in the surrounding area (Figure 6). Taking the oil saturation of the 23rd simulation layer in the B2 block as an example, the development-affected area is mainly in the middle of the oil group, and the edge angle affected is less. The oil saturation around the X42-52 well group decreases most obviously with the production of 0.14 × 10⁴ t/year. Taking the oil saturation of the 17th simulated layer in Block B3 as an example, the development area is mainly in the upper half of the oil group, and the lower half is less affected. The oilfield development is mainly centered on the X68-66 well group, X66-64 well group, and X70-68 well group with the production of about 0.50 × 10⁴ t/year (Figure 7). In the multiple linear regression screening evaluation system of the Daqing Oilfield, the corresponding high-score well groups are 0.76 points in X58-58, 0.63 points in X68-66, 0.59 points in X50-46, and 0.54 points in X42-52, and the corresponding annual oil exchange rates are 58% in X58-58, 51% in X68-66, 46% in X50-46, and 45% in X42-52. Thus, using the multiple linear regression method in the Daqing Oilfield development process can provide guidance, suggestions, and a dynamic development analysis basis.

FIGURE 6. (A,B) Oil saturation of simulated layer 16 in SU12; (C,D) oil saturation of simulated layer 20 in B1.
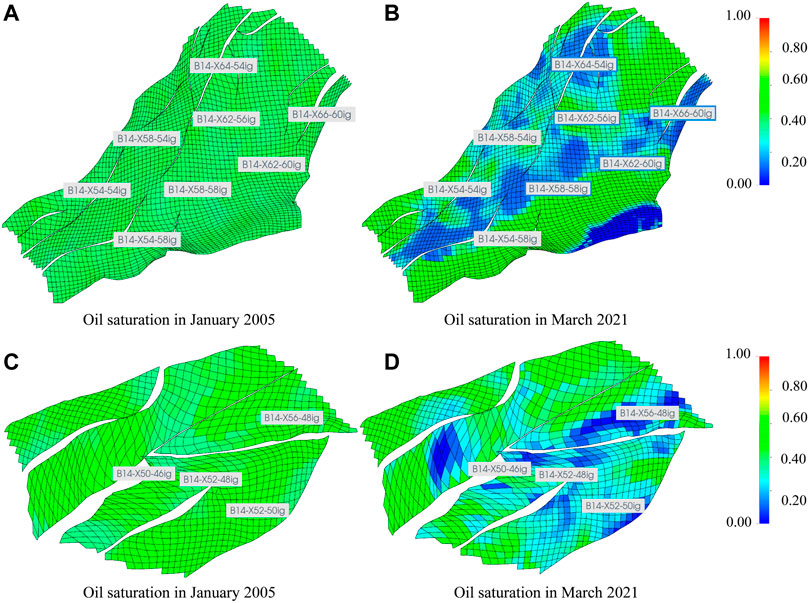
FIGURE 7. (A,B) Oil saturation of simulated layer 23 in B2; (C,D) oil saturation of simulated layer 17 in B3.
4 Conclusion
Multiple linear regression equations are used to perform the suitability evaluation of CO2 flooding reservoirs based on CMG numerical simulation results. The recovery rate can be considerably promoted by optimizing the well selection and gas injection scheme in block Bei14 (Enab and Ertekin, 2021; Olabode et al., 2021). As a proof, for well groups with an annual oil exchange ratio of 50% or more and evaluation values of 0.55 or more, later CO2 injection mining can be considered to increase the amount of gas injection for groups with a smaller amount of gas injection. For well groups with an annual oil exchange ratio between 40 and 50% and evaluation values between 0.55 and 0.50 and producing well groups that do not see gas, it is rationed with stable gas injection; for well groups with an annual oil exchange ratio between 30 and 40% and evaluation values of 0.50 or less, gas injection is reduced to control the gas–oil ratio for producing well groups that have already seen gas. Block Bei14 calculation results show that 76% of the well groups have an evaluation value above 0.50, and the annual oil exchange ratio of 72% of the well groups is about 40%; more than 70% of the well groups are suitable for CO2 flooding to increase oil recovery. Thus, CO2 flooding can be a good application prospect in the Daqing Oilfield and brings great economic benefits.
Data Availability Statement
The original contributions presented in the study are included in the article/Supplementary Material; further inquiries can be directed to the corresponding author.
Author Contributions
ZW: Conceptualization, methodology, and writing—Original draft preparation. JH: Writing—reviewing and editing. HH: Supervision. CW: Visualization and investigation. LW: Software and validation.
Funding
This project was supported by the China Petroleum Major Strategic Project (ZLZX 2020-01-04). The authors would like to acknowledge all the involved colleagues of Changzhou University, China University of Petroleum (Beijing), and Petro China Daqing Oilfield Limited Company.
Conflict of Interest
The authors declare that the research was conducted in the absence of any commercial or financial relationships that could be construed as a potential conflict of interest.
Publisher’s Note
All claims expressed in this article are solely those of the authors and do not necessarily represent those of their affiliated organizations or those of the publisher, the editors, and the reviewers. Any product that may be evaluated in this article or claim that may be made by its manufacturer is not guaranteed or endorsed by the publisher.
Supplementary Material
The Supplementary Material for this article can be found online at: https://www.frontiersin.org/articles/10.3389/fenrg.2022.929606/full#supplementary-material
References
Bhatti, A. A., Raza, A., Mahmood, S. M., and Gholami, R. (2019). Assessing the Application of Miscible CO2 Flooding in Oil Reservoirs: a Case Study from pakistan. J. Pet. Explor Prod. Technol. 9, 685–701. doi:10.1007/s13202-018-0504-x
Chai, X., Tian, L., Wang, G., Zhang, K., Wang, H., Peng, L., et al. (2021). Integrated Hierarchy-Correlation Model for Evaluating Water-Driven Oil Reservoirs. ACS omega 6, 34460–34469. doi:10.1021/acsomega.1c04631
Colclough, A. R. (1987). Two Theories of Experimental Error. J. Res. Natl. Bur. Stan. 92, 167. doi:10.6028/jres.092.016
DaneshFar, J., Nnamdi, D., Moghanloo, R., and Ochie, K. (2021). “Economic Evaluation of CO2 Capture, Transportation, and Storage Potentials in Oklahoma,” in SPE Annual Technical Conference and Exhibition, Dubai, United Arab Emirates, September, 2021 (OnePetro).
Enab, K., and Ertekin, T. (2021). Screening and Optimization of CO2-wag Injection and Fish-Bone Well Structures in Low Permeability Reservoirs Using Artificial Neural Network. J. Petroleum Sci. Eng. 200, 108268. doi:10.1016/j.petrol.2020.108268
Etemadi, S., and Khashei, M. (2021). Etemadi Multiple Linear Regression. Measurement 186, 110080. doi:10.1016/j.measurement.2021.110080
Feng, H., Haidong, H., Yanqing, W., Jianfeng, R., Liang, Z., Bo, R., et al. (2016). Assessment of Miscibility Effect for CO2 Flooding EOR in a Low Permeability Reservoir. J. Petroleum Sci. Eng. 145, 328–335. doi:10.1016/j.petrol.2016.05.040
Finke, C. E., Leandri, H. F., Karumb, E. T., Zheng, D., Hoffmann, M. R., and Fromer, N. A. (2021). Economically Advantageous Pathways for Reducing Greenhouse Gas Emissions from Industrial Hydrogen under Common, Current Economic Conditions. Energy Environ. Sci. 14, 1517–1529. doi:10.1039/d0ee03768k
Foukerdi, A., Esmaeili, S., and Shahrabadi, A. (2021). A Hybrid Fahp-Mcgp Approach to Sustainable Assessment of Candidate Eor Methods for a Given Oil Reservoir. J. Petroleum Sci. Eng. 207, 109143.. doi:10.1016/j.petrol.2021.109143
Gao, S.-H., Han, Q., Li, D., Cheng, M.-M., and Peng, P. (2021). “Representative Batch Normalization with Feature Calibration,” in Proceedings of the IEEE/CVF Conference on Computer Vision and Pattern Recognition, Nashville, TN, June 20–25, 2021, 8669–8679. doi:10.1109/cvpr46437.2021.00856
Gunst, R. F., and Webster, J. T. (1975). Regression Analysis and Problems of Multicollinearity. Commun. Statistics 4, 277–292. doi:10.1080/03610927308827246
Jiang, K., and Ashworth, P. (2021). The Development of Carbon Capture Utilization and Storage (Ccus) Research in china: A Bibliometric Perspective. Renew. Sustain. Energy Rev. 138, 110521. doi:10.1016/j.rser.2020.110521
Li, H.-B., Yang, Z.-M., Li, R.-S., Zhou, T.-Y., Guo, H.-K., Liu, X.-W., et al. (2021). Mechanism of CO2 Enhanced Oil Recovery in Shale Reservoirs. Petroleum Sci. 18, 1788–1796. doi:10.1016/j.petsci.2021.09.040
Li, Q. (2021). The View of Technological Innovation in Coal Industry under the Vision of Carbon Neutralization. Int. J. Coal Sci. Technol. 8, 1197–1207. doi:10.1007/s40789-021-00458-w
Liu, Z., Deng, Z., He, G., Wang, H., Zhang, X., Lin, J., et al. (2021). Challenges and Opportunities for Carbon Neutrality in china. Nat. Rev. Earth Environ. 3, 1–15. doi:10.1038/s43017-021-00244-x
Maaouane, M., Zouggar, S., Krajacˇic´, G., and Zahboune, H. (2021). Modelling Industry Energy Demand Using Multiple Linear Regression Analysis Based on Consumed Quantity of Goods. Energy 225, 120270doi:10.1016/j.energy.2021.120270
Mellor, D. H. (1965). Experimental Error and Deducibility. Philos. Sci. 32, 105–122. doi:10.1086/288031
Montgomery, D. C., and Voth, S. R. (1994). Multicollinearity and Leverage in Mixture Experiments. J. Qual. Technol. 26, 96–108. doi:10.1080/00224065.1994.11979510
Moreira, L. L., de Brito, M. M., and Kobiyama, M. (2021). Effects of Different Normalization, Aggregation, and Classification Methods on the Construction of Flood Vulnerability Indexes. Water 13, 98. doi:10.3390/w13010098
Olabode, O., Isehunwa, S., Orodu, O., and Ake, D. (2021). Optimizing Productivity in Oil Rims: Simulation Studies on Horizontal Well Placement under Simultaneous Oil and Gas Production. J. Pet. Explor Prod. Technol. 11, 385–397. doi:10.1007/s13202-020-01018-9
Piekutowska, M., Niedbała, G., Piskier, T., Lenartowicz, T., Pilarski, K., Wojciechowski, T., et al. (2021). The Application of Multiple Linear Regression and Artificial Neural Network Models for Yield Prediction of Very Early Potato Cultivars before Harvest. Agronomy 11, 885. doi:10.3390/agronomy11050885
Pokoradi, L., Kocak, S., and Toth-Laufer, E. (2021). “Fuzzy Hierarchical Failure Mode and Effect Analysis,” in 2021 IEEE 19th International Symposium on Intelligent Systems and Informatics (SISY), Subotica, Serbia, September 16–18, 2021 (IEEE), 71–76. doi:10.1109/sisy52375.2021.95825232
Pu, W., Gao, H., Zhao, S., and Gao, X. (2022). Microscopic Oil Displacement Mechanism of CO2 in Low-Permeability Heterogeneous Glutenite Reservoirs in the Junggar Basin. ACS Omega 7, 4420. doi:10.1021/acsomega.1c06265
Sun, L. (2021). The Application of Fuzzy Comprehensive Evaluation Method in Evaluating Remaining Oil Potential of Oil Layer. IOP Conf. Ser. Earth Environ. Sci. 781, 022030. (IOP Publishing). doi:10.1088/1755-1315/781/2/022030
Xiaolong, C., Yiqiang, L., Xiang, T., Huan, Q., Xuebing, S., and Jianghao, L. (2021). Effect of Gravity Segregation on CO2 Flooding under Various Pressure Conditions: Application to CO2 Sequestration and Oil Production. Energy 226, 120294. doi:10.1016/j.energy.2021.120294
Xu, C., Yang, J., He, L., Wei, W., Yang, Y., Yin, X., et al. (2021). Carbon Capture and Storage as a Strategic Reserve against China’s CO2 Emissions. Environ. Dev. 37, 100608. doi:10.1016/j.envdev.2020.100608
Yáñez Angarita, E. E., Núñez-López, V., Ramírez, A., Castillo Monroy, E., and Faaij, A. (2022). Rapid Screening and Probabilistic Estimation of the Potential for CO2-EOR and Associated Geological CO2 Storage in Colombian Petroleum Basins. Pet. Geosci. 28, petgeo2020–110. doi:10.1144/petgeo2020-110
Yu, H., Fu, W., Zhang, Y., Lu, X., Cheng, S., Xie, Q., et al. (2021). Experimental Study on EOR Performance of CO2-based Flooding Methods on Tight Oil. Fuel 290, 119988. doi:10.1016/j.fuel.2020.119988
Zandalinas, S. I., Fritschi, F. B., and Mittler, R. (2021). Global Warming, Climate Change, and Environmental Pollution: Recipe for a Multifactorial Stress Combination Disaster. Trends Plant Sci. 26, 588–599. doi:10.1016/j.tplants.2021.02.011
Zheng, Y., Gao, L., Li, S., and Wang, D. (2022). A Comprehensive Evaluation Model for Full-Chain Ccus Performance Based on the Analytic Hierarchy Process Method. Energy 239, 122033. doi:10.1016/j.energy.2021.122033
Zhou, W. (2021). Research and Practice of CO2 Flooding Technology in Ultra-low Permeability Reservoir of XX Oilfield. E3S Web Conf. 329, 01037. (EDP Sciences). doi:10.1051/e3sconf/202132901037
Keywords: CO2 flooding evaluation, Daqing Oilfield, numerical simulation, mathematical simulation, multiple linear regression
Citation: Wang Z, Hou J, Hao H, Wang C and Wang L (2022) Using the Multiple Linear Regression Method for CO2 Flooding Evaluation in the Daqing Oilfield. Front. Energy Res. 10:929606. doi: 10.3389/fenrg.2022.929606
Received: 27 April 2022; Accepted: 19 May 2022;
Published: 30 June 2022.
Edited by:
Yibo Li, Southwest Petroleum University, ChinaReviewed by:
Junyu You, Chongqing University of Science and Technology, ChinaMay Ali Alsaffar, University of Technology, Iraq
Hao Gao, Southwest Petroleum University, China
Copyright © 2022 Wang, Hou, Hao, Wang and Wang. This is an open-access article distributed under the terms of the Creative Commons Attribution License (CC BY). The use, distribution or reproduction in other forums is permitted, provided the original author(s) and the copyright owner(s) are credited and that the original publication in this journal is cited, in accordance with accepted academic practice. No use, distribution or reproduction is permitted which does not comply with these terms.
*Correspondence: Jirui Hou, aG91amlydWlAMTI2LmNvbQ==