 Dan Zhang1
 Long Wang
 Xucheng Chang
94% of researchers rate our articles as excellent or good
Learn more about the work of our research integrity team to safeguard the quality of each article we publish.
Find out more
BRIEF RESEARCH REPORT article
Front. Energy Res., 27 June 2022
Sec. Smart Grids
Volume 10 - 2022 | https://doi.org/10.3389/fenrg.2022.929235
This article is part of the Research TopicState Perception and Fault Diagnosis of New Power SystemsView all 17 articles
The state of health (SOH) of lithium-ion batteries is an important part of the battery management system (BMS). Accurately grasping the SOH of the lithium-ion battery will help replace the battery in time, to avoid accidents. Aiming at the problems of complex BMS management and high calculation cost caused by too many inputs/attributes, this study used feature engineering to mine the higher temperature variety rate associated with degraded capacity as the input of temporal convolutional networks (TCNs) and SOH as the output to establish the TCN model. On this basis, three lithium-ion batteries, namely, as B0005, B0007, and B0018 are verified, and the mean absolute error (MAE) and root mean square error (RMSE) of predicted SOH are not more than 1.455% and 1.800%, respectively. To further obtain the uncertain expression of predicted SOH, this study adopts the sampling method to obtain the confidence interval of lithium-ion battery SOH prediction results.
The lithium-ion battery is favored by people because of its advantages of high energy density, long service life, high stability, and moderate price. It has the highest degree of commercialization and is widely used in aerospace, electric vehicles, and smart grid. However, frequent fires and explosions make people gradually aware of the aging problem behind battery safety (Zhang and Lee, 2011; Li et al., 2021a). State of health (SOH) is an important indicator in the battery management system (BMS). By accurately grasping SOH, you can choose the time to replace the battery or change the charging strategy (Wang et al., 2022) to prolong the battery life. Therefore, accurate estimation of SOH is particularly important for control strategy formulation, operation, and maintenance (Meng et al., 2020).
There are two main methods for the evaluation of SOH: model-based and data-driven. The former includes the mechanism model, equivalent circuit model, and empirical model (Liu et al., 2017), which have the advantages of accuracy, simple modeling, and strong robustness, respectively, but they also have the problems of modeling difficulty (Ma et al., 2019), poor dynamic characteristics, and insufficient accuracy (Cai et al., 2021). The data-driven method based on statistics and artificial intelligence algorithms (Pang et al., 2014) does not need modeling. The accuracy of prediction results depends on feature engineering and algorithm selection. It has strong adaptability, so it is more widely used. At present, SOH is generally defined as follows (Zhang and Lee, 2011):
where
Song et al. (2020) and Lu et al. (2020) extracted some features from the capacity increment curve and studied the battery SOH with the help of Gaussian process regression and artificial neural network, respectively. Zhang et al. (2021a) extracted the average voltage, voltage difference, current difference, and temperature difference and evaluated the SOH of lithium-ion battery using XGBoost. Li et al., (2021b) established the SOH evaluation model by taking charging capacity, charging time, average charging temperature, average charging voltage, discharge temperature, and average discharge voltage as the input and discharge capacity as the output of the LSTM model. Li et al. (2020) directly used the voltage data during charging as the input of the GRU model to evaluate SOH. Shen et al. (2021) and Orchard et al. (2015) took voltage, current, and temperature in each cycle as inputs and used the CNN to establish the SOH prediction model. However, a large number of input attributes or input data greatly increase the complexity and computational cost of battery management (Olivares et al., 2013). In this study, through feature engineering, the temperature variety rate with the highest correlation with health status is mined as the input of the SOH evaluation model to predict SOH. However, a small number of characteristics or samples are difficult to reflect the capacity regeneration phenomenon in the aging process of the lithium-ion battery, which affects the accuracy of SOH evaluation [capacity regeneration phenomenon (Widodo et al., 2011; Bai et al., 2018) refer to the phenomenon that there is a certain interval between charging and discharging cycles, resulting in the increase of the maximum available capacity of the battery]. The recurrent neural network can track the capacity decline trend through the learning of time series, but at the same time, there is the problem that the prediction result lags behind the actual result. While the time convolution network (TCN) (Li et al., 2019) can also be used in time series, there is no lag problem and it has a better prediction effect. In addition, most studies only focus on the accuracy of the proposed algorithm, but for BMS, it is also necessary to obtain uncertain expression. Therefore, based on the TCN model, this study obtains the expression of uncertainty with the help of sampling.
Indirect health factors refer to the characteristics that are strongly related to aging and can characterize the SOH of lithium-ion batteries. Many studies mostly use equal voltage drop discharge time (Zhang et al., 2019; Gou et al., 2020), equal voltage differential charging time, or discharge voltage sample entropy (Zhang et al., 2021b). However, the determination process of these health factors is complex and cumbersome. Therefore, it is necessary to select other factors with a simple and reliable structure. Figure 1 shows the discharge temperature curve and voltage curve of the B0005 lithium-ion battery in the NASA data set. Through observation, it is found that the temperature curve and voltage curve change feebly in the [1,000 and 2,000] range, and with the deepening of the aging process, the slope of this part of the segment decreases and increases synchronously. Therefore, the temperature variety rate and voltage variety rate of the curve segments can be used as candidate indirect health factors. In addition, it can also be observed from Figure 1 that with the deepening of battery aging, the maximum discharge temperature also shows a synchronous upward trend. Due to some differences in the initial temperature, the temperature range is used as a candidate indirect health factor.
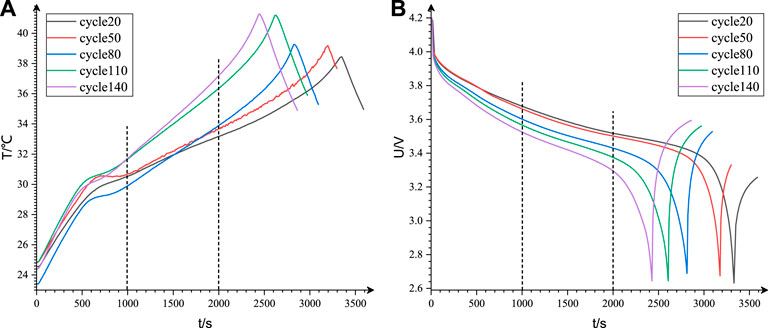
FIGURE 1. Discharge curve in different cycles during the aging process: (A) temperature; (B) voltage.
The voltage variety rate, temperature variety rate, and temperature range are, respectively, in the following forms:
where
Zhang et al. (2019) used the gray correlation method to analyze the correlation between candidate indirect health factor series and capacity series, which is cumbersome. This study uses the Pearson correlation coefficient method (Zhou et al., 2013) for research.
Thus, the correlation between candidate indirect health factor sequences and capacity sequences during discharge in NASA data sets B0005, B0006, B0007, and B0018 can be obtained.
It can be seen from Table 1 that the temperature change rate has the highest correlation and the visual effect is shown in Figure 2. Therefore, the temperature change rate is finally selected as an indirect health factor.
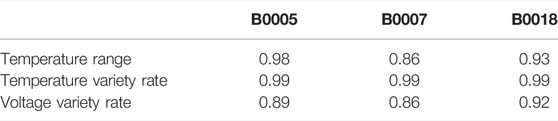
TABLE 1. Correlation coefficients between different candidate indirect health factors and capacity.
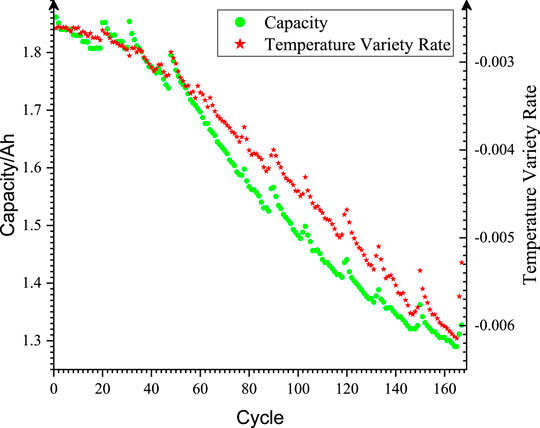
FIGURE 2. Correlation between temperature variety rate and capacity.
To resolve the traditional neural network not being able to solve the timing constraints of time series, a recurrent neural network (RNN) was proposed. However, with the increase in data scale, the problems of gradient disappearance and gradient explosion may occur. To overcome this disadvantage, long–short-term memory (LSTM), gated recurrent unit (GRU), and other methods have been derived based on the RNN. Although LSTM and GRU show better performance than the RNN in memory and accuracy, the advantage of “infinite memory” does not exist. Li et al. (2019) point out that convolution structure is superior to recurrent neural networks in tasks such as audio synthesis and machine translation. On this basis, the TCN framework is explored. This framework is superior to recurrent neural networks in memory ability and accuracy, which provides a novel idea and direction for the solution of time-series problems. The TCN includes one-dimensional causal convolution, extended causal convolution, and residual connection.
One-dimensional convolution in the TCN, such as two-dimensional convolution, still has the characteristics of weight sharing. Given a time series
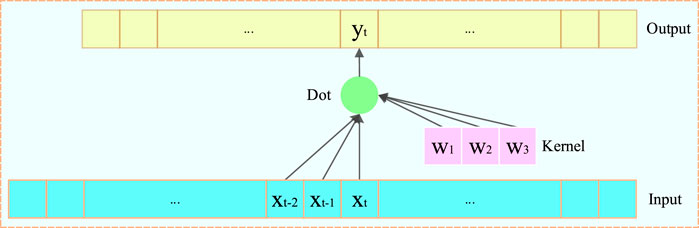
FIGURE 3. One-dimensional convolution.
The deep network can be obtained by superposition based on a one-dimensional causal convolution network, but the increase of the receptive field is obtained at the expense of the depth of the network, so it is difficult to deal with long historical data. To solve this problem, TCN proponents refer to the dilatory causal convolution in the WaveNet model (Ding and Jia, 2019). The definition of extended causal convolution is given as follows:
where
The operation is realized using the dilation factor (default 2), which increases the receptive field
where
It can be seen from the aforementioned text that through the selection of convolution kernel size and base expansion factor, a relatively small number of network layers can be used to achieve a large receptive field. However, despite the abovementioned operations, the network will be very deep. Therefore, TCN proponents introduced a residual block structure similar to Resnet. As shown in Figure 4, the residual block includes a two-layer convolution network and nonlinear mapping. To normalize the input of the hidden layer and offset the problem of gradient explosion, weight normalization is applied to each convolution layer. However, the aforementioned architecture can only realize complex linear regression, and nonlinearity needs to be introduced by adding the activation function. In addition, to prevent overfitting and gradient disappearance and accelerate model training, regularization is introduced by dropout after each convolution layer of each remaining block.
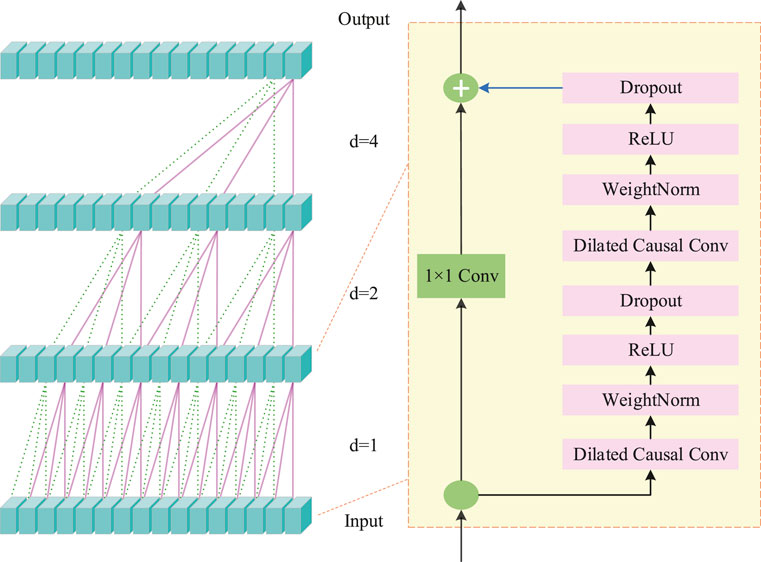
FIGURE 4. Capacity degradation curves for B0005, B0007, and B0018.
During the jump connection, because the number of channels in the input layer and the output layer may be inconsistent, the output and input cannot be added directly. To solve this problem, 1 can be introduced × 1 convolution to ensure that the two tensors have the same shape.
where
The experimental analysis model in this study is based on Python 3 6. The experiment was carried out on the Dell Notebook. The relevant configurations are as follows: the system model is Inspiron 5488, the GPU is NVIDIA GeForce mx250, the CUDA version is 10.1, and the Pytorch version is 1.7.1.
The data set was provided by the NASA Ames prediction Excellence Center (Lin et al., 2021). On the accelerated life test platform developed by NASA, a 18650 lithium cobalate battery with a rated capacity of 2 Ah was used to carry out reference charge and discharge tests according to different test configuration files. First, for the reference charge test, the battery was charged to the charge cut-off voltage at constant current and then charged to the cut-off current at a constant voltage. For the reference discharge test, the battery should be discharged at a constant current until the voltage is below the discharge cut-off voltage. The dataset files in the mat format include two parts: one is the voltage, current, temperature, and time in the test; and the other is the capacity estimated using the Coulomb counting method (Lee et al., 2020). The discharge test conditions are shown in Table 2 below.
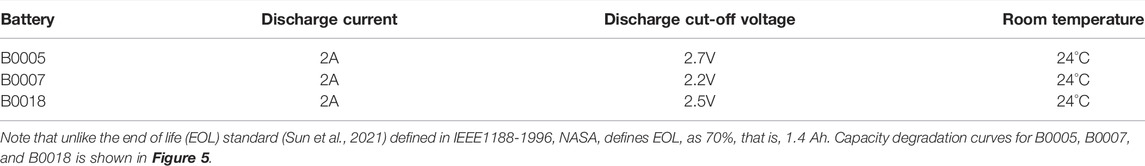
TABLE 2. Discharge test conditions of lithium-ion battery.
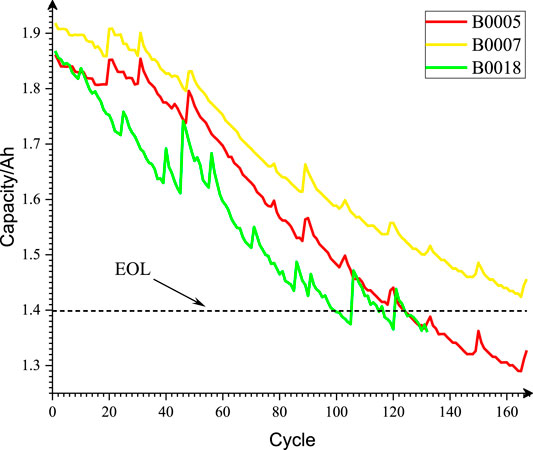
FIGURE 5. Complete TCN model.

TABLE 3. Model configuration.

TABLE 4. SOH prediction effect under different prediction starting points and algorithm combinations.
In this study, “charge–discharge” is regarded as a cycle. It should be noted that there are some wrong data in the NASA data set. For example, in the 310th and 313rd operations of B5, the charging record is missing, resulting in repeated discharge. For this phenomenon, the records of repeated charging or discharging operations are deleted (Zhao et al., 2021). Therefore, the cycle times of B5, B6, B7, and B18 are 167, 167, 167, and 132, respectively. Then, the time series comprising temperature change rate and SOH is transformed into samples required for supervised learning according to a certain window (is set to 8), and then the samples are divided into the training set, verification set, and test set according to different prediction starting points. If the starting point is set to 90, the training set is 73 samples generated from the data of the first 80 discharges. The validation set is 10 samples immediately after the training set, and the test set is the remaining samples. In addition, at the beginning of model training, the Z-score method should be used to standardize the data.
The model parameters are configured in Table 3, as follows:
In addition, to stop training in and obtain a better model, early stop technology is also adopted.
For the prediction effect of SOH, in addition to the average absolute error MAE (mean absolute error) and root mean error RMSE (root mean square error), the absolute error AE (absolute error) between the predicted value of EOL and the real value is used as the evaluation index.
where
To better illustrate the rationality of the selected health factors and algorithms, it is further compared with LSTM, GRU, and CNN–LSTM algorithms, and the prediction effect is shown in Table 4 below. Since B0018 has prominent capacity regeneration and there are fewer samples to be predicted than other batteries, it has a better visual display effect. Therefore, taking B0018 as an example, Figures 6, 7 show the SOH prediction effects under different algorithms and different prediction starting points, respectively.
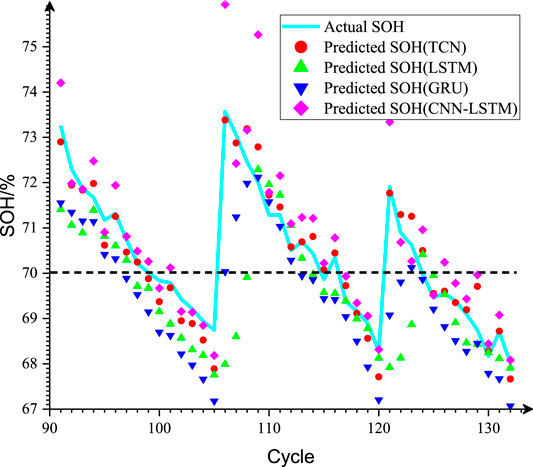
FIGURE 6. B0018 SOH prediction effect under different algorithms (starting point is set to 90)
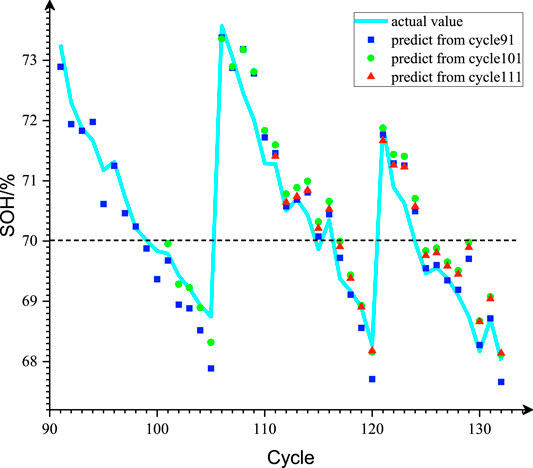
FIGURE 7. B0018 SOH prediction effect under different prediction starting points (TCN).
It can be seen from the table that the performance of the TCN in B0007 and B0018 is significantly better than that of LSTM, GRU, and CNN–LSTM. For B0005, when the prediction starting point is 90, the MAE and RMSE of the prediction results of the TCN algorithm are greater than those of other algorithms, but AE is less than that of other algorithms, indicating that the TCN can better predict the SOH of the discharge process before EOL, and there is a large deviation in the later stage, resulting in larger MAE and RMSE. Therefore, in general, the effect of the TCN is significantly better than that of other comparison algorithms involved in this study.
Since the effect of the TCN algorithm is obviously better than that of other algorithms, only the SOH prediction effects of the other two batteries under different prediction starting points are shown in Supplementary Figures SA1, SA2.
The aforementioned prediction process is point estimation. However, the prediction of SOH should also include confidence interval, that is, uncertainty expression. In this study, the confidence interval of SOH in each discharge process is obtained by 100 repeated simulations. Still B0018 is taken as an example. When the starting point of prediction is 90, it can be seen from Figure 8 that the real value can better fall within the prediction confidence interval between [91, 134]. For the visual display effect of B005 and B007, please refer to Supplementary Figures SB1, SB2). The average value of standard deviation in the confidence interval is 0.096% and 0.153%. Similarly, Table 5 also gives the confidence interval, mean value, and maximum value of standard deviation for other batteries and prediction starting points. Through comparison, it is found that when the prediction starting point is set to 90, the reliable prediction interval is the largest, and the mean value and maximum value of standard deviation are also small. Therefore, the prediction starting point should be set to 90.

FIGURE 8. Uncertainty expression of SOH prediction results of B0018.
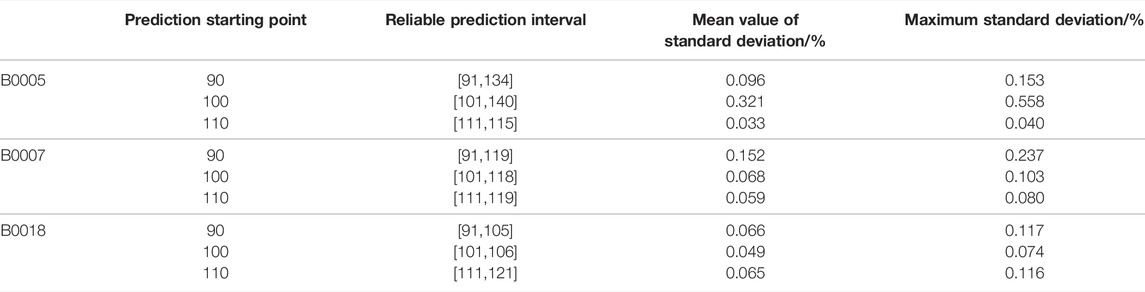
TABLE 5. Uncertainty expression of SOH prediction results.
Based on the NASA public data set, a novel convolutional neural network is used to evaluate the SOH of lithium-ion batteries by using the temperature variety rate of indirect health factors mined by feature engineering. On this basis, the uncertainty expression of SOH evaluation is given by sampling. The verification results show that the extracted health factors are simple and feasible and the algorithm has high accuracy. Therefore, the method proposed in this study has high practical value.
The original contributions presented in the study are included in the article/Supplementary Material; further inquiries can be directed to the corresponding author.
DZ: conceptualization and writing—review and editing; WZ: writing—original draft preparation and investigation; LW: supervision; XC: conceptualization and resources; XL: writing–review and editing and software; PW: supervision.
This work is jointly supported by the Key Science and Technology Projects of Henan Province (182102310784, 222102240117, 212102210026, 192102210306, and 212102110218).
Author WZ was employed by the State Grid Luoyang Electric Power Supply Company.
The remaining authors declare that the research was conducted in the absence of any commercial or financial relationships that could be construed as a potential conflict of interest.
All claims expressed in this article are solely those of the authors and do not necessarily represent those of their affiliated organizations, or those of the publisher, the editors, and the reviewers. Any product that may be evaluated in this article, or claim that may be made by its manufacturer, is not guaranteed or endorsed by the publisher.
The Supplementary Material for this article can be found online at: https://www.frontiersin.org/articles/10.3389/fenrg.2022.929235/full#supplementary-material
Bai, S., Kolter, J. Z., and Koltun, V. (2018). An Empirical Evaluation of Generic Convolutional and Recurrent Networks for Sequence Modeling. arXiv preprint arXiv:1803.01271.
Cai, Y. P., Chen, W., and Su, Y. Z. (2021). Review of Remaining Useful Life Prediction for Lithium Ion Batteries. Chin. J. Power Sources 45 (05), 678–682. doi:10.3969/j.issn.1002-087X.2021.05.031
Ding, Y. Z., and Jia, J. F. (2019). Improved PSO Optimized Extreme Learning Machine Predicts Remaining Useful Life of Lithium-Ion Battery. J. Electron. Meas. Instrum. 33 (02), 72–79. doi:10.13382/j.jemi.B1801769
Gou, B., Xu, Y., Feng, X., Xu, Y., and Feng, X. (2020). State-of-Health Estimation and Remaining-Useful-Life Prediction for Lithium-Ion Battery Using a Hybrid Data-Driven Method. IEEE Trans. Veh. Technol. 69 (10), 10854–10867. doi:10.1109/tvt.2020.3014932
Lee, C.-H., Wu, Z., Hsu, S., Wu, Z.-Y., Hsu, S.-H., and Jiang, J.-A. (2020). Cycle Life Study of Li-Ion Batteries with an Aging-Level-Based Charging Method. IEEE Trans. Energy Convers. 35 (3), 1475–1484. doi:10.1109/tec.2020.2984799
Li, C. R., Xiao, F., and Fan, F. X. (2020). An Approach to Lithium-Ion Battery SOH Estimation Based on Convolutional Neural Network. Trans. China Electrotech. Soc. 35 (19), 4106–4119. doi:10.19595/j.cnki.1000-6753.tces.191617
Li, C. R., Xiao, F., and Fan, F. X. (2021). Joint Estimation of the State of Charge and the State of Health Based on Deep Learning for Lithium-Ion Batteries. Proc. CSEE 41 (02), 681–692. doi:10.13334/j.0258-8013.pcsee.191867
Li, X., Wang, Z., Zhang, L., Wang, Z., Zhang, L., Zou, C., et al. (2019). State-of-health Estimation for Li-Ion Batteries by Combing the Incremental Capacity Analysis Method with Grey Relational Analysis. J. Power Sources 410-411, 106–114. doi:10.1016/j.jpowsour.2018.10.069
Li, X., Chen, B., and Gu, L. (2021). Research Progress of Health Assessment Methods for Lithium Ion Batteries. Chin. J. Power Sources 45 (06), 818–822. doi:10.3969/j.issn.1002-087X.2021.06.032
Lin, Q., Xu, Z., Lin, C., Xu, Z., and Lin, C.-M. (2021). State of Health Estimation and Remaining Useful Life Prediction for Lithium-Ion Batteries Using FBELNN and RCMNN. J. Intelligent. Fuzzy. Sys. 40 (6), 10919–10933. doi:10.3233/jifs-201952
Liu, Z., Sun, G., Bu, S., Han, J., Tang, X., and Pecht, M. (2017). Particle Learning Framework for Estimating the Remaining Useful Life of Lithium-Ion Batteries. IEEE Trans. Instrum. Meas. 66 (2), 280–293. doi:10.1109/tim.2016.2622838
Lu, S., Wang, F., and Piao, C. (2020). Health State Prediction of Lithium Ion Battery Based on Deep Learning Method. Mater. Sci. Eng. 782 (3), 32083. doi:10.1088/1757-899x/782/3/032083
Ma, Y., Chen, Y., and Zhang, F. (2019). Remaining Useful Life Prediction of Power Battery Based on Extend H_∞ Particle Filter Algorithm. J. Mech. Eng. 55 (20), 36
Meng, J., Cai, L., Stroe, D., Cai, L., Stroe, D.-I., Ma, J., et al. (2020). An Optimized Ensemble Learning Framework for Lithium-Ion Battery State of Health Estimation in Energy Storage System. Energy 206, 118140. doi:10.1016/j.energy.2020.118140
Olivares, B. E., Cerda, M. A., Orchard, M. E., Cerda Munoz, M. A., Orchard, M. E., and Silva, J. F. (2013). Particle-Filtering-Based Prognosis Framework for Energy Storage Devices with a Statistical Characterization of State-of-Health Regeneration Phenomena. IEEE Trans. Instrum. Meas. 62 (2), 364–376. doi:10.1109/tim.2012.2215142
Orchard, M. E., Lacalle, M. S., Olivares, B. E., Lacalle, M. S., Olivares, B. E., Silva, J. F., et al. (2015). Information-Theoretic Measures and Sequential Monte Carlo Methods for Detection of Regeneration Phenomena in the Degradation of Lithium-Ion Battery Cells. IEEE Trans. Rel. 64 (2), 701–709. doi:10.1109/tr.2015.2394356
Pang, J. Y., Ma, Y. T., and Liu, D. T. (2014). Indirect Remaining Useful Life Prognostics for Lithium-Ion Battery. China Sci. 9 (01), 28–36. doi:10.3969/j.issn.2095-2783.2014.01.006
Shen, S., Liu, B., Zhang, K., and Ci, S. (2021). Toward Fast and Accurate SOH Prediction for Lithium-Ion Batteries. IEEE Trans. Energy Convers. 36 (3), 2036–2046. doi:10.1109/tec.2021.3052504
Song, S., Fei, C., and Xia, H. (2020). Lithium-Ion Battery SOH Estimation Based on XGBoost Algorithm with Accuracy Correction. Energies 13 (4), 812. doi:10.3390/en13040812
Sun, B. X., Ren, P. B., and Chen, Y. Z. (2021). Analysis of Influencing Factors of Degradation under Different Interval Stress and Prediction of Aging Trend in Any Interval for Lithium-Lon Battery. Trans. China Electrotech. Soc. 36 (03), 666–674. doi:10.19595/j.cnki.1000-6753.tces.200071
Wang, P., Zhang, J. A., and Cheng, Z. (2022). State of Health Estimation of Li-Ion Battery Based on Least Squares Support Vector Machine Error Compensation Model. Power Syst. Technol. 46 (02), 613–623. doi:10.13335/j.1000-3673.pst.2021.0045
Widodo, A., Shim, M., Caesarendra, W., Shim, M.-C., Caesarendra, W., and Yang, B.-S. (2011). Intelligent Prognostics for Battery Health Monitoring Based on Sample Entropy. Expert Syst. Appl. 38 (9), 11763–11769. doi:10.1016/j.eswa.2011.03.063
Zhang, J., and Lee, J. (2011). A Review on Prognostics and Health Monitoring of Li-Ion Battery. J. Power Sources 196 (15), 6007–6014. doi:10.1016/j.jpowsour.2011.03.101
Zhang, S., Zhai, B., and Guo, X. (2019). Synchronous Estimation of State of Health and Remaining Useful Lifetime for Lithium-Ion Battery Using the Incremental Capacity and Artificial Neural Networks. J. Energy Storage 26, 1–12. doi:10.1016/j.est.2019.100951
Zhang, S. Y., Wu, C. H., and Xiong, W. Y. (2021). State of Health Estimation for Lithium-Ion Batteries Using Recurrent Neural Networks with Gated Recurrent Unit. Infrared Laser Eng. 50 (02), 236–243. doi:10.3788/IRLA20200339
Zhang, Z. Q., Yu, Y. J., and Li, Q. (2021). Relevance Vector Machine Algorithm to Predict State of Health and Remaining Useful Life of Battery. Chin. J. Power Sources 45 (03), 419–423. doi:10.3969/j.issn.1002-087X.2021.03.035
Zhao, Q. F., Cai, Y. P., and Wang, X. J. (2021). WOA-ELM Based Indirect Prediction of Remaining Useful Life of Lithium-Ion Battery. China Meas. Test 47 (09), 138
Keywords: lithium-ion battery, temporal convolutional networks, NASA dataset, uncertain expression, state of health (SOH)
Citation: Zhang D, Zhao W, Wang L, Chang X, Li X and Wu P (2022) Evaluation of the State of Health of Lithium-Ion Battery Based on the Temporal Convolution Network. Front. Energy Res. 10:929235. doi: 10.3389/fenrg.2022.929235
Received: 26 April 2022; Accepted: 09 May 2022;
Published: 27 June 2022.
Edited by:
Yaxing Ren, University of Warwick, United KingdomReviewed by:
Jiawen Li, South China University of Technology, ChinaCopyright © 2022 Zhang, Zhao, Wang, Chang, Li and Wu. This is an open-access article distributed under the terms of the Creative Commons Attribution License (CC BY). The use, distribution or reproduction in other forums is permitted, provided the original author(s) and the copyright owner(s) are credited and that the original publication in this journal is cited, in accordance with accepted academic practice. No use, distribution or reproduction is permitted which does not comply with these terms.
*Correspondence: Long Wang, aG91ZGV6YWl3dTIwMTBAeWVhaC5uZXQ=
Disclaimer: All claims expressed in this article are solely those of the authors and do not necessarily represent those of their affiliated organizations, or those of the publisher, the editors and the reviewers. Any product that may be evaluated in this article or claim that may be made by its manufacturer is not guaranteed or endorsed by the publisher.
Research integrity at Frontiers
Learn more about the work of our research integrity team to safeguard the quality of each article we publish.