 Yaouba
 Mohit Bajaj
 Colince Welba
 Kola Bernard1,2
 Kitmo
Kitmo Salah Kamel
 Mohamed F. El-Naggar
- 1Research Centre for Renewable Energy, Institute of Geological and Mining Research, Yaoundé, Cameroon
- 2Department of Renewable Energy, National Advanced School of Engineering of University of Maroua, Yaoundé, Cameroon
- 3Department of Electrical Engineering, Graphic Era (Deemed to be University), Dehradun, India
- 4Department of Electrical and Electronics Engineering, National Institute of Technology Delhi, New Delhi, India
- 5Department of Fundamental Sciences, National Advanced School of Mines and Petroleum Industries, University of Maroua, Maroua, Cameroon
- 6Department of Electrical Engineering, Aswan University, Aswan, Egypt
- 7Department of Electrical Engineering, College of Engineering, Prince Sattam Bin Abdulaziz University, Al-Kharj, Saudi Arabia
- 8Department of Electrical Power and Machines Engineering, Faculty of Engineering, Helwan University, Cairo, Egypt
Partial shading is a factor that influences the performance of a PV module. The study sought to evaluate the impact of partial shading on PV module performance in the Sudano-Sahelian climate conditions of Cameroon. The behavior of the PV module was simulated using MATLAB/Simulink for 12 months with data from the town of Yagoua. The power, current, and voltage losses of the PV module were estimated by varying the partial shading rate from 5.0% to 95.0%, with an increase factor of 5.0%. The results show that, when the shading ranges from 5.0% to 55.0%, the power and current losses are very significant and vary from 3.0% to 52.0% and 3.0%–53.0%, respectively. The voltage in this shading range remains almost invariant. For shading from 60.0% to 95.0%, the power losses increase slightly and reach approximately 60.0%. A very small current loss is observed, varying from 1.0% to 3.0%. Significant voltage losses are noted and vary from 55.0% to 59.0%. From 40.0% shading rate onwards, a mismatch is observed on the power-voltage characteristics curve by the presence of two maximum power points. This method can be used to evaluate the efficiency of different PV array topologies under partial shading. The results show the importance of paying attention to partial shading, however small its occurrence.
Introduction
In recent years, the use of renewable energies (RE), especially solar energy, has increased due to the growing energy demand (Boukenoui et al., 2016; Chalh et al., 2021). The conversion of solar energy into electricity is possible thanks to a photovoltaic module made from semiconductor materials. Several factors, such as irradiance, temperature, and partial shading significantly influence the performance of a PV module (Fouad et al., 2017; Pendem and Mikkili, 2018; Kitmo et al., 2021). In the case of shading, the irradiance is distributed unevenly over the PV module (Saiprakash et al., 2021). Shading can be caused by clouds, buildings, trees, dirt, or dust deposits (Belhaouas et al., 2017).
The PV module has a non-linear current-voltage characteristic and delivers a power that depends on the irradiance and temperature of the environment where it is installed. Therefore, its power-voltage characteristic has a maximum power point for each given irradiance (Bingöl and Özkaya, 2018; Kitmo Tchaya and Djongyang, 2021). However, in order for a module to produce its maximum power, it must operate permanently at the so-called maximum power point. Due to the intermittency of solar radiation (Kunz et al., 2020), it is difficult for the module to always deliver its maximum power at this maximum power point (MPP) (Yang et al., 2022). In order to solve this problem, a technique called maximum power point tracking (MPPT) was developed. MPPT ensures that the maximum power is always extracted from the installed PV system (Balasubramanian et al., 2014). When the PV module or array operates under shading condition, it receives different values of irradiance. This generates several maxima in the I-V and P-V characteristics of the PV module or array, which make it difficult at this time for the MPPT to determine the true MPP (Forcan et al., 2016), hence the system losses (Dangi et al., 2022). Furthermore, the shaded cells behave as a resistor that dissipates the power produced by the neighboring cells and this dissipated power is converted into heat that increases the cell temperature (Mehiri et al., 20182017). In practice, it is difficult to avoid partial shading due to the causes mentioned above. Therefore, this topic requires several inquiries into the impact of shading on the PV module performances (Mamun et al., 2017). The analysis of shading losses in a PV system points to a method that will allow for the reduction of these losses.
PV generators are forms of renewable energy that encounter many difficulties (Hassan et al., 2022). Among the problems that arise in the conversion of energy is the issue of partial or total shading of PV modules. Variations in temperature are also a source of enormous difficulties. When PV cells are not subject to test conditions where they can deliver the maximum energy, it is important to seek solutions to optimize their systems. For this reason, a lot of progress has been made in the optimization of photovoltaic systems (Jaszczur et al., 2020). We have, for example, metaheuristic methods for searching for MPP, such as the MPPT algorithm, genetic algorithms (Verma et al., 2021), particle swarm optimization (Maleki and Pourfayaz, 2015), the cuckoo search, and the whale optimization algorithm (Maleki and Pourfayaz, 2015). However, improvement in the conditions of use of PV energy remains insufficient. During rainy seasons in temperate regions, the problem of shading due to the presence of clouds still remains. It is a complex problem and knowledge of all the necessary parameters is required in order to convert the sun’s energy into electricity (Alturki and Awwad, 2021). As long as the universe remains a mystery, so too the control of climatic conditions. In addition to the variations in climatic conditions, such as temperature, sunshine, air mass density, and atmospheric pressure, there are also the problems of switching losses, Joule effect, or conduction losses of power electronics components to be solved (Fetanat and Khorasaninejad, 2015; Jaszczur and Hassan, 2020). However, in this work, only the problem of partial shading or losses due to climatic variations on PV generators will be addressed. Previous studies show 25.0%, 50.0%, 75.0%, and 100.0% of partial shading effect. Little work has been done on the effect of other shading levels. Based on these prior works, this study seeks to evaluate the impact of partial shading on the performance of a PV module operating in the Sudano-Sahelian climate of Cameroon by varying the percentage of shading from 5.0% to 95.0% with a 5.0% step. To do this, we used irradiance and temperature data from the town of Yagoua located in the Sudano-Sahelian zone of Cameroon. These data are simulated in MATLAB Simulink where we vary the partial shading to determine the impact on the PV module performance installed in the study area.
Related Works
The literature presents several works evaluating the partial shading impact on PV module performance. Some of these works, including the most recent, are cited in the following brief summary of the state of the art.
Yu et al. (2021) investigated the power dissipation of PV modules under partial shadowing using circuit analysis for series-connected PV modules. The specific current and voltage operating points of the shaded PV module were investigated. To validate the power dissipation study, the PSIM simulation tool was used. When there was no bypass diode and three solar modules were coupled in series, the shaded PV module could waste up to 39.1% maximum PV power. When the bypass was connected, however, 0.3% maximum power was lost in the shaded PV module. The suggested approach to shaded PV module analysis could be used in PV system performance analysis, particularly for maximum power. Papul and Sanjeev (2019) sought to describe the behavior of a solar PV array under various shadowing patterns. In addition, a detailed comparison of the best feasible shading patterns was made in order to maximize the efficiency of the PV array during partial shade situations. The voltage-current (V-I) and voltage-power (V-P) characteristics were given for both the simulation and experimental setup under different shading patterns and climatic conditions. Finally, the MPP was computed for both cases, and the results found to be similar. Hamed et al. (2019) compared a standard 60-cell c-Si PV module with three bypass diodes to a hot-spot-free module with one bypass diode for each solar cell. Different partial shade conditions were given to both modules, and the findings demonstrate that, under different shading scenarios, the hot-spot-free module produces 32.0% and 80.0% more power than the normal module. The authors created a new testing setup that shifted the bias every 60.0 s and measured the temperature using an infrared sensor to explore the robustness of the bypass diode under shadowing circumstances. The results suggest that the module is trustworthy enough to have a lifetime of 25 years After developing a mathematical modeling approach to simulate overlapped PV modules, Zaid and Yousef (2019) conducted a comprehensive study and analysis of the effect of overlapped bypass diodes on the electrical response of PV modules under a wide range of possible shading levels in order to fully understand their effects and impact. Furthermore, their research disclosed the impact of these overlapped diodes on partial shading power losses and hot-spot development, both of which have yet to be studied in the literature of overlapping PV modules. The potential detrimental impacts on micro inverter efficiency were also demonstrated. The results were confirmed empirically via MATLAB Simulink (Alqaisi and Mahmoud, 2019). Oliver et al. (2020) evaluated the robustness of shingled modules in terms of power produced and power dissipated in partially shaded shingles using equivalent circuit modeling. The modeling results have been experimentally validated. The authors discovered that power losses in shingled modules could be higher than in conventional modules with comparable shading conditions. Because of the significantly larger reverse biases encountered by shaded shingles, the possibility of significant local heating as a result of partial shading, potentially leading to catastrophic module failure, is also increased in shingled modules. Both concerns can be efficiently minimized by running each shingled module at its own maximum power point; for example, by integrating a sufficient number of module level power circuits on each module. In the past 3 years, work has tended to be oriented towards performance analysis of hybrid photovoltaic array configurations under randomly distributed shading patterns (Mustafa et al., 2019; Jha, 2021; Jha, 2022).
In this article, we conduct an experimental and case study evaluating the impact of partial shading on the performance of PV modules operating in the Sudano-Sahelian climate of Cameroon. The particularity of this study is based on the study area, which is very hot, where occasionally temperatures reach 35° or even 40°C in the shade.
Materials and Methods
Equivalent Model of the PV Module
Several electrical models, such as the one-diode, the two-diode, the three-diode, and the bishop, describe a PV cell. Generally, the one-diode model is the most used (Saiprakash et al., 2021). Figure 1 shows the equivalent circuit of the one-diode model.
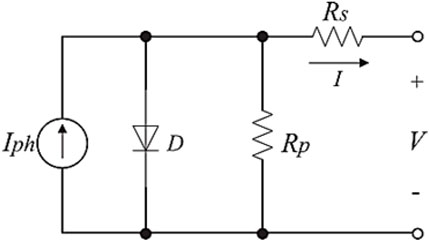
FIGURE 1. The equivalent circuit of the one-diode model of a PV cell (Mokhtara et al., 2021).
The following equations are derived from this circuit
where, VT = kT/q is the thermal voltage of the PV cell; Iph: Photo current generated due to incident solar irradiance; I0: reverse saturation current of the diode; k: Boltzmann’s constant (1.3806503 × 10⁻²³ J/K); T: Cell operating temperature in kelvin (K); q: Charge of the electron (1.60217646 × 10⁻¹⁹ C); Rs: Series resistance representing an internal resistance of the PV cell (Ω); Rp: Shunt or parallel resistance representing the leakage current of the PV cell (Ω); A: Diode ideality factor; Isc: Shunt circuit current of the cell at 25°C and 1,000 W/m2; Ki: Temperature coefficient of the cell at Isc; Tref: Reference temperature of the cell; G: Solar irradiation in W/m2; Gn: Nominal solar irradiation in W/m2; In,0: Nominal saturation current; Eg: Semiconductor energy band gap (Eg = 1.12 eV for the polycrystalline silicon at 25°C).
Geographical Coordinates and Meteorological Data of the Study Site
Table 1 presents the geographical coordinates of the town under study (Yagoua). Meteorological data of the site under study (Yagoua) are summarized in Table 2.
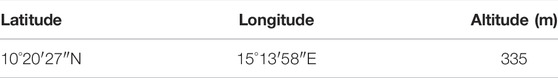
TABLE 1. Geographical coordinates of the study site (Yagoua town) (Dadjé et al., 2017).

TABLE 2. Meteorological data of the study site (Yagoua town, 2016) (Dadj é et al., 2017).
Proposed Methodology
The proposed methodology consisted of simulating the operation of the MSX-60 polycrystalline module whose parameters are described in Table 3 in the MATLAB Simulink environment. In the first step, the module is operated under standard test conditions (STC). Secondly, the module is subjected to the climatic conditions (irradiance and temperature) of the study site with uniform radiation over the entire panel surface. After that, the shading is varied from 5.0% to 95.0% on 18 cells of the PV module, first with annual average irradiance and temperature data, then with monthly data. The values of power, current, and voltage at the maximum power point (Pmp, Imp, Vmp, respectively) (Fouad et al., 2017) are recorded. Finally, an analysis of the losses of these three electrical parameters is made.
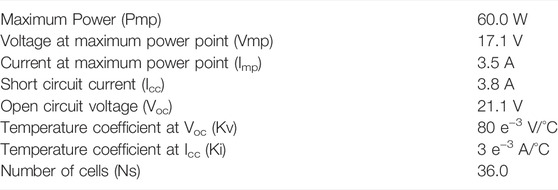
TABLE 3. PV module specifications at STC 1000 W/m2, 25°, AM1.5 (Dadjé et al., 2017a).
Results and Discussion
I-V and P-V Characteristics of the PV Module Under STCs
According to Figure 2, the electrical parameters obtained are Voc = 21.59 V, Icc = 3.8 A, Vmp = 17.97 V, Imp = 3.52 A, Pmp = 63.3 W. These simulated values are close to the data sheet values with a slight difference.
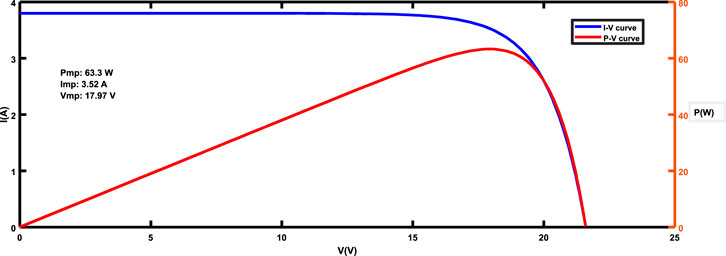
FIGURE 2. I-V and P-V characteristics curves of the PV module under STCs (1,000 W/m2, 25°C).
Effect of Solar Irradiation and Temperature of the Study Site
The site temperature varies from 24.9°C to 35.7°C, while the irradiance varies from 752.4 to 1,352.2 W/m2. January is the month with the lowest irradiance while March is the warmest month at the site with the highest irradiance.
Figure 3 shows the characteristics curves of the PV module under variation of irradiance and temperature at the study site.
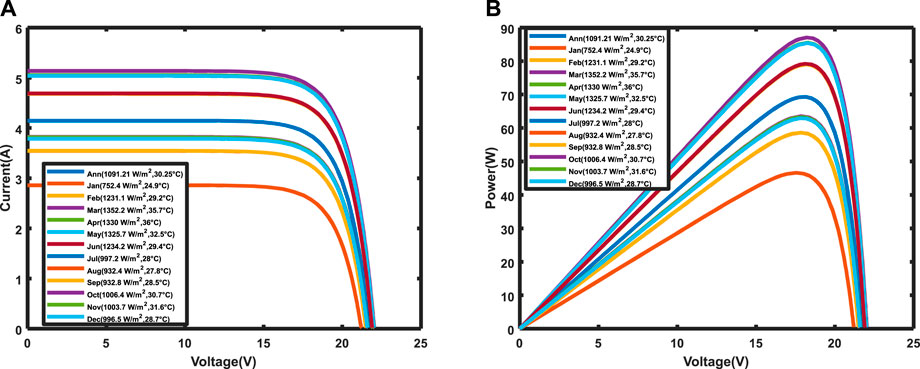
FIGURE 3. (A) I-V and (B) P-V characteristics curves of the PV module under variation of irradiance and temperature at the study site.
Partial Shading Fault Effect on the I-V and P-V Characteristic Curves of the PV Module
In order to observe the effect of shading fault on the I-V and P-V characteristics curves of the PV module, the percentage of shading was varied from 5.0% to 95.0% with a 5.0% step. These percentages were applied to the average annual irradiance (1,091.21 W/m2) and temperature (30.25°C) of the site. The results obtained are illustrated in Supplementary Figures S1–S5 in the Supplementary Material (see Supplementary Material).
From 5.0% to 15.0% shading (Supplementary Figure S1), a slight deformation of the I-V and P-V characteristics curves is observed. Pmp and Imp decrease by 3.0 W and 0.2 A, respectively, while Vmp increases slightly by 0.14 V.
From 20.0% to 35.0% shading (Supplementary Figure S2), a significant deformation of the characteristics curves is observed, and the inflection points appear. The Pmp varies approximately by 3.5 W, the Imp by 0.2 A. The Vmp remains practically stable around 18.4 V.
From 40.0% to 55.0% shading (Supplementary Figure S3), two MPPs are visible. The Pmp varies by 3.6 W, the Imp varies by 0.2 A and the voltage oscillates between 18.4 and 18.5 V.
From 60.0% to 75.0% shading (Supplementary Figure S4), the impact of shading is very significant. The MPP switches to the right side, the Imp increases drastically from 1.79 to 3.75 A while the Vmp drops from 18.5 to 7.9 V. This is due to the fact that from 60.0% shading onwards, the unshaded part of the module delivers the maximum power.
From 80.0% to 95.0% shading (Supplementary Figure S5), the three electrical parameters Pmp, Imp, and Vmp vary very little. They stabilize around 28.5 W, 3.7 A, and 7.6 V, respectively.
Under partial shading condition (PSC), the PV array presents multiple local maxima (LMs) and only one of them corresponds to the global maximum (GM) (Kitmo et al., 2021). The presence of multiple peaks reduces the efficiency of the MPPT which is not able to distinguish the local from the global maximum (Jung-Min Kwon et al., 2008; Chen et al., 2022), and it is difficult to apply the conventional MPPT (Motahhir et al., 2018; Tchaya et al., 2021).
Effect of Shading on PV Electrical Parameters
To observe the effect of shading on the electrical parameters of the PV module, we firstly applied the variation of shading on the average annual irradiance of the study site to 1,091.21 W/m2, with an average temperature of 30.25°C. The results given in Table 4 and Figure 4 show that the Pmp (Dashtdar et al., 2021) decreases with increasing shading from 0.0% to 60.0%; from 65.0% to 95.0% it is almost constant. Similarly, Imp decreases up to 55.0% shading, but increases and remains almost constant from 60.0% to 95.0% shading. On the other hand, Vmp increases slightly up to 55.0% shading, then drops and remains almost constant from 60.0% to 95.0% shading. We can conclude that from 60.0% shading onwards, the unshaded part of module is the one that provides the panel current. The contribution of the shaded side of the panel is practically zero.
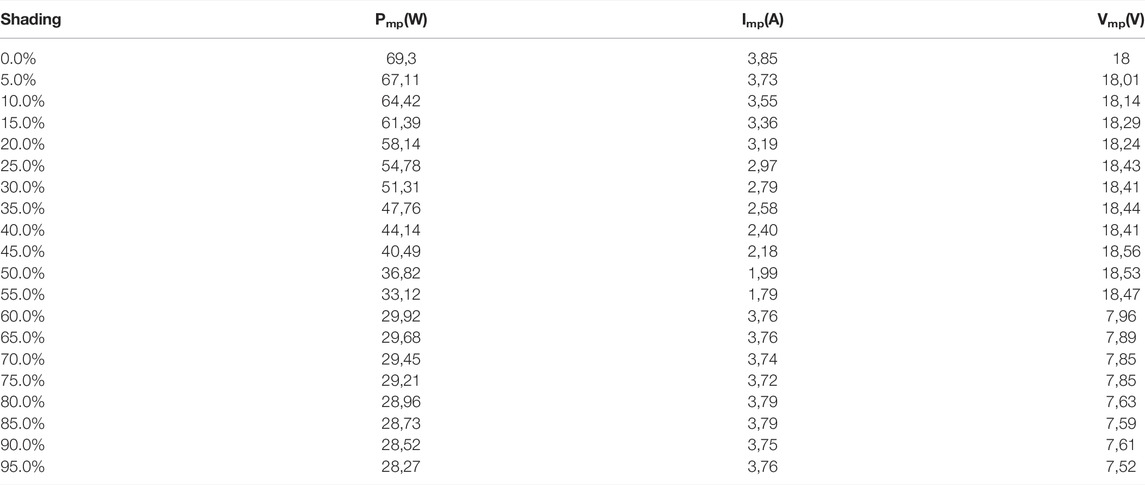
TABLE 4. Annual variation of electrical parameters.
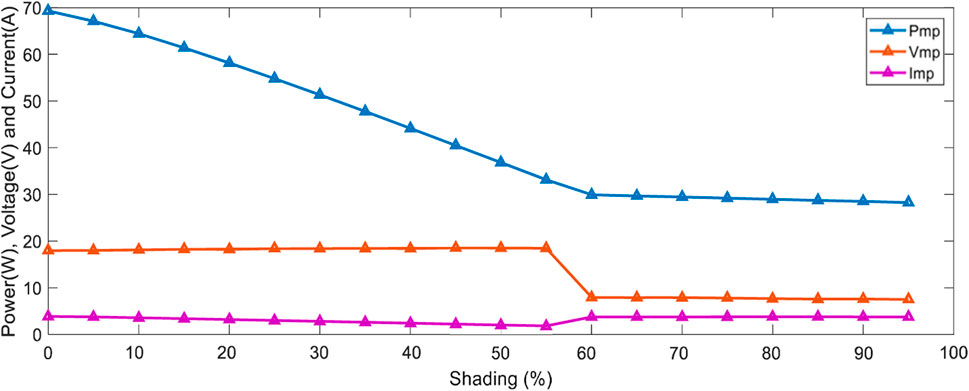
FIGURE 4. Annual variation of electrical parameters (Pmp, Imp, and Vmp).
Comparative Study of the Monthly Evolution of Electrical Parameters With Shading
Tables 4–6 and Figures 5–7 show the evolution of power, current, and voltage at the MPP with the increasing shading rate. According to Table 5, January is the month when the panel produces the least power; this power varies from 46.56 to 19.76 W. The months of March, April and May have almost the same power output, which varies from 85.35–33.9 W. The months of July, October, November, and December have the same power output, which varies from 62.9 to 25.9 W. The months of August and September have a power that varies from 58.5 to 24.3 W. Figure 5 shows that for all the months of the year, the power decreases significantly with the increase of the shading by 5.0%–60.0%. From 65.0% shading, the power decreases slightly.
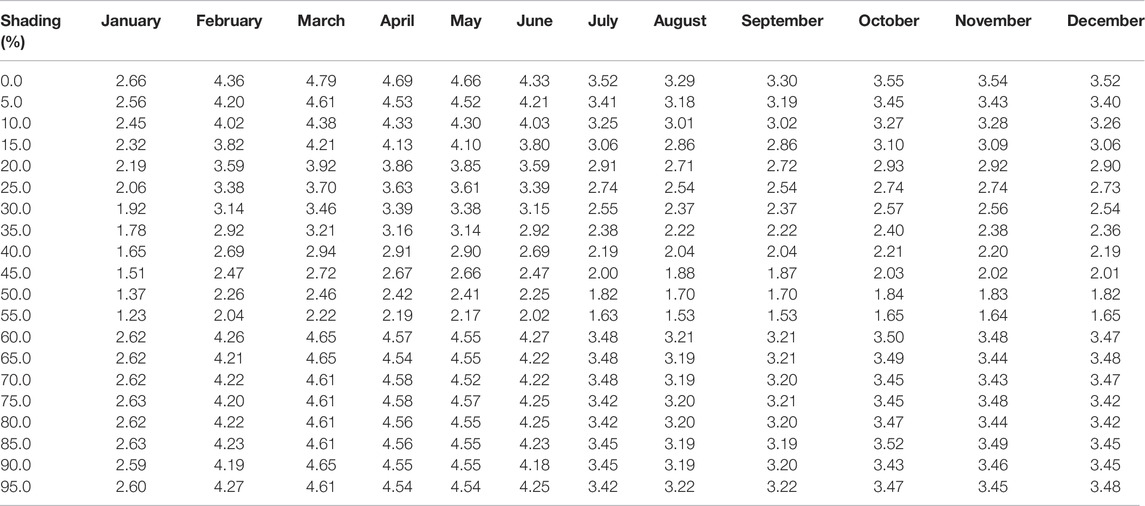
TABLE 5. Monthly Imp with shading.
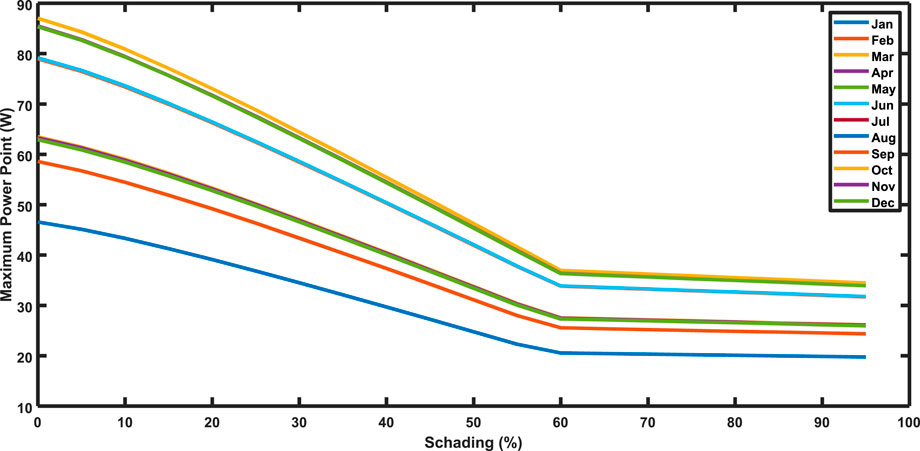
FIGURE 5. Monthly variation of Pmp according to the shading.
The current (Figure 6) decreases significantly up to 55.0% shading. From 60.0% shading, it stabilizes around an average value according to Table 6 (2.6 A for January, 4.2 A for February and June, 4.5 A for March, April, and May, 3.4 A for July, October, November, and December, 3.2 A for August and September).
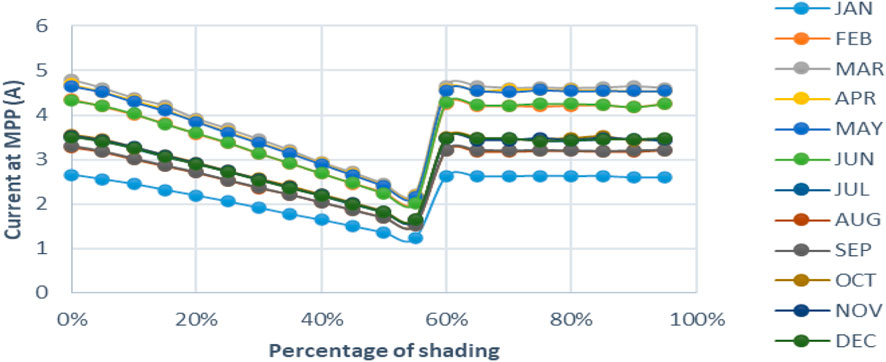
FIGURE 6. Monthly evolution curve of Imp according to the shading.
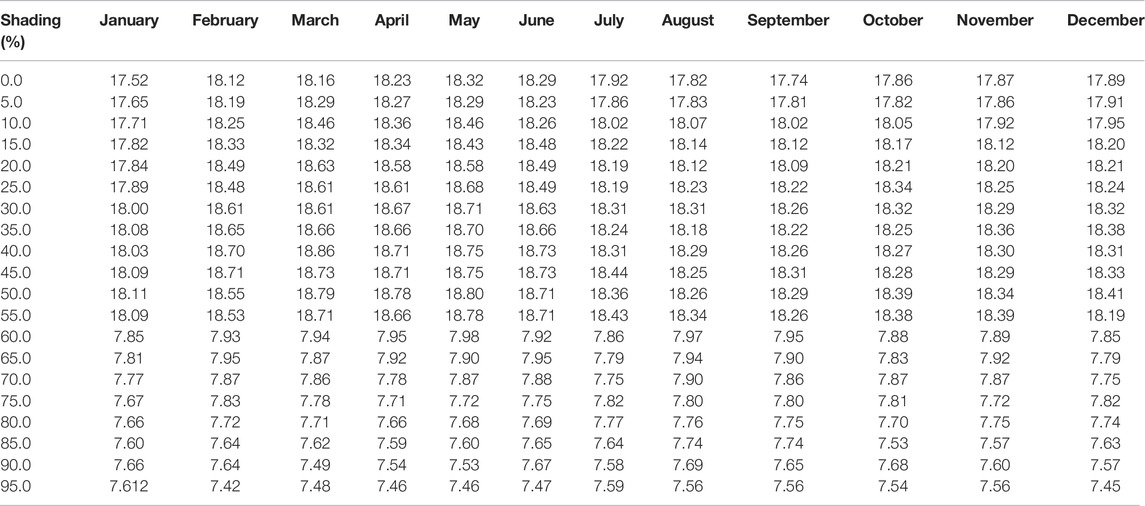
TABLE 6. Monthly Vmp with shading.
Voltage fluctuates around an average of 18 V for all months when the shading rate is between 5.0% and 55.0%. It decreases drastically and stabilizes around an average of 7.5 V between 60.0% and 95.0% shading. The effect of shading (up to 55.0%) is less significant on the voltage. The impact of shading becomes very important on the voltage from 60.0% onwards. However, at this level, shaded PV cells are almost unproductive.
Power, Current and Voltage Losses Assessment, Annual Losses Assessment
According to Table 7 and Figure 8, the power losses vary from 3.16% to 59.21%. They increase significantly up to 60.0% shading. From 65.0% onwards, losses are only slightly observed. Current losses (Jha, 2021) vary from 3.22% to 53.43% when the shading rate is between 5.0% and 55.0%. These losses drop to very low levels from 60.0% shading. This is due to the change in the maximum power point as observed in Supplementary Figures S1–S5. The voltage losses are low and negative between 5.0% and 55.0% shading. As seen in Figure 7, in this shading interval there is a slight increase in voltage. These losses increase drastically from 60.0% shading. The change in MPP due to the fact that the unshaded part alone produces the current would explain this.
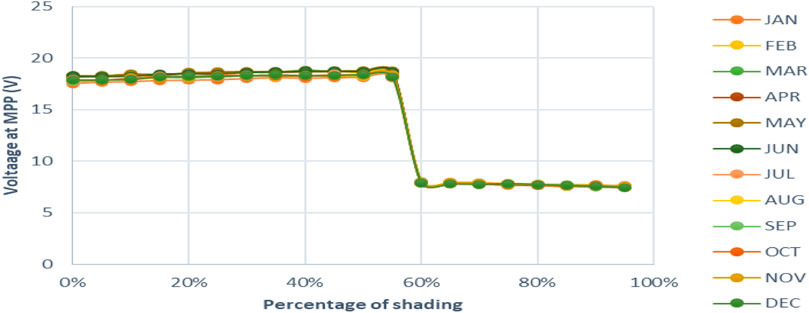
FIGURE 7. Monthly evolution curve of Vmp according to the shading.
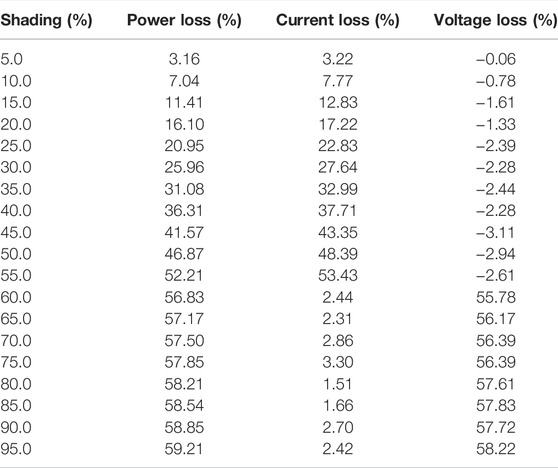
TABLE 7. Annual power, current and voltage losses.
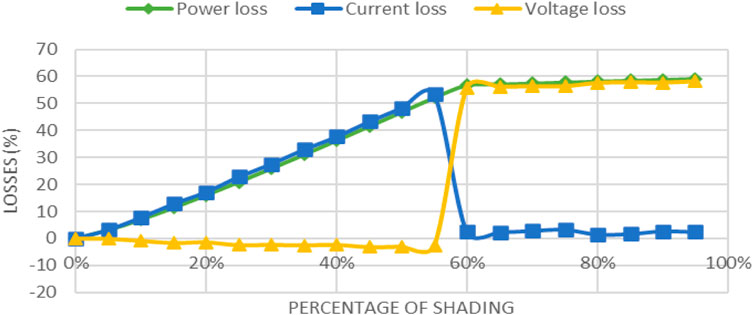
FIGURE 8. Annual power, current and voltage losses curves.
At 25.0%, 50.0%, and 75.0% shading, the power losses are 20.95%, 46.87%, and 57.85%, respectively. These results are close to those of Dadjé et al. (2017b); Anjum et al. (2022); and Meira Amaral da Luz et al. (2022), which are 21.0%, 46.9%, and 56.5%, respectively.
Monthly Losses Evaluation
According to Table 8 and Figure 9, the losses are almost identical and increase significantly (from 3.0% to 52.0%) for all months of the year when shading varies from 5.0% to 55.0%. From 60.0% shading onwards, losses vary very little, and February, March, April, May, and June are the months of the year with the highest losses around 60.0%.
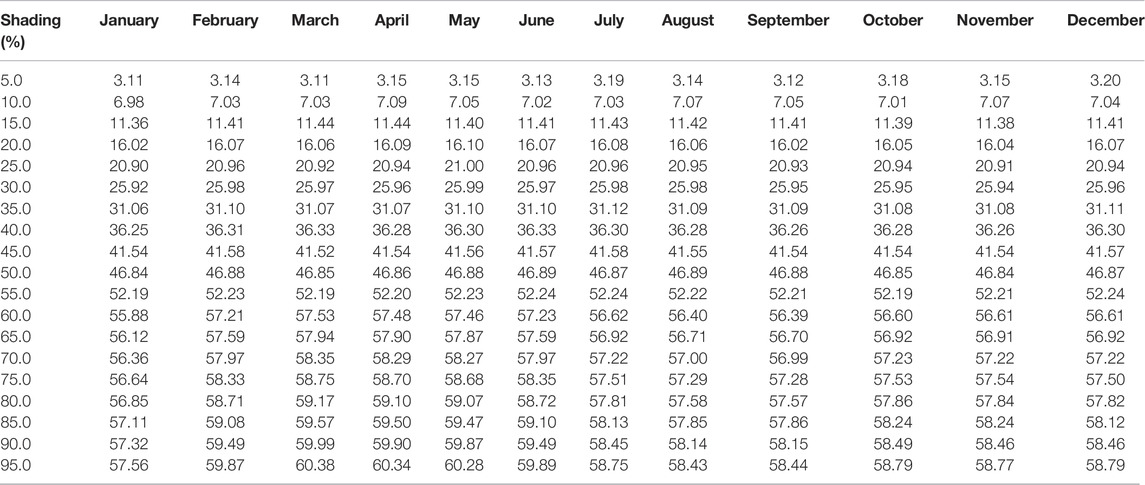
TABLE 8. Monthly power losses (%).
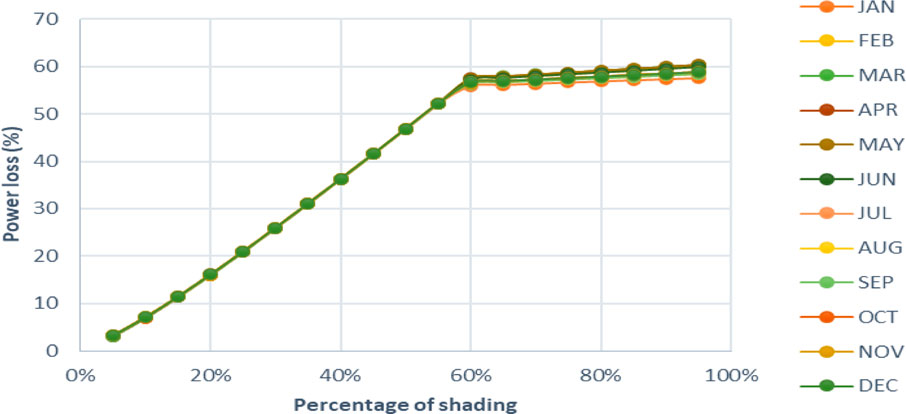
FIGURE 9. Monthly power losses evolution.
According to Table 9 and Figure 10, power losses for all months of the year increase significantly from 3.0% on average to 48.0% in the 5.0%–55.0% shade interval. These losses drop drastically from 60.0% shading and vary from 1.0% to 3.9%.
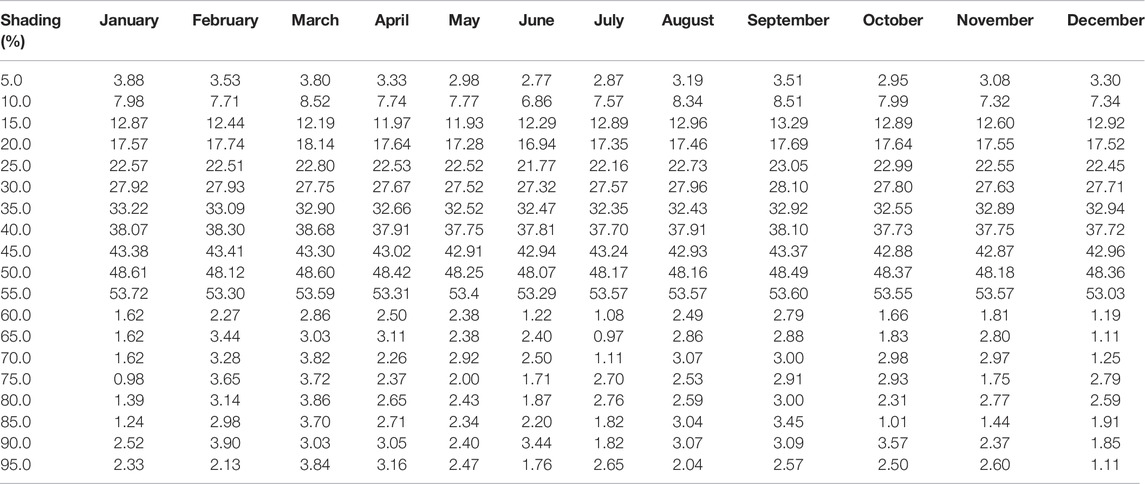
TABLE 9. Monthly current losses (%).
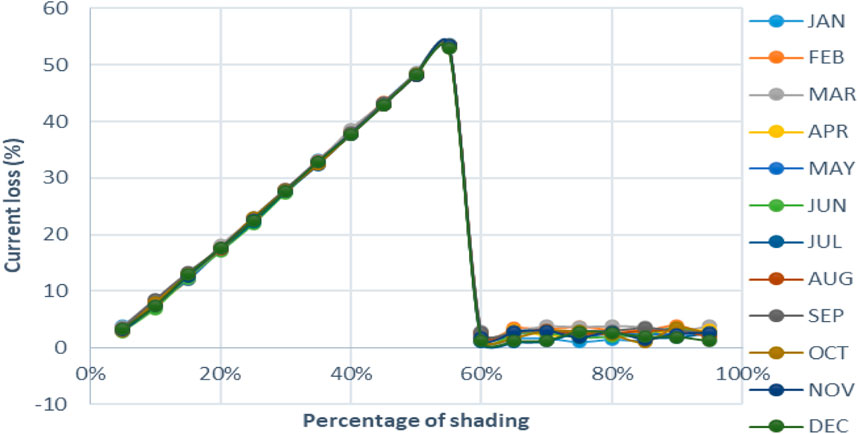
FIGURE 10. Monthly current losses evolution.
Table 10 and Figure 11 show the voltage losses per month. From 5.0% to 55.0% shading, we see that the voltage losses are negative. However, the voltage increases slightly in this shading interval. From 60.0% to 95.0% shading, the losses are estimated to be between 55.0% and 59.0%, which justifies the fact that at these shading levels the panel delivers voltage only on the unshaded side. These losses are almost identical during all months of the year. However, we observe that from 60.0% shading, the losses in January, August, September, October, and November are close to 55.0% while these losses vary from 56.0% to 59.0% during February, March, April, May, June, July, and December.
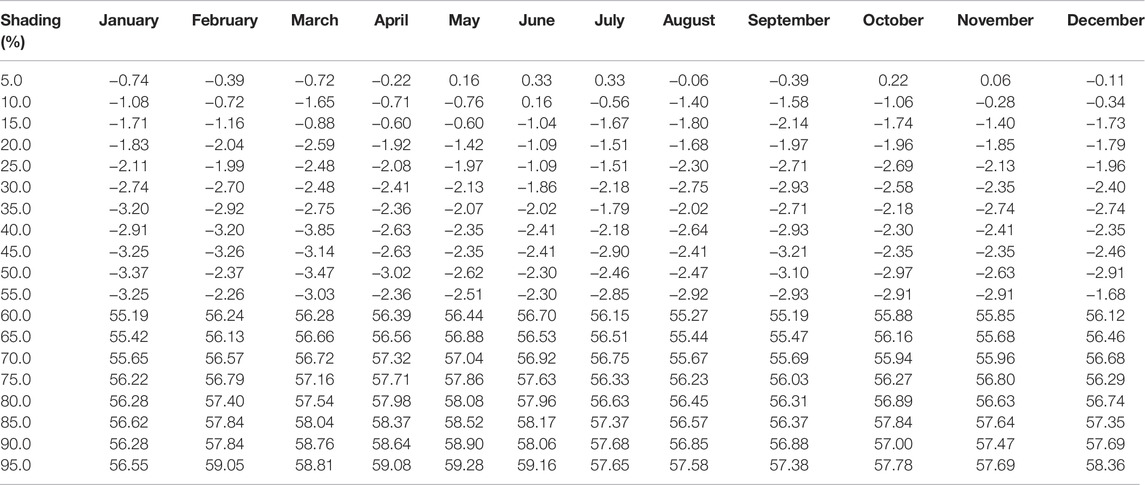
TABLE 10. Monthly voltage losses (%).
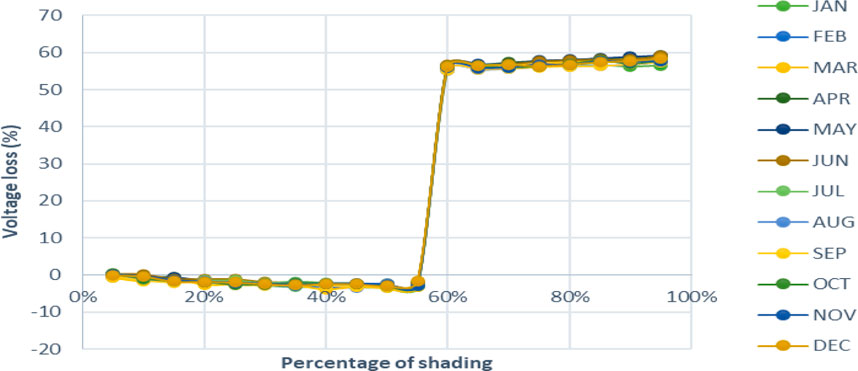
FIGURE 11. Monthly voltage losses evolution.
Conclusion
This work evaluates the impact of partial shading on the performance of a PV module operating in the Sudanese-Sahelian climate conditions of Cameroon. The PV module model was developed in MATLAB Simulink. We varied the shading from 5.0% to 95.0% to observe the effects on the electrical parameters of the module. This approach reveals that the power and current are significantly impacted when the shading rate is between 5.0% and 55.0%. The power and current losses reach 52.0% and 53.0%, respectively. However, the voltage does not drop but increases very slightly. From 60.0% shading to 95.0%, the power losses increase slightly and reach approximately 60.0%. The current losses drop drastically and vary between 1.0% and 3.0% in the 60.0%–95.0% shading range. Significant voltage losses, varying from 55.0% to 59.0%, are observed. This leads us to conclude that power drops at all shading levels, while current and voltage drop inversely in the 5.0%–55.0% and 60.0%–95.0% shading intervals. Also, from 60.0% shading, the unshaded cells are the ones that provide almost all the current and power of the PV module. These results demonstrate the importance of paying attention to partial shading, however small its occurrence. It would be intersecting in future work to observe the behavior of the MPPT at the 40.0%–95.0% shading level, where two points of maximum power appear.
Data Availability Statement
The original contributions presented in the study are included in the article/Supplementary Material; further inquiries can be directed to the corresponding author.
Author Contributions
Y, CW, and KB contributed to conception and design of the study. MB organized the database. K, SK, and ME-N performed the statistical analysis. Y wrote the first draft of the manuscript. Y, MB, SK, and ME-N wrote sections of the manuscript. All authors contributed to manuscript revision, read, and approved the submitted version.
Conflict of Interest
The authors declare that the research was conducted in the absence of any commercial or financial relationships that could be construed as a potential conflict of interest.
Publisher’s Note
All claims expressed in this article are solely those of the authors and do not necessarily represent those of their affiliated organizations, or those of the publisher, the editors and the reviewers. Any product that may be evaluated in this article, or claim that may be made by its manufacturer, is not guaranteed or endorsed by the publisher.
Supplementary Material
The Supplementary Material for this article can be found online at: https://www.frontiersin.org/articles/10.3389/fenrg.2022.924285/full#supplementary-material
References
Alqaisi, Z., and Mahmoud, Y. (2019). Comprehensive Study of Partially Shaded PV Modules with Overlapping Diodes. IEEE Access 7, 172665–172675. doi:10.1109/ACCESS.2019.2956916
Alturki, F. A., and Awwad, E. M. (2021). Sizing and Cost Minimization of Standalone Hybrid WT/PV/Biomass/Pump-Hydro Storage-Based Energy Systems. Energies 14489 14, 489. doi:10.3390/EN14020489
Anjum, S., Mukherjee, V., and Mehta, G. (2022). Modelling and Simulation of AdDoKu Based Reconfiguration Technique to Harvest Maximum Power from Photovoltaic Array under Partial Shading Conditions. Simul. Model. Pract. Theory 115, 102447. doi:10.1016/J.SIMPAT.2021.102447
Balasubramanian, I. R., Ilango Ganesan, S., and Chilakapati, N. (2014). Impact of Partial Shading on the Output Power of PV Systems under Partial Shading Conditions. IET Power Electron. 7, 657–666. doi:10.1049/IET-PEL.2013.0143
Belhaouas, N., Cheikh, M.-S. A., Agathoklis, P., Oularbi, M.-R., Amrouche, B., Sedraoui, K., et al. (2017). PV Array Power Output Maximization under Partial Shading Using New Shifted PV Array Arrangements. Appl. Energy 187, 326–337. doi:10.1016/J.APENERGY.2016.11.038
Bingöl, O., and Özkaya, B. (2018). Analysis and Comparison of Different PV Array Configurations under Partial Shading Conditions. Sol. Energy 160, 336–343. doi:10.1016/J.SOLENER.2017.12.004
Boukenoui, R., Salhi, H., Bradai, R., and Mellit, A. (2016). A New Intelligent MPPT Method for Stand-Alone Photovoltaic Systems Operating under Fast Transient Variations of Shading Patterns. Sol. Energy 124, 124–142. doi:10.1016/J.SOLENER.2015.11.023
Chalh, A., Hammoumi, A. El, Motahhir, S., Ghzizal, A. El, Derouich, A., Masud, M., et al. (2021). Investigation of Partial Shading Scenarios on a Photovoltaic Array’s Characteristics. Electron 2022 11, 96 11–96.
Chen, Y.-K., Hsu, H.-W., Song, C.-C., and Chen, Y.-S. (2022). High-Flexibility MPPT Techniques with Communication Scan Network for PV Micro-grid System. Processes 202210 (117 10), 117. doi:10.3390/PR10010117
Dadjé, A., Djongyang, N., and Tchinda, R. (2017) Evaluation of Electrical Power Losses of Photovoltaic Modules Subjected to Partial Shading Conditions in the Three Climatic Regions of Cameroon 20:179–193.
Dadjé, A., Djongyang, N., and Tchinda, R. (2017). Evaluation of Electrical Power Losses of Photovoltaic Modules Subjected to Partial Shading Conditions in the Three Climatic Regions of Cameroon. Rеvuе Des. Energies Renouvelables 20, 179–193.
Dadjé, A., Djongyang, N., and Tchinda, R. (2017). Electrical Power Losses in a Photovoltaic Solar Cell Operating under Partial Shading Conditions. Jpee 05, 19–33. doi:10.4236/JPEE.2017.510002
Dangi, P., Ojha, A., Singh, S. P., Gawre, S. K., Meshram, S., and Mittal, A. (2022). A Comprehensive Study on Adaptive MPPT Control Tech- Niques for Efficient Power Generation, 513–523. doi:10.1007/978-981-16-5371-1_45
Das, B. K., Hassan, R., Tushar, M. S. H. K., Zaman, F., Hasan, M., and Das, P. (2021). Techno-economic and Environmental Assessment of a Hybrid Renewable Energy System Using Multi-Objective Genetic Algorithm: A Case Study for Remote Island in Bangladesh. Energy Convers. Manag. 230, 113823. doi:10.1016/J.ENCONMAN.2020.113823
Dashtdar, M., Bajaj, M., Hosseinimoghadam, S. M. S., Sami, I., Choudhury, S., Rehman, A. U., et al. (2021). Improving Voltage Profile and Reducing Power Losses Based on Reconfiguration and Optimal Placement of UPQC in the Network by Considering System Reliability Indices. Int. Trans. Electr. Energ Syst. 31, e13120. doi:10.1002/2050-7038.13120
Fetanat, A., and Khorasaninejad, E. (2015). Size Optimization for Hybrid Photovoltaic-Wind Energy System Using Ant Colony Optimization for Continuous Domains Based Integer Programming. Appl. Soft Comput. 31, 196–209. doi:10.1016/j.asoc.2015.02.047
Forcan, M., Durišić, Ž., and Mikulović, J. (2016). An Algorithm for Elimination of Partial Shading Effect Based on a Theory of Reference PV String. Sol. Energy 132, 51–63. doi:10.1016/J.SOLENER.2016.03.003
Fouad, M. M., Shihata, L. A., and Morgan, E. I. (2017). An Integrated Review of Factors Influencing the Perfomance of Photovoltaic Panels. Renew. Sustain. Energy Rev. 80, 1499–1511. doi:10.1016/J.RSER.2017.05.141
Hamed, H., Matthias, P., Bengt, J., Jens, S., Afshin, B., and Waldemar, M. (2019). A Novel Electrical Approach to Protect PV Modules under Various Partial Shading Situations. Sol. Energy 193, 814–819.
Hassan, A., Al-Abdeli, Y. M., Masek, M., and Bass, O. (2022). Optimal Sizing and Energy Scheduling of Grid-Supplemented Solar PV Sys- Tems with Battery Storage: Sensitivity of Reliability and Financial Constraints. Energy 238. doi:10.1016/j.energy.2021.121780
Jaszczur, M., and Hassan, Q. (2020). An Optimisation and Sizing of Photovoltaic System with Supercapacitor for Improving Self-Consumption. Appl. Energy 279, 115776. doi:10.1016/j.apenergy.2020.115776
Jaszczur, M., Hassan, Q., Palej, P., and Abdulateef, J. (2020). Multi-Objective Optimisation of a Micro-grid Hybrid Power System for Household Application. Energy 202, 117738. doi:10.1016/J.ENERGY.2020.117738
Jha, V. (2022). Comprehensive Modeling and Simulation of PV Module and Different PV Array Configurations under Partial Shading Condition. Iran. J. Sci. Technol. Trans. Electr. Eng. 46, 503–535. doi:10.1007/s40998-022-00494-5
Jha, V. (2021). “Performance Analysis of Hybrid Photovoltaic Array Configurations under Randomly Distributed Shading Patterns,” in Proceedings of the 7th International Conference on Advances in Energy Research, Springer Proceedings in Energy (Singapore: Springer), 1287–1296. doi:10.1007/978-981-15-5955-6_123
Jung-Min Kwon, J. M., Bong-Hwan Kwon, B. H., and Kwang-Hee Nam, K. H. (2008). Three-phase Photovoltaic System with Three-Level Boosting MPPT Control. IEEE Trans. Power Electron. 23, 2319–2327. doi:10.1109/TPEL.2008.2001906
Kitmo, D. R., Djidimbélé, R., Kidmo, D. K., Tchaya, G. B., and Djongyang, N. (2021). Optimization of the Power Flow of Photovoltaic Generators in Electrical Networks by MPPT Algorithm and Parallel Active Filters. Energy Rep. 7, 491–505. doi:10.1016/J.EGYR.2021.07.103
Kitmo, , Tchaya, G. B., and Djongyang, N. (2021). Optimization of the Photovoltaic Systems on the North Cameroon Interconnected Electrical Grid. Int. J. Energy Environ. Eng. 13, 305–317. doi:10.1007/S40095-021-00427-8
Kunz, O., Evans, R. J., Juhl, M. K., and Trupke, T. (2020). Understanding Partial Shading Effects in Shingled PV Modules. Sol. Energy 202, 420–428. doi:10.1016/J.SOLENER.2020.03.032
Maleki, A., and Pourfayaz, F. (2015). Optimal Sizing of Autonomous Hybrid Photovoltaic/wind/battery Power System with LPSP Technology by Using Evolutionary Algorithms. Sol. Energy 115, 471–483. doi:10.1016/j.solener.2015.03.004
Mamun, M. A. A., Hasanuzzaman, M., and Selvaraj, J. (2017). Experimental Investigation of the Effect of Partial Shading on Photovoltaic Performance. IET Renew. Power Gener. 11, 912–921. doi:10.1049/IET-RPG.2016.0902
Mehiri, A., Hamid, A.-K., and Almazrouei, S. (20182017). The Effect of Shading with Different PV Array Configurations on the Grid-Connected PV System. Proc. 2017 Int. Renew. Sustain Energy Conf. IRSEC. doi:10.1109/IRSEC.2017.8477420
Meira Amaral da Luz, C., Roberto Ribeiro, E., and Lessa Tofoli, F. (2022). Analysis of the PV-To-PV Architecture with a Bidirectional Buck-Boost Converter under Shading Conditions. Sol. Energy 232, 102–119. doi:10.1016/J.SOLENER.2021.12.028
Mokhtara, C., Negrou, B., Settou, N., Settou, B., and Samy, M. M. (2021). Design Optimization of Off-Grid Hybrid Renewable Energy Systems Considering the Effects of Building Energy Performance and Climate Change: Case Study of Algeria. Energy 219, 119605. doi:10.1016/j.energy.2020.119605
Motahhir, S., El Hammoumi, A., and El Ghzizal, A. (2018). Photovoltaic System with Quantitative Comparative between an Improved MPPT and Existing INC and P&O Methods under Fast Varying of Solar Irradiation. Energy Rep. 4, 341–350. doi:10.1016/J.EGYR.2018.04.003
Mustafa, H., Ahmed, S. A., and Mohammed, Q. T. (2019). Analysis of the Hard and Soft Shading Impact on Photovoltaic Module Performance Using Solar Module Tester. Int. J. Power Electron. Drive Syst. (IJPEDS) 10 (No. 2), 2088–8694. doi:10.11591/ijpeds.v10.i2.1014-1021
Oliver, K., Rhett, J. E., and MattiasJuhl, K. T. T. (2020). Understanding Partial Shading Effects in Shingled PV Modules. Sol. Energy 202, 420–428.
Papul, C., and Sanjeev, K. M. (2019). Determination of the Best Shading Pattern to Maximize the Power of TCT Connected Solar PV Array during Partial Shading Condition. J. Opt. Dec. 48 (4), 499–504. doi:10.1007/s12596-019-00580-8
Pendem, S. R., and Mikkili, S. (2018). Modelling and Performance Assessment of PV Array Topologies under Partial Shading Conditions to Mitigate the Mismatching Power Losses. Sol. Energy 160, 303–321. doi:10.1016/J.SOLENER.2017.12.010
Saiprakash, C., Mohapatra, A., Nayak, B., and Ghatak, S. R. (2021). Analysis of Partial Shading Effect on Energy Output of Different Solar PV Array Configurations. Mater. Today Proc. 39, 1905–1909. doi:10.1016/J.MATPR.2020.08.307
Tchaya, G. B., Djongyang, N., Alphonse, S., and Kaoga, D. K. (2021). Optimization of the Smart Grids Connected Using an Improved P&O MPPT Algorithm and Parallel Active Filters. J. Sol. Energy Res. 6, 814–828. doi:10.22059/JSER.2021.320173.1196
Verma, M., Ghritlahre, H. K., Chaurasiya, P. K., Ahmed, S., and Bajpai, S. (2021). Optimization of Wind Power Plant Sizing and Placement by the Application of Multi-Objective Genetic Algorithm (GA) in Madhya Pradesh, India. Sustain Comput. Inf. Syst. 32. doi:10.1016/j.suscom.2021.100606
Yang, Z., Zhang, N., Wang, J., Liu, Y., and Fu, L. (2022). Improved Non-symmetrical Puzzle Reconfiguration Scheme for Power Loss Reduction in Photovoltaic Systems under Partial Shading Conditions. Sustain. Energy Technol. Assessments 51, 101934. doi:10.1016/J.SETA.2021.101934
Yu, B., Ko, S.-C., and Seok-Cheol, K. (2021). Power Dissipation Analysis of PV Module under Partial Shading. Ijece 11 (No. 2), 1029. doi:10.11591/ijece.v11i2.pp1029-1035
Keywords: PV module, impact, partial shading, performance, Sudano-Sahelian climate
Citation: Yaouba , Bajaj M, Welba C, Bernard K, Kitmo , Kamel S and El-Naggar MF (2022) An Experimental and Case Study on the Evaluation of the Partial Shading Impact on PV Module Performance Operating Under the Sudano-Sahelian Climate of Cameroon. Front. Energy Res. 10:924285. doi: 10.3389/fenrg.2022.924285
Received: 20 April 2022; Accepted: 07 June 2022;
Published: 25 August 2022.
Edited by:
Enrico Maria Vitucci, University of Bologna, ItalyReviewed by:
Godwin Norense Osarumwense Asemota, University of Rwanda, RwandaGhulam Hafeez, University of Engineering and Technology, Mardan, Pakistan
Copyright © 2022 Yaouba, Bajaj, Welba, Bernard, Kitmo, Kamel and El-Naggar. This is an open-access article distributed under the terms of the Creative Commons Attribution License (CC BY). The use, distribution or reproduction in other forums is permitted, provided the original author(s) and the copyright owner(s) are credited and that the original publication in this journal is cited, in accordance with accepted academic practice. No use, distribution or reproduction is permitted which does not comply with these terms.
*Correspondence: Mohamed F. El-Naggar, bWZlbG5hZ2dhckB5YWhvby5jb20=