 Mathewos Hadero
 Baseem Khan*
- Department of Electrical and Computer Engineering, Hawassa University, Hawassa, Ethiopia
The utilization of the electric vehicles increasing day by day. Further, energy grid infrastructure is not modernized enough to supply the growing demand of electric vehicles. Therefore, it is difficult to fully depend on the energy obtained from grid. As a result, integration of renewable energy (solar), grid supply and energy storage is critical. Therefore, the need of renewable energy powered charging facility with adequate controlling is the present day requirement. This paper proposed the development of a direct current (DC) microgrid for electric vehicle charging stations. This work employs a fuzzy logic controller to optimally integrate a DC microgrid. The maximum operating voltage of this DC microgrid charging station is 500 V. Power flow management using a fuzzy logic controller keeps voltage within the expected range with standard voltage deviation. Further, it improves the response time (1.645 ms). Moreover, the operating costs per year of the proposed system are also being investigated.
1 Introduction
According to the International Energy Agency (IEA), internal combustion vehicles accounted for more than 50% of total fuel consumption and 36.3 gigatonnes of carbon emissions in 2020 (IEA, 2021). Unlike vehicles with internal combustion, electric cars do not emit exhaust emissions when in service. As a result, electric vehicles are more environmentally friendly than traditional automobiles. Thus, with the increasing interest in green technologies in transportation, electric vehicles (EVs) have proven to be the best solution to minimize greenhouse gas emissions. As a result, the production of modern, green, and transshipment has accelerated in recent years. In 2021, more than 6.75 million hybrid and all-electric vehicle sales occurred worldwide, which is 108% higher than the previous year (Azimi Nasab et al., 2021).
Plug-in electric cars (PEVs), plug-in hybrid electric vehicles (PHEVs), and fuel cell vehicles are now available commercially. In comparison to traditional cars, they are all possibly not only environmentally green and silent, but also cost-effective in regards to energy rates and operational expenses (Yilmaz and Krein, 2012). Furthermore, electric vehicles are controlled demands that can be used as distributed power storage and generation units to assist grid power in vehicle to grid (V2G) or vehicle to building (V2B) applications (Yang et al., 2016; AL-Dhaifallah et al., 2021), as well as spinning reserves in some cases. However, the lack of adequate charging infrastructure is a major barrier. For the practical operation of EVs, one of the key important and fundamental elements is charging infrastructure. An EV charging station is a component of a system that provides electricity for the recharging of PEVs, such as electric vehicles, community electric vehicles, and PHEVs (Aboelsaud et al., 2022).
Based on the charging duration and manner, the charging system can be classified as either a slow charger or a rapid charger. The slow charger provides around 3–4 kW of electricity to the EV and takes nearly 6–7 h to fully charge. As a result, the slow charger is suitable for recharging at night, utilizing a domestic alternating current (AC) supply. The fast charger, on the other hand, delivers around 50 kW of power to the EV via the charging station, and the recharging period is less than 0.5 h (Gandoman et al., 2021). Many EVs contain an onboard charger that employs a rectifier circuit to convert utility AC power from the grid to direct current (DC) suited to charging the EV’s battery pack. Because the rectifier’s capacity is limited by cost and temperature, it is advisable to use an external charging station to feed DC to the batteries once the voltage reaches 240 V AC and 75 A (Duan et al., 2021). Dedicated chargers can be erected in fixed places and integrated into the network with high-current connectors for rapid charging. The charger’s DC output has no effective limit in this configuration, either theoretically or practically. A DC fast charge (DCFC) or DC rapid charge (DCQC) is a high-voltage, high-current charging method (Patnaik Narasipuram and Mopidevi, 2021). Several industrialized nations have participated in the creation of the fast charger. But, as the charging station grows in size, it has begun to have a detrimental impact on the system’s power quality. Voltage distortions and current harmonics are common manifestations of these detrimental impacts; power quality problems, especially a low power factor, have long been an issue in several nations (Amin et al., 2021).
Vehicles are the key transportation facilities in Ethiopia (no traction facilities) for both long distances and in cities. Therefore, for Ethiopia, the need to shift from combustion engine cars to EVs is an ideal choice. Currently, a small number of EVs have started providing service in Ethiopia. However, there has been no attention given to charging stations yet. Especially in the near future, as the number of EVs increases, the question of charging stations will be clearer. So, this work is to design and simulate a DC-micro grid for the charging stations of EVs in Ethiopia, in particular in Hawassa city. As it is clearly known, the Ethiopian electricity grid infrastructure is not yet matured and modernized to support the stress generated on the grid system in the near future by EVs. As a result, the author uses renewable energy sources (solar energy) with the grid and batteries since the nation is naturally endowed with plentiful renewable energy sources of power. The interfacing of utility network and renewable energy sources (RES) for EV charging stations can reduce grid stress generated by the concurrent charging of many vehicles while also avoiding the uncertainty induced by renewable energy’s intermittent character. In particular, the integration of grid-renewable energy sources (solar energy) based on the country’s perspective is highly essential. Further, due to the depletion of oil resources and the environmental effects connected with its usage, the number of electric vehicles on the market is predicted to grow tremendously in the coming years. As a result, many countries have encouraged investment in the development and use of electric vehicles. Ethiopia is one of the countries that has started to show its interest in EV investment to overcome the rise in oil prices and also environmental pollution. Even so, for nations such as Ethiopia, where the electric grid is not as developed as in industrialized nations, among the most pressing problems in EV development is a lack of charging stations that can endure the country’s energy fluctuations and high electrical load, as well as the grid’s effect. Incorporating hybrid RES with EVs and the power grid is certainly a potential solution for addressing these issues. Integration of grid and RES for EV charging stations can reduce grid stress generated by concurrent charging of many vehicles while also avoiding uncertainty induced by renewable energy’s intermittent character. As a result, a charging station has been designed that may be utilized to charge electric vehicles in Ethiopia.
1.1 Related Work
With the widespread adoption of RES and electric vehicles (EVs) on an international market, the integration of the transport and energy industries is a relatively young and promising study subject. This section examines the current research on the advancement of electric vehicles and the building of RE-based charging stations. Solar-powered charging stations, according to (Goldin et al., 2014), might greatly reduce the impact of EV recharging on the power network. In (Balasundar et al., 2021), the design of a power quality enhanced sustainable bidirectional electric vehicle charging station in the distribution grid is presented. In (Li et al., 2022), a robust model of electric vehicle charging station location considering renewable energy and storage equipment is presented. In (Fescioglu-Unver et al., 2021), a feedback-controlled resource management model for express service in electric vehicle charging stations is presented. In (Kakillioglu et al., 2022), a self-controlling resource management model for electric vehicle fast charging stations with priority service is presented. In (Mehrjerdi, 2020), dynamic and multi-stage capacity expansion planning in a microgrid integrated with an electric vehicle charging station is presented. In (Li n et al., 2021), shunt capacitor allocation by considering electric vehicle charging stations and distributed generators based on an optimization algorithm is presented. In (Bastida-Molina et al., 2021), multi-criteria power generation planning and experimental verification of hybrid renewable energy systems for fast electric vehicle charging stations are presented. Ref. (Quddus et al., 2021). performs a reliable electric vehicle charging station expansion under uncertainty. In (Mehrjerdi and Hemmati, 2019), an electric vehicle charging station with multilevel charging infrastructure and hybrid solar-battery-diesel generation incorporating comfort for drivers is presented. In (Ahmad et al., 2021), an enhanced approach to optimally placing the solar-powered electric vehicle charging station in the distribution network is presented.
1.2 Contribution of the Manuscript
The work primarily focuses on the optimal charging and development of DC-micro grid integrated charging station. This research designs and simulates the DC micro-grids for EV charging stations while at the same time reducing the impact of electric vehicles on the distribution grid by using solar photovoltaic (PV) systems and battery storage. But the nature of the Solar System is uncertain and the availability of vehicles is also uncertain, which means we cannot determine both of them. A fuzzy logic controller is important to manage power flow in this system because it makes human-like decisions depending on the inputs and rules given. The main contributions of this work are summarized as follows:
1. Integration of a PV system and battery energy storage with the grid via a fuzzy logic controller for scheduling of charging stations
2. Analyze and estimate the charging station’s operating cost.
3. Development of DC micro-grid integrated EV charging station
4. Optimal charging control of power flow is performed with fuzzy logic controller
5. The proposed controller improves and controls the bus voltage within an expected region.
1.3 Organization
The rest of the manuscript is organized as follows. Section two discussed the research methodology, utilized in this research. Section three presented the results obtained and their descriptions, which is followed by the conclusion.
2 Methodology
This section discussed the methodology utilized in this research. The description of study area and its solar energy resource assessment are presented in this section. The developed DC micro-grid, EV charging station and its optimal charging technique are also discussed.
2.1 Study Area
The study area is located in the Ethiopian South Nation Nationalities and People Region (SNNPR) city of Hawassa. This city is one of the big cities in Ethiopia. It is located 273 km south of the national capital, Addis Ababa. The temperature varies from 5°C in the winter to 34°C in the summer. The city experiences a sub-humid type of climate, having an average annual temperature of about 19.4°C and a mean annual precipitation of 933.4 mm, with rainfall of twice a year.
2.2 Solar Potential of Study Area
The studied city Hawassa located at the Latitude of 7°3′N and Longitude of 38°28′E and at Elevation of 1708 m. The sunshine duration, temperature, wind speed, and humidity data were taken from the national meteorological agency, Hawassa branch. Among the several models defining solar radiation and sunshine hour, in order to estimate the solar radiation from the recorded sunlight hour, the single diode model is utilized. The latitude and longitude of Hawassa city were utilized to acquire Sun irradiation data from the NASA webpage. Figure 1 shows the global horizontal radiation of Hawassa.
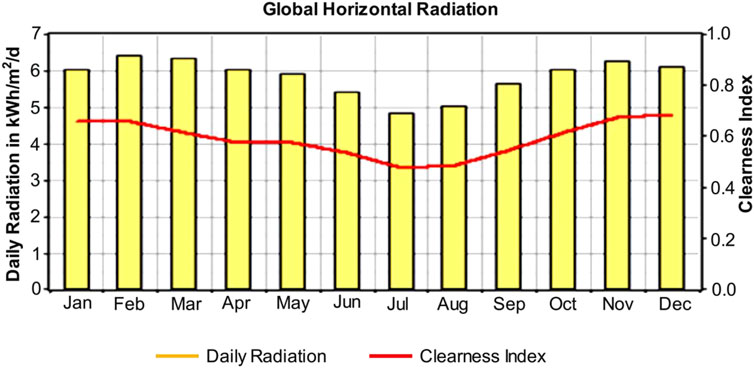
FIGURE 1. Global horizontal radiation of Hawassa.
2.3 DC-Micro Grid System and EV Charging Station
The proposed DC-micro grid includes a renewable energy component (solar PV), a grid, and a battery. The integration of the system is simulated using MATLAB and Simulink. For that purpose, a fuzzy logic controller is utilized.
The varied inputs, which are described by fuzzy sets, must be considered when designing the fuzzy rule base. A membership function is used to describe the fuzzy sets. The triangular membership function is employed in this paper. Due to the ambiguity and time-varying nature of the Sun and automobile accessibility, the loading of the electric vehicle and the electricity provided by the solar PV system are both unpredictable and fuzzy under normal conditions. The input variable is fuzzified before being calculated using fuzzy rules and logic functions.
2.3.1 Design of Micro-grid System for Charging Station
PEV chargers may be integrated into a Solar System using a variety of approaches. There are a variety of power electronic architectures for photovoltaic charging facilities (PCFs), depending on the kind and quantity of converters. Some are categorized as centralized systems, while others are classified as distributed architectures.
For this study, an inverter was developed on the opposite side of the DC bus in order to distribute surplus power from the DC microgrid to nearby consumers or back to the distribution network. This is due to the fact that if a single malfunction or damage occurs in a bidirectional inverter, the system will be unable to draw power from or transmit electricity to the grid. The DC bus is linked to the bidirectional DC/DC battery chargers. Because PEVs may be charged from the grid during seasons of low insolation or gloomy weather, it is more dependable. It is also worth noting that the additional energy generated by PV may be put into the grid and utilized to offset PV expenditures. To handle the high demand of PEVs, a PCF requires consistent power from PV or the grid. An energy storage device, such as a battery bank, can increase the dependability of a PCF. As a result, the research’s recommended design is a distributed architecture. Figure 2 shows the DC micro-grid for the EV charging system.
A. Power Grid
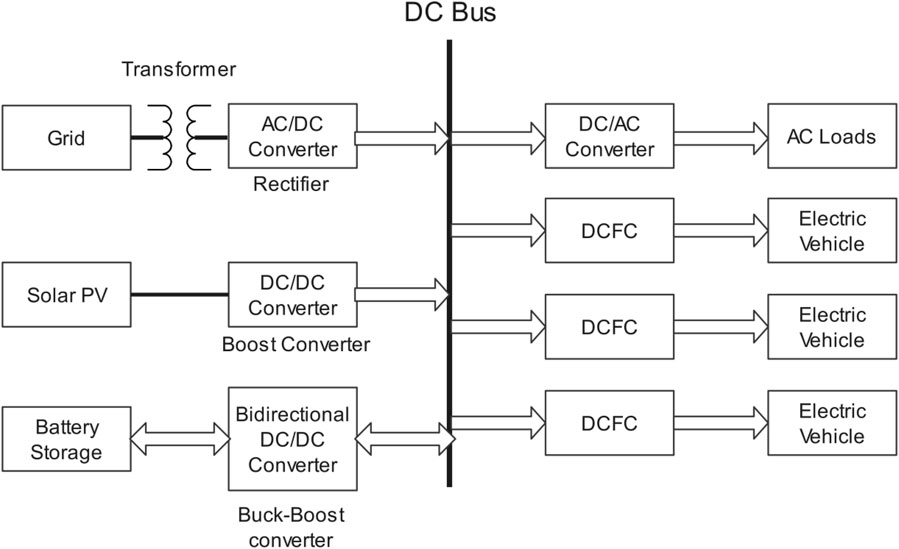
FIGURE 2. DC micro-grid for EV charging system.
The grid is a system of interconnected production and consumption hubs whose primary role is to transfer electricity from where it is produced to where it is used. By rectifying (via an AC–DC converter), we can utilize the grid for DC loads, and by inverting (through a DC–AC converter), we can transmit electricity from DC sources to the grid.
B. Solar PV System
The equivalent circuit of a general PV model consists of a photo-current, a diode, a shunt resistor Rsh, and a series resistor (Rs). The voltage current characteristic of a solar cell is given as (Goldin et al., 2014),
The photocurrent is explained as,
The saturation current is represented as,
The open-circuit voltage, Voc and short-circuit current, Isc are the two most important parameters. Generally,
The reverse saturation current can be acquired as,
There is no series loss and no leakage to ground for an ideal PV cell, so equation can be rewritten as:
1. PV Panel Selection and Array Sizing
The module efficiency and the cost are the basic criteria used for the module selection. The average energy consumption of electric vehicles is set at 0.2 kWh/km (Goldin et al., 2014). For this research, considering the different types of vehicles arriving at charging stations, the author divided the vehicles ideally by their battery capacities of 10 kWh, 20 kWh, 30 kWh, 40 kWh, 50 kWh, and 60 kWh. For this research work, as the charging station will serve three vehicles at once, this will fully charge one vehicle in 30 min. To reduce grid impact, the system is designed to cover the entire load from the photovoltaic power source. Based on the resource availability and capacity of energy extracted from solar PV sources, storage batteries and the grid are included as support. The energy requirement of the system will vary from 0 to 180 kWh, which means 0–360 kW load requirement. As a result, the study set the peak load at 400 kW.
2. Computed system parameters
Table 1 presented the PV module parameters computed in this work.
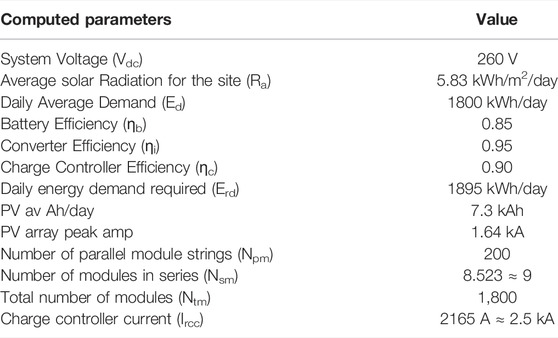
TABLE 1. Computed PV module parameters.
C. Battery Bank selection and sizing
By selection and sizing of the battery following parameters are obtained and presented in Table 2.

TABLE 2. Computed battery parameters.
2.3.2 Interfacing of Energy Source With Charging Station
This section discussed the interfacing of the various energy sources with EV charging station.
A. Boost Converter for solar PV
The outputs of the boost converters are connected to a common DC bus of 500 V (Aboelsaud et al., 2022).
1. Modeling AC-DC converter
The unit maintains a stable state after a transitory period of around 50 milliseconds. A 6-pulse, 3-level bridge rectifies the 400 V, 50 Hz voltage received in the secondary of the Wye/Delta transformer. The DC voltage obtained from the rectifier is filtered using an LC filter and given to a DC bus of 500Vdc. The LC filter filters the harmonics developed by the inverter at multiples of the 2 kHz carrier frequency.
2. Modeling DC-AC converter
The filtered DC power is sent to a two-level IGBT inverter that generates 50 Hz. Pulse Width Modulation (PWM) with a carrier frequency of 2 kHz is used by the IGBT inverter. A PI controller uses abc to dq and dq to abc transformations to keep the demand voltage at 1pu (380Vrms). The voltage regulator’s first output is a vector comprising the three modulating signals that the PWM generator uses to create the six IGBT pulses. The modulation index is returned by the second output. The multi-meter block is used to measure the currents of diodes and IGBTs.
3. Filter
For this work single tuned filter is utilized and its components are computed as follows:
where, Q is reactive power to be generated by the filter at fundamental frequency, V is voltage at which filters are to be installed, f is fundamental frequency and fr is Tuning frequency.
The odd harmonics generated due to the inverter at multiples of 2 kHz carrier frequency before filtering was 74.59% and it is filtered by using the LC filter. Figure 3 shows the harmonic distortion before filtering.
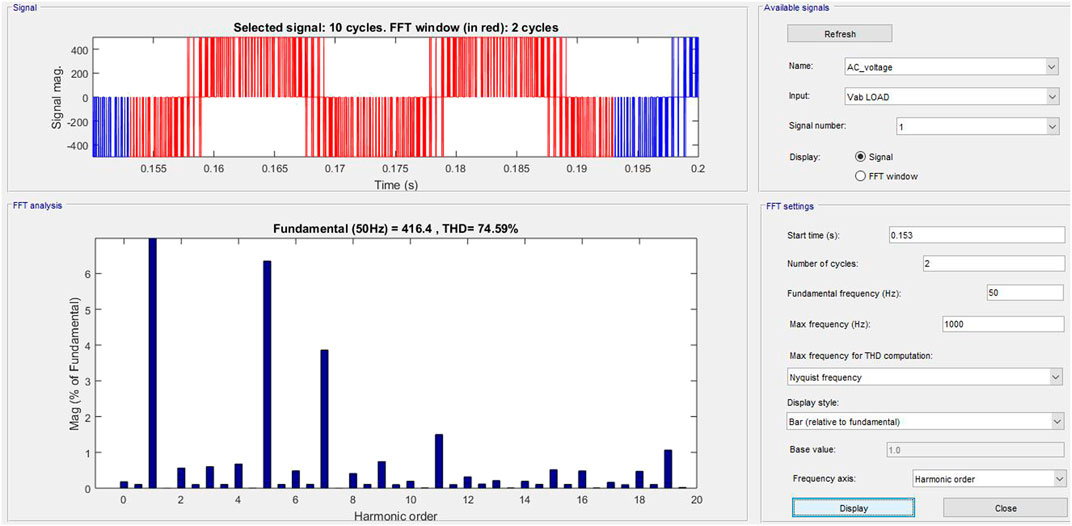
FIGURE 3. Harmonic distortion before filtering.
The harmonics generated by the inverter at multiples of the 2 kHz carrier frequency are filtered by the LC filter. Notice harmonics around multiples of the 2 kHz carrier frequency. After filtering, the harmonics are reduced to an acceptable region. Accepted total harmonic distortion (THD) is below 3%, and the reduced THD in this system is 2.21%. Figure 4 presents the total harmonic distortion after filtering.
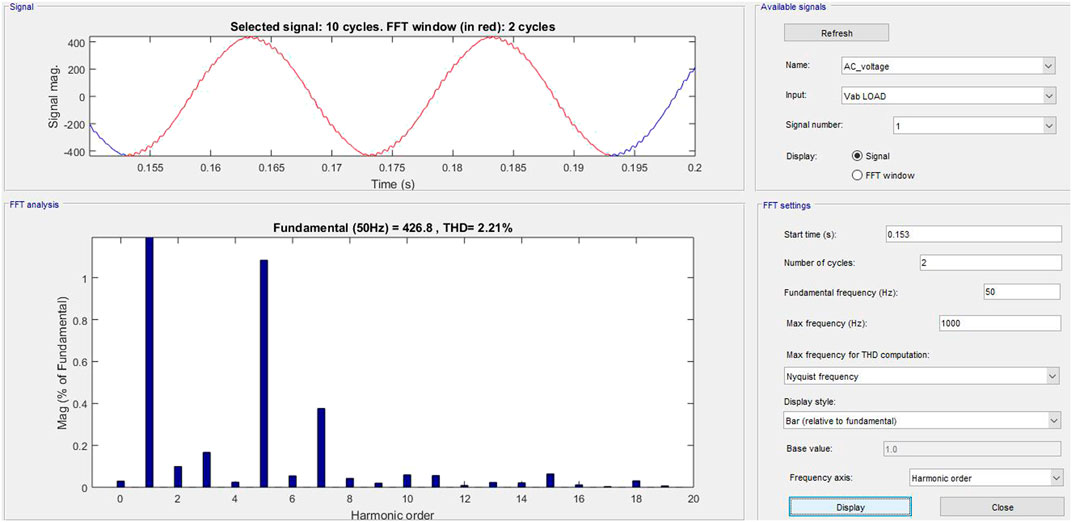
FIGURE 4. Total harmonic distortion after filtering.
4. Charging and discharging model of lithium-ion battery
For the EV storage purpose, a 15.5 Ah lithium-ion (Li-ion) battery with a rated voltage of 3.7 V was used. The charging and discharging models of the Li-ion battery were developed using the improved Shepherd model equation. This battery type, on the other hand, is supposed to be used at room temperature.
where, VB_disch is the voltage at battery discharge, VB_ch is the voltage at battery charge, E0 is the constant voltage (V), R is the internal resistance (
The State of Charge (SOC) for a fully charged battery is 100% and for an empty battery’s 0%. The SOC is calculated as:
5. Bidirectional DC-DC converter model for battery
The DC bus voltage is 500Vdc therefore DC-DC bidirectional converter (i.e. buck boost converter) is needed to reduce 500 V bus voltages to 100 V for battery bank.
2.3.3 Power Flow Management
There are two kinds of endpoints that interface with the DC bus: power terminals and slack terminals. Power terminals denote resources that provide or consume power to/from the DC bus based on their own capabilities and do not normally influence the bus’s operating potential. Power terminal supplies include DC loads and PV panels operating in MPPT mode. The purpose of a slack terminal is to accept power fluctuations generated by power terminals while maintaining power balance and steady voltage. Slack terminals are commonly seen in battery energy storage systems (BESS) in voltage-controlled mode with VSCs (Aboelsaud et al., 2022). Considering this voltage variation limits the operating range of DC bus voltage, it is divided into five regions. Figure 5 presents the operation regions of DC bus voltage. Here, nominal voltage of the DC bus (Vdcn) is 500Vdc, upper limit of the allowable Voltage of the DC microgrid (VH2) is 520Vdc, lower limit of the allowable Voltage of the DC microgrid (VL2) is 480Vdc, the point at which battery charging activated (VH1) is 510Vdc, and the point at which battery discharging activated (VL1) is 490Vdc.
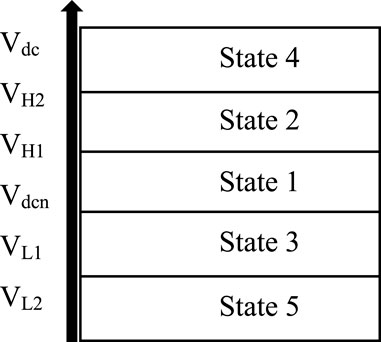
FIGURE 5. Operation regions of DC bus voltage.
A. Stand-Alone Operation
State 1: VL1 ≤ Vdcn ≤ VH1
The BESS is critical in maintaining the microgrid’s power dynamics. State 1: VL1 ≤ Vdcn ≤ VH1.
To prevent frequent battery charging and discharging, the BESS runs in a passive state. The demand was regulated by the PV generation. The bus potential varies within state 1 due to the absence of a slack terminal, correlating to changes in demand and PV generation.
State 2: VH1 ≤Vdcn ≤ VH2
The bus voltage goes up and down in area 2 whenever the PV energy produced exceeds the demand. To store surplus power and control the bus’s potential, the batteries begin charging. The batteries are no longer able to control the bus potential when the BESS is recharged (SOC = SOCH), so the VSC is actuated to transfer the system to grid-connected mode.
State 3: VL2 ≤Vdcn ≤ VL1
The bus’s potential drops when there is a power shortage in the network. BESS is discharged to make up for the system’s lack of power. When the cells achieve their maximum discharge rate (SOCL), the VSC is shifted from idle to control voltage mode at VL2, and the scheme becomes grid-integrated. When the DC micro-grid is operating in areas 2 or 3, BESS can store and compensate for surplus or deficit power using DC–DC converters.
B. Grid-Connected Mode
Over or under voltage could happen in the event of an unforeseen loss of demand or PV unit. And the voltage will be outside of the permitted range. The system would become unstable as a result of this. The DC microgrid must be switched to grid-integrated mode to prevent itself from entering into these abnormal situations.
State 4 (Vdc > VH2) or State 5 (Vdc < VL2)
The VSC is engaged whenever the bus potential exceeds VH2 or VL2 levels. Only the AC grid acts as a slack terminal to regulate the DC bus potential.
2.3.4 Charge Controller of Battery Storage
Charge controllers are used to regulate the flow of current to and from batteries in a micro-grid (Mehrjerdi and Hemmati, 2019). They are essential to protect the batteries and regulate the DC bus voltage. In the proposed DC micro-grid, a charge controller will control a bidirectional converter, lowering the PV to zero.
The charge controller will activate the bidirectional converter to send the power from the batteries to the micro-grid. In a DC micro-grid, the suggested fuzzy controller checks if the batteries are between 20 and 90 percent charged, and if they are, the batteries will either recharge, discharge, or sit idle based on the power equilibrium between sources and demands. Figure 6 presents the proposed controlling method, which is dependent on the State of charge (SOC) and bus voltage, to maintain the safe and optimal functioning of BESS.
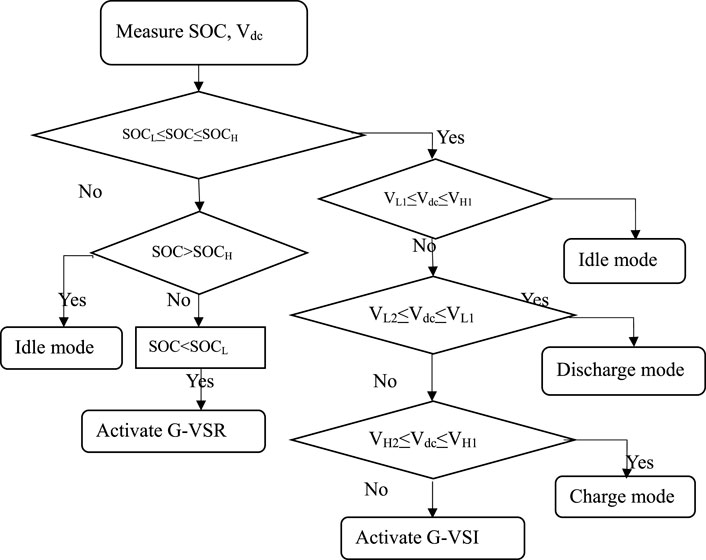
FIGURE 6. Flow chart for Power management using fuzzy logic controller.
In Figure 6, SOC is the state of charge of the battery, SOCL is the lower state of charge (20%), SOCH is the higher state of charge (90%), Vdc is the available DC bus voltage, VL1 is low bus voltage level 1 (490 V), VL2 is lower bus voltage level 2 (480 V), VH1 is high bus voltage level 1 (510 V), and VH2 is higher bus voltage level 2 (520 V). Idle mode means doing nothing. Continuing as it is, charging mode means the battery is activated to charge. Discharging mode means the battery has started to discharge. Activating G-VSR means activating the grid voltage source in rectifier mode, and activating G-VSI means activating the grid voltage source in inverter mode.
2.3.5 System Description
A model in MATLAB/Simulink was used to test the functioning of the developed DC microgrid and controlling method under the specifications presented in Table 3.
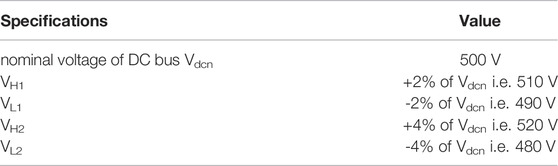
TABLE 3. Specifications of the system.
2.3.6 Fuzzy Logic-Based Energy Management Rules
The bus potential is used as the input parameter in this fuzzy logic energy management approach. As per the architecture of the linked energy network, the solar output is 400 kW, and it works as an accessible device and sends the generated energy to the DC Bus. The battery’s SOC ranges from 0 to 100%. The battery’s SOC is regulated within 0.2 and 0.9 to avoid it being completely recharged or drained. The fuzzy collection of each variable is established using fuzzy statistical methods, and the appropriate membership functions may be derived. For the input variable, depending on DC bus load conditions, the bus voltage level is divided into five fuzzy sets: very low (VL), low (L), just right (J), high (H), and very high (VH). The output variables for battery status are fuzzified into three fuzzy sets: charging (C), idle (I) and discharging (D), and grid status is also fuzzified into three fuzzy sets: rectifier mode (send) (R), OFF mode (O), and inverter mode (receive) (I). A total of five fuzzy rules are established, which are described as follows:
1. If (Vpv is JR), then (Boff is OFF) (BD is OFF) (Ginverter is OFF) (Grect is OFF) (BC is OFF) (1)
2. If (Vpv is L), then (Boff is ON) (BD is ON) (Ginverter is OFF) (Grect is OFF) (BC is OFF) (1)
3. If (Vpv is VL), then (Boff is OFF) (BD is OFF) (Ginverter is OFF) (Grect is ON) (BC is OFF) (1)
4. If (Vpv is H), then (Boff is ON) (BD is OFF) (Ginverter is OFF) (Grect is OFF) (BC is ON) (1)
5. If (Vpv is VH), then (Boff is ON) (BD is OFF) (Ginverter is ON) (Grect is OFF) (BC is ON) (1)
Figure 7 presents the surface view of the grid status. This result shows that grid status is in off mode when bus voltage is between 480 and 520 V. In this region, the load is served by solar PV systems and BESS. When the bus voltage is between 490 and 510 V, PV only supplies demand. When the bus voltage is between 490 and 480 V, the batteries are changed to discharging mode. The batteries are switched to charging mode when the bus voltage is between 510 and 520 V. When the bus voltage is below 480 V, the grid is switched into rectifier mode and sends power to the DC bus through the rectifier to serve the loads. When the DC bus voltage is above 520 V, the grid is switched into the inverter mode and receives excess power from the DC bus. This result shows that the grid status is positive when supplying around 300 kW of power to the EV and negative when receiving around 300 kW for this simulation case. Figure 8 presents the surface view of the battery status.
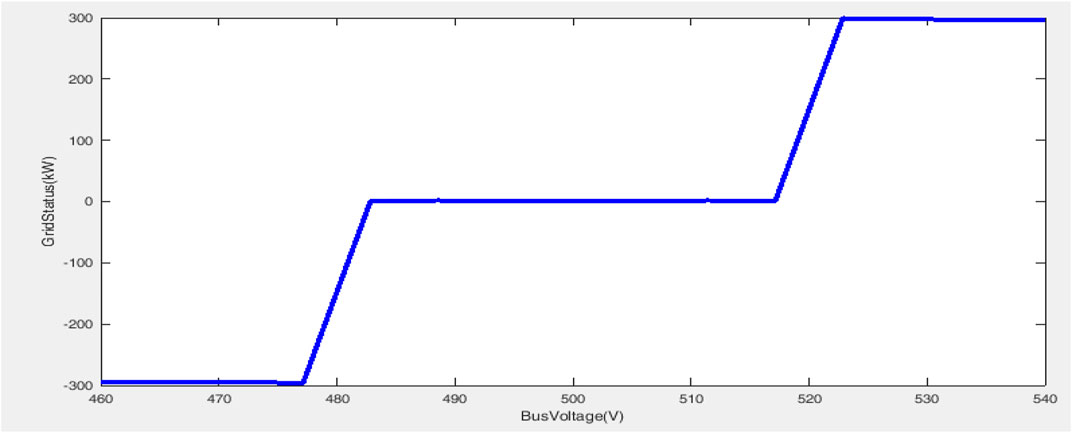
FIGURE 7. Surface view of Grid Status.
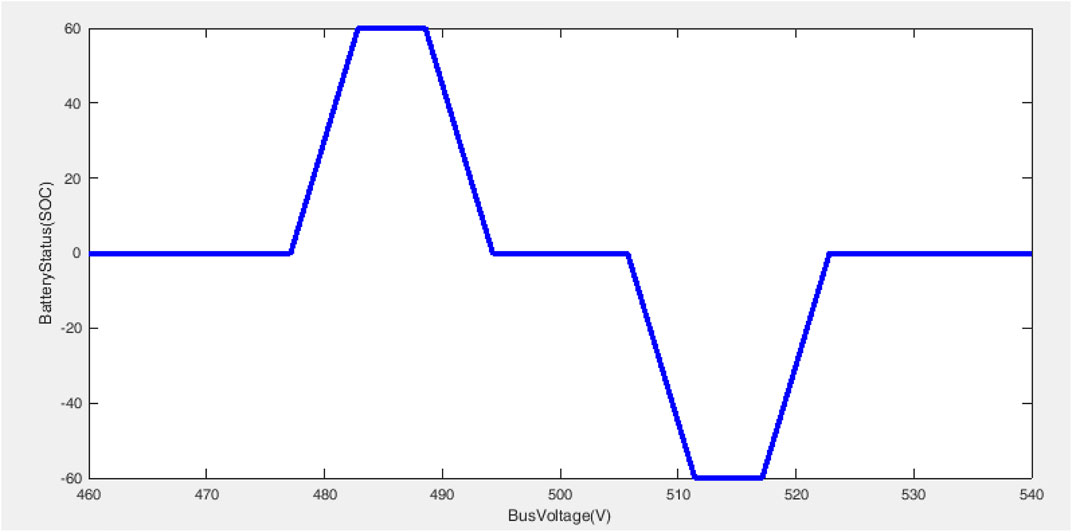
FIGURE 8. Surface view of Battery Status.
This result shows that the battery is in charging mode when SOC shows a negative value, and at 0 (zero), it is in idle mode to control the continuous charge and discharge of the battery when the load is fully served by the PV system only. When the SOC value is positive, the battery is in discharging mode, supplying additional energy to the PV system as needed by loads.
The system will charge vehicles continuously depending on the bus voltage level, followed by a fuzzy logic controller from three sources: the solar PV system, battery, and grid. The system will send excess power to the grid when there are no electric vehicles to be charged. The amount of power from a solar PV system is around 400 kW, and the amount of energy from a battery storage system is 250 kWh. Table 4 presents the system rules of the fuzzy logic controller.
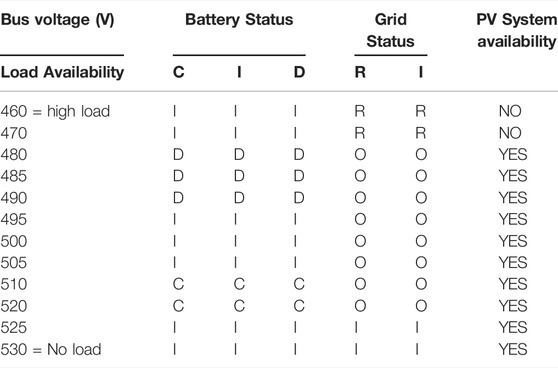
TABLE 4. System rule of fuzzy logic controller.
Here, C represents battery charging, I represents battery idle, D is battery discharging, R is the grid is in rectifier mode (sending to the bus), and I is the grid in inverter mode (receiving from the bus), and O means the grid is not connected.
3 Results and Discussion
This section contains the simulation results of the study. The first section is concerned with the modeling and simulation of a DC micro-grid for an electric car charging station with power flow management utilizing a fuzzy logic controller.
Figure 9 presents the DC output of a micro-grid without load. The DC microgrid system output voltage is 500Vdc. The above result demonstrates that the rectified output of the grid, the intended solar PV output, and the storage battery provide 500Vdc.
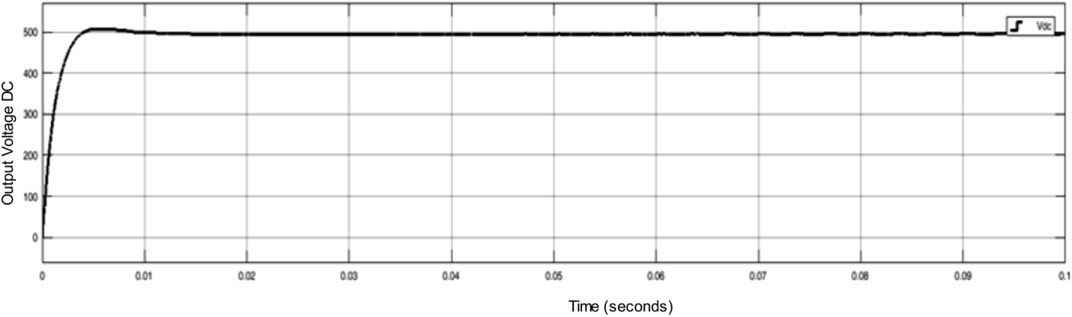
FIGURE 9. DC output of micro-grid without load.
3.1 Outputs of Fuzzy Logic Controller at Different Inputs
Different outputs from the fuzzy logic controller based on the various inputs are presented in Figure 10.

FIGURE 10. Continued.
Figures 10A,B show the battery condition when the bus voltage from the solar PV system is less than 480Vdc.At this time, the power supply from the solar PV system is extremely low, and the battery has a low SOC, so the storage battery goes into idle mode, which means no energy is given or received from the battery, and the grid goes into rectifier mode, supplying electricity to the load. According to the results, around 300 kW of electricity is drawn from the grid.
Figures 10C,D above demonstrate the outcome when the DC bus voltage from the solar PV system is between 480 and 490 Vdc. At this moment, the load needs are increasing, and the solar PV system cannot support the system on its own. As a result, the storage battery enters discharging mode and begins to discharge in order to supply the load needed by the solar PV system. For this simulation, it indicates that 60 kWh of energy is transmitted from the battery to the load. According to the result figure, the grid is in idle mode, which indicates there is no contribution from the grid.
Figures 10E,F show this result when the DC bus voltage of the solar PV system is 500Vdc.At this point, the load requirement and available power in the solar PV system are balanced. The storage battery and the grid go idle, which means that there is no contribution from the battery or grid, and the solar PV system serves on its own.
Figures 10G,H show this result when the DC bus voltage of the solar PV system is between 510 and 520Vdc.At the moment, the available power in the solar PV system exceeds the load power needed. As a result, the storage battery enters charging mode and begins charging the battery from the solar PV system. The graph illustrates that 60 kWh of energy is supplied to the storage battery from the solar PV system while the grid is in idle mode, which means there is no contribution from or to the grid.
This is the result when the DC bus voltage from the solar PV system exceeds 520 Vdc, as shown in Figures 10I,J. At the moment, it appears that the power generated by the solar PV system is quite high, while the load power consumption is relatively low. When the DC bus voltage is between 510 and 520 VDC and the SOC is full, the storage battery is charged. As a result, the battery enters idle mode, the grid inverter is enabled, and the available power in the solar PV system is delivered to the grid via the inverter.
3.2 Load Power Responses Without and With Controller
This result reveals that the author only utilized 10 kW of PV for this simulation and a DC motor as the electric vehicle load, which is a 5 kW motor with 500Vdc for this simulation. As you may know, the beginning current of an electric motor is three times the operating current, and this notion allows the author to predict what will happen to the system bus voltage when the load is raised with or without a controller. Figure 11A presents the load power response with a fuzzy logic controller. Figure 11B shows the DC bus voltage response without a fuzzy logic controller.
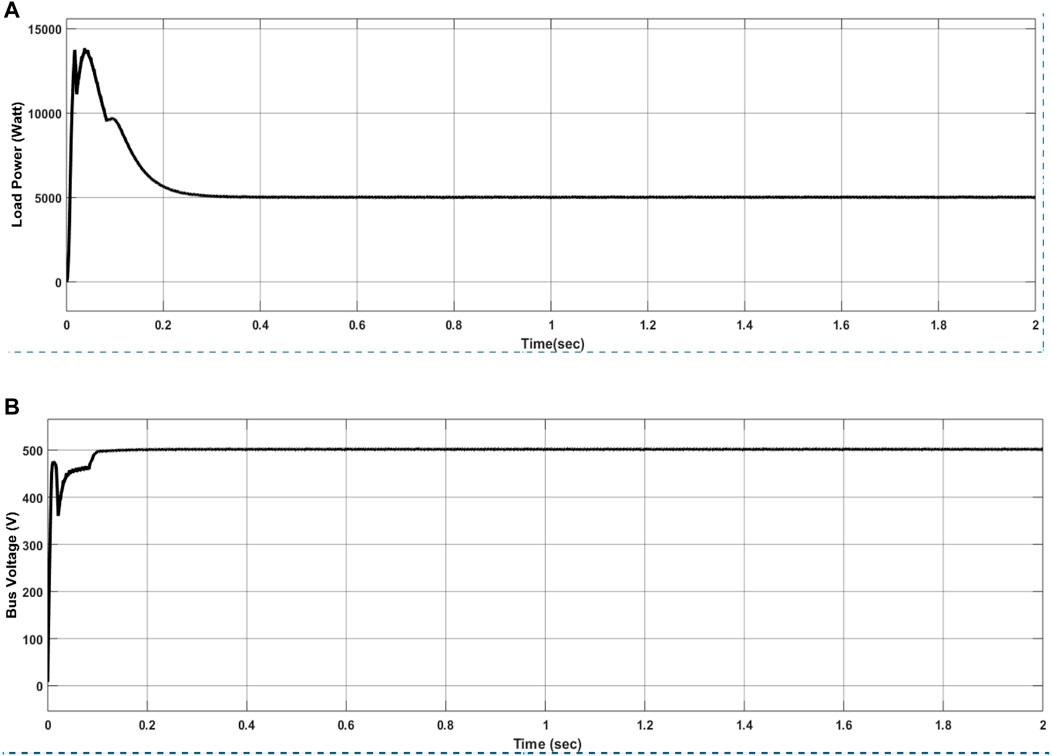
FIGURE 11. (A) Load power response with fuzzy logic controller (B) DC bus Voltage response without fuzzy logic controller.
As it is clear, when the load is raised three times, the bus voltage rises to roughly 360 V without a controller, causing a disruption in the system.
3.3 Load Power Responses With Controller
This section presented the load power variation with time with proposed controller.
The fuzzy logic controller is used to tackle this problem. When a controller is utilized in the system, the bus voltage remains within an acceptable range, the response is smooth, and no disruptions occur, as shown in Figure 12A.
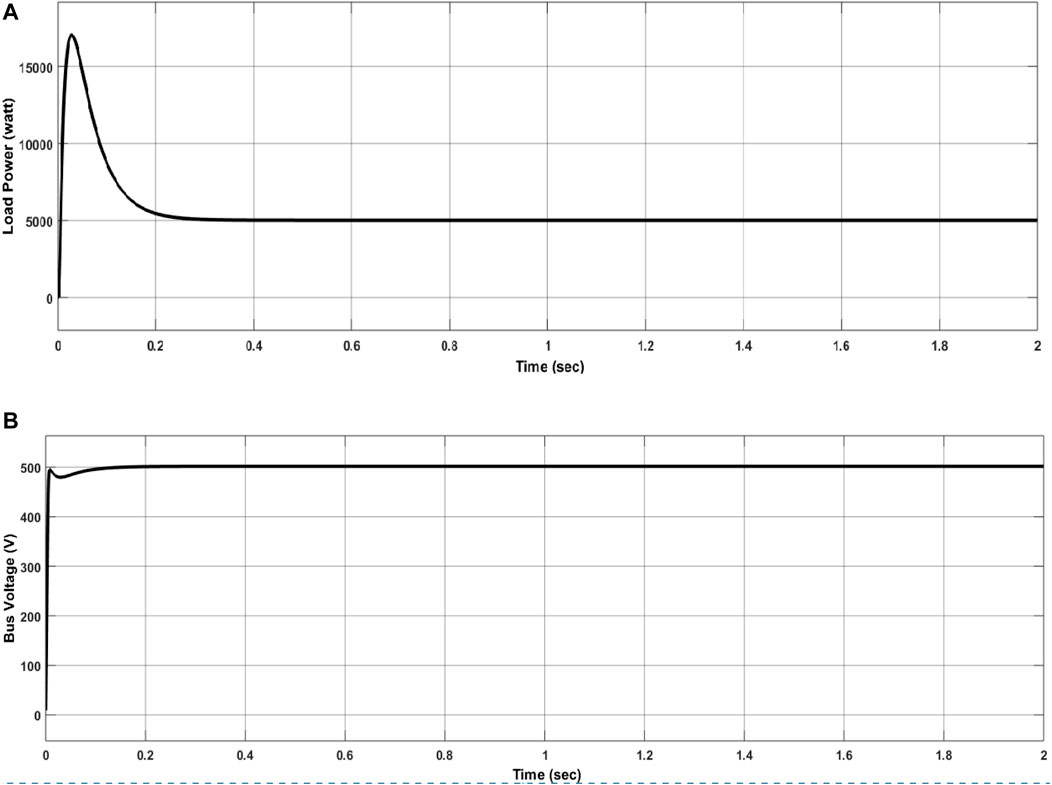
FIGURE 12. (A) Load power response with fuzzy logic controller (B) DC bus Voltage response with fuzzy logic controller.
The DC bus voltage response using a fuzzy logic controller is shown in Figure 12B. The bus voltage is reduced to 495 V from 500 V for microseconds when using a fuzzy logic controller. This demonstrates that the controller reduces power loss and keeps the bus voltage within the intended range. Table 5 presents the statistical analysis of voltage and controller response.

TABLE 5. Statistical analysis of voltage and controller response.
The simulation output in Figure 13 is for sending extra electricity to a small number of nearby consumers. When the PV power production is high and the storage is completely charged, the system is ready to deliver extra electricity if there is no electric car to charge. As a result, the system with an inverter is utilized, which converts the DC system to AC for the user. The inverter is regulated by a PI controller to keep the load terminal voltage at 1pu (380Vrms, 50 Hz).
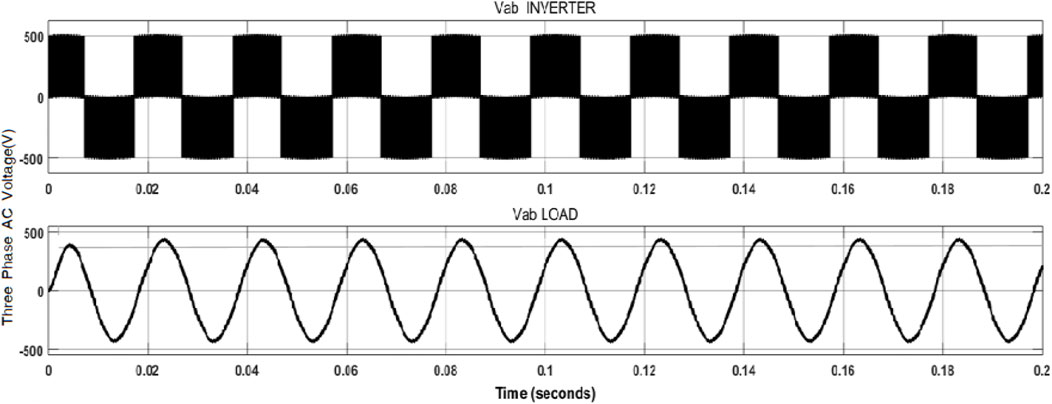
FIGURE 13. System inverter output.
3.4 Cost Analysis of the System
The micro-grid under evaluation is examined from a techno-economic standpoint using HOMER Pro software, with the net present cost (NPC) used as a criterion to evaluate the several design possibilities. The major goal of cost estimation was to minimize the whole system’s total NPC, although no load shedding was available, among a few additional technical limits. The evaluation found that the best system design for the given demands is one that includes a 400 kW PV array, 680 kWh of Li-ion batteries, and a converter with a rated power of 361 kW; the total NPC of this system is $917,350. Table 6 presents the economic comparison between the grid-only system and the proposed system.
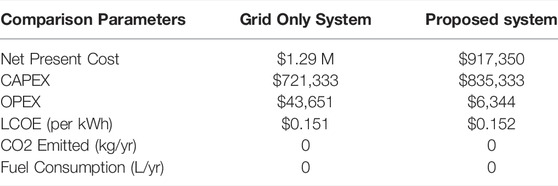
TABLE 6. Economical Comparison between grid only system and proposed system.
3.4.1 Grid Only System
The electric demands of electric vehicles are provided solely by the grid system. If the grid is exclusively used to charge EVs, the annual energy cost is $43,651.
3.4.2 Solar, Battery and Grid Integrated System
In this work, 400 kW of PV and 680 kWh of battery capacity are utilized to lower annual running expenses to $6,344 in this case. This suggests that the hybrid system has a 3.06-years investment payback and an internal rate of return (IRR) of 32.7 percent. Table 7 presents the investment cost of the proposed system.

TABLE 7. Investment cost of proposed system.
Figure 14 presented the cumulative cash flow over project life time.
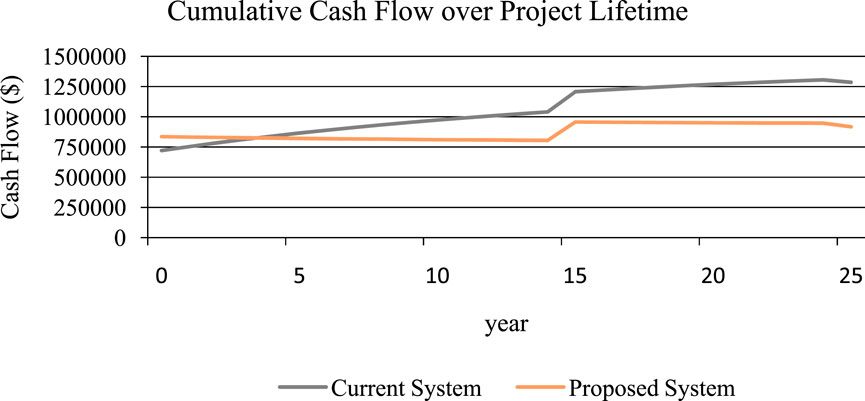
FIGURE 14. Cumulative cash flow over project life time.
3.5 Energy Output From the Different Micro-grid Component and Production Cost
3.5.1 Electric Consumption
This microgrid uses 2917 kWh per day and has a max capacity of 393 kW. The following generations from the different sources, presented in Figure 15, supply the electrical load in the proposed system.
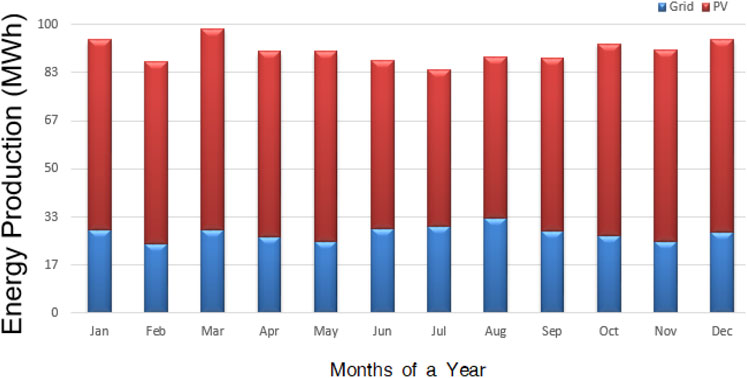
FIGURE 15. Total energy production from two sources.
3.5.2 Solar PV
The solar PV system has a nominal capacity of 400 kW. The annual production is 756,568 kWh/yr. Table 8 shows the solar PV system cost. Furthermore, Figure 16 presents the power production from a solar PV system.
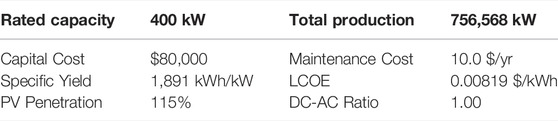
TABLE 8. Solar PV system cost.
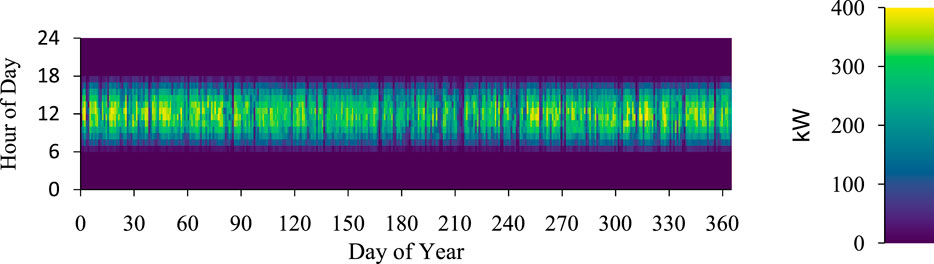
FIGURE 16. Power production from solar PV system.
3.5.3 Battery ESS
The battery energy storage system’s nominal capacity is 680 kWh. The annual throughput is 596 kWh/yr. Table 9 presents the battery energy storage system capacity and cost.

TABLE 9. Battery energy storage system capacity and cost.
3.5.4 Grid
The annual energy purchased from the grid is 334,029 kWh and the annual energy sold to the grid is 407,677 kWh. Table 10 presents the grid energy flow and cost.
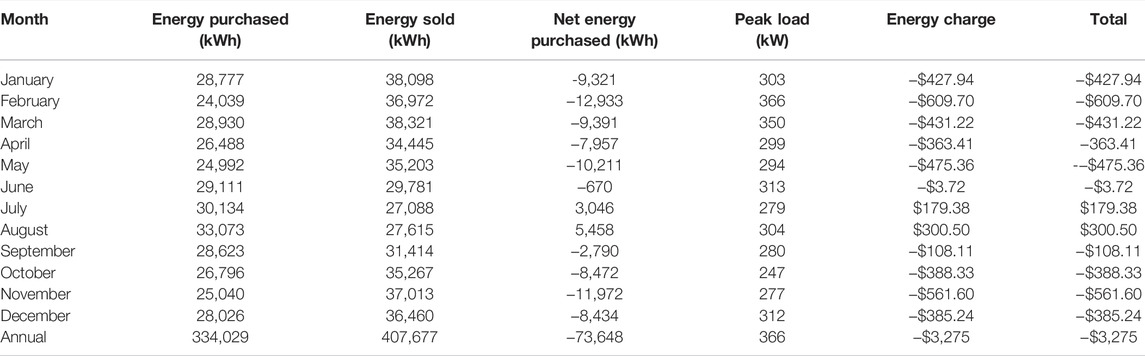
TABLE 10. Grid energy flow and cost.
3.5.5 Converters
The capacity of the converter utilized in this work with energy flow values is presented in Table 11.
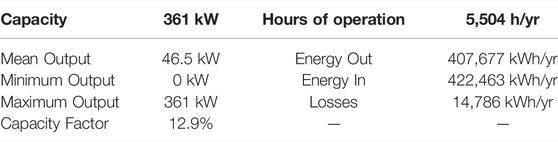
TABLE 11. Converter capacity and energy flow.
Finally, the detailed time series chart of the proposed system is presented in Figure 17.
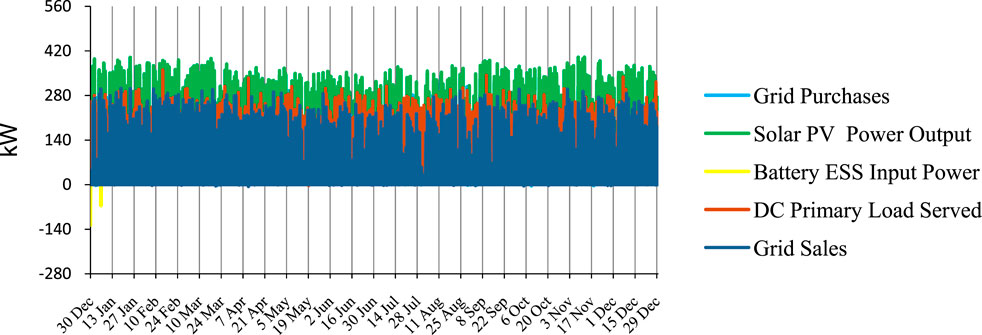
FIGURE 17. Time series charts of the system.
4 Conclusion
The research integrated solar PV systems and battery energy storage for EV charging stations. Further, integration of the PV system with the grid and energy storage is performed by using a fuzzy logic controller. Estimation of the operating costs for the proposed system is also discussed. The system is developed using MATLAB/Simulink and managed using a fuzzy logic controller. The controller has been proposed for a DC micro-grid to coordinate the power flow between solar PV, BESS and the grid. The following are the conclusions of the proposed work:
1. The fuzzy logic controller keeps bus voltage within an acceptable range regardless of variations in load and intermittent power of renewable energy sources.
2. Without the controller, the bus voltage drops to 360 V from 500 V when the load of the system increases by three times its normal value suddenly. This problem is solved with a fuzzy logic controller, and the bus voltage improves to 495 V from 360 V, which is in an acceptable region.
3. The controller improves and controls the bus voltage within an expected region.
4. By using a fuzzy logic controller, the response time is also improved to 1.645 ms with a bus voltage standard deviation of 2.2.
5. The operating costs for energy are $43,651 per year if only grid supply is utilized for charging of EVs. The addition of 400 kW of PV and 680 kWh of battery capacity reduces the operating costs to $6,344 per year, with an annual saving of $37,306.
The most obvious future work pertaining to this research would be to add a pricing system for charging stations when the number of EVs increases.
Data Availability Statement
The raw data supporting the conclusions of this article will be made available by the authors, without undue reservation.
Author Contributions
All authors listed have made a substantial, direct, and intellectual contribution to the work and approved it for publication.
Conflict of Interest
The authors declare that the research was conducted in the absence of any commercial or financial relationships that could be construed as a potential conflict of interest.
Publisher’s Note
All claims expressed in this article are solely those of the authors and do not necessarily represent those of their affiliated organizations, or those of the publisher, the editors and the reviewers. Any product that may be evaluated in this article, or claim that may be made by its manufacturer, is not guaranteed or endorsed by the publisher.
Supplementary Material
The Supplementary Material for this article can be found online at: https://www.frontiersin.org/articles/10.3389/fenrg.2022.922384/full#supplementary-material
References
Aboelsaud, R., Ahmed, I., Aleksandrov, I. V., and Ali, Z. M. (2022). Model Predictive Control Algorithm for Fault Ride-Through of Stand-Alone Microgrid Inverter. Int. J. Electr. Power & Energy Syst. 135, 107485.
Ahmad, F., Khalid, M., and Ketan Panigrahi, B. (2021). An Enhanced Approach to Optimally Place the Solar Powered Electric Vehicle Charging Station in Distribution Network. J. Energy Storage 42, 103090.
AL-Dhaifallah, M., Ali, Z. M., Alanazi, M., Dadfar, S., and Fazaeli, M. H. (2021). An Efficient Short-Term Energy Management System for a Microgrid with Renewable Power Generation and Electric Vehicles. Neural Comput. Applic. 33, 16095–16111. doi:10.1007/s00521-021-06247-5
Amin, Y., Abbasian Jazi, M., and Ma, J. (2021). Electric Vehicle Charging Station Location Determination with Consideration of Routing Selection Policies and Driver’s Risk Preference. Comput. Industrial Eng. 162, 107674.
Azimi Nasab, M., Zand, M., Padmanaban, S., Khan, B., and Khan, B. (2021). Simultaneous Long-Term Planning of Flexible Electric Vehicle Photovoltaic Charging Stations in Terms of Load Response and Technical and Economic Indicators. World Electr. Veh. J. 12, 190. doi:10.3390/wevj12040190
Balasundar, C., Sundarabalan, C. K., Sharma, J., Srinath, N. S., and Guerrero, J. M. (2021). Design of Power Quality Enhanced Sustainable Bidirectional Electric Vehicle Charging Station in Distribution Grid. Sustain. Cities Soc. 74, 103242. doi:10.1016/j.scs.2021.103242
Bastida-Molina, P., Hurtado-Pérez, E., Moros Gómez, M. C., and Vargas-Salgado, C. (2021). Multicriteria Power Generation Planning and Experimental Verification of Hybrid Renewable Energy Systems for Fast Electric Vehicle Charging Stations. Renew. Energy 179, 737–755.
Duan, P., Askari, M., Hemat, K., and Ali, Z. M. (2021). Optimal Operation and Simultaneous Analysis of the Electric Transport Systems and Distributed Energy Resources in the Smart City. Sustain. Cities Soc. 75, 103306. doi:10.1016/j.scs.2021.103306
Fescioglu-Unver, N., Yıldız Aktaş, M., and Kasnakoğlu, C. (2021). Feedback Controlled Resource Management Model for Express Service in Electric Vehicle Charging Stations. J. Clean. Prod. 311, 127629.
Gandoman, F. H., Ahmed, E. M., Ali, Z. M., Berecibar, M., Zobaa, A. F., and Abdel Aleem, S. H. E. (2021). Reliability Evaluation of Lithium-Ion Batteries for E-Mobility Applications from Practical and Technical Perspectives: A Case Study. Sustainability 13, 11688. doi:10.3390/su132111688
Goldin, E., Erickson, L., Natarajan, B., Brase, G., and Pahwa, A. (2014). Solar Powered Charge Stations for Electric Vehicles. Environ. Prog. Sustain. 33, 1298–1308.
IEA (2021). Global Energy Review: CO2 Emissions in 2021. Available at: https://www.iea.org/reports/global-energy-review-co2-emissions-in-2021-2 (Accessed Jan. 5, 2022).
Kakillioglu, E. A., Yıldız Aktaş, M., and Fescioglu-Unver, N. (2022). Self-Controlling Resource Management Model for Electric Vehicle Fast Charging Stations with Priority Service. Energy 239, 122276. Part C. doi:10.1016/j.energy.2021.122276
Li, C., Zhang, L., Ou, Z., Wang, Q., Zhou, D., and Ma, J. (2022). Robust Model of Electric Vehicle Charging Station Location Considering Renewable Energy and Storage Equipment. Energy 238, 121713. Part A. doi:10.1016/j.energy.2021.121713
Lin, L., Shen, S., Liao, Y., Wang, C., and Shahabi, L. (2021). Shunt Capacitor Allocation by Considering Electric Vehicle Charging Stations and Distributed Generators Based on Optimization Algorithm. Energy 2021, 122283.
Mehrjerdi, H. (2020). Dynamic and Multi-Stage Capacity Expansion Planning in Microgrid Integrated with Electric Vehicle Charging Station. J. Energy Storage 29, 101351. doi:10.1016/j.est.2020.101351
Mehrjerdi, H., and Hemmati, R. (2019). Electric Vehicle Charging Station with Multilevel Charging Infrastructure and Hybrid Solar-Battery-Diesel Generation Incorporating Comfort of Drivers. J. Energy Storage 26, 100924. doi:10.1016/j.est.2019.100924
Patnaik Narasipuram, R., and Mopidevi, S. (2021). A Technological Overview & Design Considerations for Developing Electric Vehicle Charging Stations. J. Energy Storage 43, 103225.
Quddus, M. A., Shahvari, O., Marufuzzaman, M., Ekşioğlu, S. D., and Castillo-Villar, K. K. (2021). Designing a Reliable Electric Vehicle Charging Station Expansion Under Uncertainty. Int. J. Prod. Econ. 236, 108132.
Yang, N., Nahid-Mobarakeh, B., Gao, F., Paire, D., Miraoui, A., and Liu, W. (2016). Modeling and Stability Analysis of Multi-Time Scale DC Microgrid. Electr. Power Syst. Res. 140, 906–916. doi:10.1016/j.epsr.2016.04.014
Keywords: DC micro-grid, electric vehicle, charging station, fuzzy logic controller, battery
Citation: Hadero M and Khan B (2022) Development of DC Microgrid Integrated Electric Vehicle Charging Station With Fuzzy Logic Controller. Front. Energy Res. 10:922384. doi: 10.3389/fenrg.2022.922384
Received: 17 April 2022; Accepted: 26 April 2022;
Published: 15 July 2022.
Edited by:
Ziad M. Ali, Aswan University, EgyptReviewed by:
Omar Abdel-Rahim, Aswan University, EgyptCH Naga Sai Kalyan, Raja Bahadur Venkata Rama Reddy Women’s College, India
Copyright © 2022 Hadero and Khan. This is an open-access article distributed under the terms of the Creative Commons Attribution License (CC BY). The use, distribution or reproduction in other forums is permitted, provided the original author(s) and the copyright owner(s) are credited and that the original publication in this journal is cited, in accordance with accepted academic practice. No use, distribution or reproduction is permitted which does not comply with these terms.
*Correspondence: Baseem Khan, YmFzZWVtLmtoYW4wNEBnbWFpbC5jb20=