- 1National Ocean Technology Center, Tianjin, China
- 2Department of Civil Engineering, Nanjing University of Aeronautics, Nanjing, China
- 3School of Naval Architecture, Ocean and Civil Engineering, Shanghai Jiao Tong University, Shanghai, China
- 4State Key Laboratory of Ocean Engineering, Shanghai Jiao Tong University, Shanghai, China
- 5Dalian Naval Academy, Dalian, China
With the commercialization of offshore wind and the continued advancement of wave energy technologies, the option of locating both in the same sea area has emerged. The joint development of offshore wind and wave energy can effectively address the challenges faced by offshore wind and wave energy development, reduce costs, and improve the stability of power generation and output. This article introduces the current status of sea area utilization and marine functional zoning in Zhejiang Province and proposes a site selection method to identify the most suitable sea area for the construction of co-located offshore wind and wave farms in Zhejiang. First, a geographic information systems database was developed to identify unsuitable areas for co-located offshore wind and wave farms. Then, a literature review was conducted to establish a system of resource, economic, and technical selection indicators, and the Delphi method was used to determine the weight of each indicator. Finally, the sea areas suitable for the construction of co-located offshore wind and wave farms were evaluated and ranked, and the order of power plant development was given. The results of the study illustrate the potential of developing co-located offshore wind and wave farms in Zhejiang, especially in the northern part of Zhoushan and the southern part of Taizhou.
Introduction
Both offshore wind energy and wave energy belong to the ocean renewable energy, which is known as the most potential renewable energy. With the variation of global climate and environment, the effective development and utilization of offshore wind and wave energy resources have attracted great attention all over the world (Wan et al., 2016; Akpınar et al., 2019; Kamranzad and Lin, 2020; Kamranzad and Takara, 2020). Also, a series of policies and regulations have been formulated one after another. Europe was in a leading position for the utilization of ocean energy, whose installed capacity of offshore wind energy accounted for more than 90% of the world, and it aimed to meet 4% of Europe’s energy demand by 2020 (Kalogeri et al., 2017). China’s 13th Five-Year Plan of wind energy development stipulated that the installed capacity of offshore wind energy would reach about five million kW by 2020. Moreover, the global wave energy industry was still in the demonstration application stage, which was expected to be used for commercial purposes in the medium and short term (Magagna and Uihlein, 2015). The “European ocean energy strategic roadmap” aims to achieve the installed capacity of 100 GW for wave energy and tidal current energy in Europe by 2050. China’s 13th Five-Year Plan for the development of ocean renewable energy aims to build a wave energy demonstration base of 500 kW by 2020. Moreover, the 14th Five-Year Plan of energy development in Zhejiang Province focuses on promoting the development of offshore wind energy and intensively building a demonstration project of offshore wind energy + ocean energy + energy storage + hydrogen production + ocean pasture + onshore industrial base. During the 14th five-year plan of Zhejiang Province, offshore wind energy strives to increase the installed capacity by more than 4.5 GW.
Offshore wind and wave resources often coexist in the same locations (Clark et al., 2019), and the combination of these two promising energies is a solution to enhance the competitiveness of marine renewable energy and meet the carbon emission targets. The sea site selection and planning of wave–wind combined energy generation is an important link in the preliminary work of co-located offshore wind and wave farm (COWWF) construction project, which is the key to determine the good economic benefits of electric field construction. Evaluation of the complementarity of the wind and wave energy potential have been carried out in various studies around the world (Astariz and Iglesias, 2017; Azzellino et al., 2013; Kalogeri et al., 2017; Murphy et al., 2011; Rusu and Rusu, 2021a; Rusu et al., 2017; Rusu and Rusu, 2021b; Wan et al., 2018).
Many previous studies analyzed the combined wind–wave exploitation mostly focused on the characteristics of the resources themselves (Rusu et al., 2017; Wan et al., 2018), while the combined wave–wind site selection is not just a matter of resources, it is a complex and comprehensive evaluation process with multi-level, multi-objective, and multi-factor characteristics, which is restricted by many factors such as natural geography, ocean resources, transportation, power grid, and national-local policies. The effective decision-making needs clear methods to evaluate and rank the various options.
Different indexes and methods are proposed to evaluate wave–wind exploitation. The CLF index (co-location feasibility index) was defined by Astariz and Iglesias, (2016) and Astariz and Iglesias, (2017) to encompass the factors when searching for the best location for a co-located wave and wind energy farm. The best location of co-located wave and wind energy farms in the central and southern North Sea was assessed while balancing the environmental conservation and economic development. The MSP method (marine spatial planning) was utilized by Azzellino et al. (2013) to select the best site for wind and wave energy in the North Sea of Denmark, which considered the characteristics of wind and wave resources, channel, fishery, and other planning indicators. The EU ORECCA project (Murphy et al., 2011) comprehensively considered the site selection indicators such as resources and water depth, which had been successfully applied to the joint site selection of offshore wind energy, wave energy, and/or tidal energy in the North Sea, Baltic Sea, Atlantic coast, Mediterranean Sea and Black Sea.
MCDM (multi-criteria decision-making) methods have become increasingly popular in site selection decision-making of renewable energy power plants because they consider multiple conflicting goals and decision-maker preferences (Shao et al., 2020). Vasileiou et al. (2017) used the AHP (analytic hierarchy process) and comprehensively considered the economic, technical, social, and political factors, to carry out the site selection for Greece’s offshore wind and wave combined energy system. Ribeiro et al. (2021) applied the Delphi method to classify the wave energy resources along the northwest coast of the Iberian Peninsula, while seven indices were considered including wave resource, stability, risk, and installation and maintenance costs. These environmental, political, and technological factors must be considered to determine the best site for the co-location of offshore wind and wave farms.
The hindcast datasets were widely used directly (Martinez and Iglesias, 2020; Rusu and Rusu, 2021a; Rusu and Rusu, 2021b), or to form the input data for wave simulation models such as Swan, WAVEWATCH-III, and WAM in wave–wind energy resource assessments and co-location evaluation. (Zheng et al., 2013; Kalogeri et al., 2017; Kamranzad and Lin, 2020; Kamranzad and Takara, 2020; Gideon and Bou-Zeid, 2021). Kamranzad and Takara, (2020) utilized the JRA-55 wind dataset (developed by the Japan Meteorological Agency) as the input data for Swan to generate the simulated waves. Gideon and Bou-Zeid, (2021) used NOAA and Hywind data as the input data to analyze the variability of wave–wind power farms in different sites. The ERA-5 database was chosen by Martinez and Iglesias, (2020), Rusu and Rusu, (2021a), and Rusu and Rusu, (2021b). Wan et al. (2018) selected the ERA-Interim reanalysis data, and some scholars used the satellite data (Rusu and Rusu, 2021a; Wan et al., 2016).
Chinese researchers have conducted a series of studies to assess wave and wind energy in the China Sea. Zheng (2011) and Zheng et al. (2013) evaluated the distributions of wave and wind energy around the East China Sea and South China Sea. Wan et al. (2018) assessed the joint potential of wave and wind energy in the South China sea. While most studies focused on the China Sea are the traditional single-criterion approaches, the assessment mainly just considered the characteristics of wave and wind energy, the influence on the marine environment, and future socioeconomic benefits that need to be considered in the selection of co-location offshore wind and wave farms.
The MCDM site selection method for the COWWF construction in the suitable sea area of Zhejiang Province, China, was presented in this article based on the literature survey method, Delphi, and GIS. According to ERA-Interim reanalysis datasets and a set of restricted indexes, the sea areas that are not suitable for the COWWF construction are determined. The restricted indexes were different from Vasileiou et al. (2017), and the selected exclusion criteria taken into account in this studywere based on the China marine environment, policies, technology, and regulations. For example, the annual average wind speed of less than 5.6 m/s was considered not suitable for the site selection in China, while a wind speed smaller than 6 m/s was considered unsuitable by Vasileiou et al. (2017).
A GIS database is developed, and a thematic map is prepared according to the aforementioned restricted indexes. Then, the resource, economy, technology, and other planning index system are established according to the literature survey method, and the Delphi method is used to determine the weight of each index.
Scholars have proposed different evaluation index systems for site selection, such as Astariz and Iglesias, (2016), Astariz and Iglesias, (2017), Ribeiro et al. (2021), and Vasileiou et al. (2017). The opinions of 18 experts from 14 enterprises, universities, and scientific research institutes are integrated totally in this article, which makes the evaluation index system more representative. Finally, the sea areas which meet the construction conditions and do not meet the exclusion index are evaluated and ranked, and the sea areas suitable for the COWWF construction in Zhejiang Province are determined.
Regional Overview
Geographical Location of Zhejiang Province
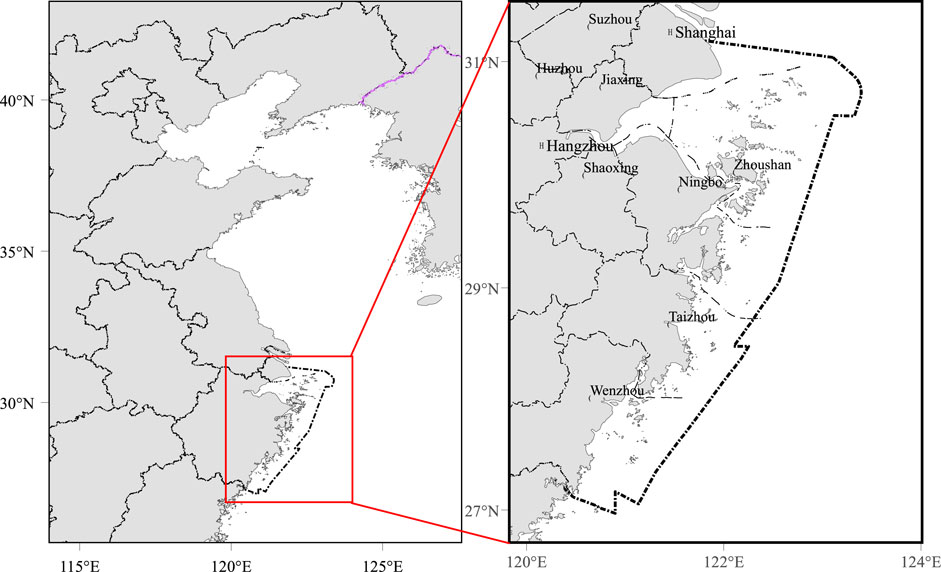
Zhejiang Province is located in the south wing of the Yangtze River Delta and the middle of the southeast coast. The sea area is adjacent to Shanghai and Fujian Province with the geographical coordinates ranging from 121°11′58″ to 123°23′38″ east longitude and 27°2′47″ to 30°41′30″ north latitude (as shown in Figure 1). The territorial sea and the internal water area within the province is 44,400 square kilometers, including the jurisdictional contiguous zone, the exclusive economic zone, and the continental shelf with an area of 260,000 square kilometers. Zhejiang Province had a total coastline of about 6,700 km, more than 4,300 islands, and 2,878 islands with an area of more than 500 square meters (The People’s Government of Zhejiang Province, 2012).
Ocean Wind and Wave Resources in Zhejiang Province
The ERA-Interim data are hosted at the European Centre for Medium-Range Weather Forecasts (ECMWF), which is a new production after the ERA-40. Its time resolution is 6 hourly intervals. The spatial resolution covers 0.125 ° × 0.125 °, 0.25 ° × 0.25 °, 0.5 ° × 0.5 °, ..., 2.5 ° × 2.5 °. In this study, the spatial resolution of data is 0.125 ° × 0.125 °, the time resolution is 6 h, and the time span is from 1 January 1986 to 31 December 2015 (30 years in total). ERA-Interim data can be downloaded from the ECMWF Public Datasets web interface. For detailed documentation of the ERA-Interim Archive see Berrisford et al. (2011).
The effective wind time counted the cumulative hours of wind speed between three and 25 m/s in one year (GB/T 18710--2002, 2002). The effective wave time counted the cumulative hours of effective wave height between 1 and 4 m in one year (GB/T 34910.3 - 2017). Figures 1, 2 show the distribution map of offshore wind and wave energy resources in Zhejiang waters for 30 years. It can be seen that the wind and wave resources in Zhejiang Province gradually increase from the north to the south and from the west to the east. Also, the variation of the nearshore sea area is obvious. The annual average wind speed in most sea areas of Zhejiang was 5.6–7.0 m/s, which could be applied to the grid-connected wind energy generation (GB/T 18710--2002, 2002). The effective wind time was 6,500–7,500 h, and the annual average wave energy density of most offshore waters in Zhejiang Province was less than 2 kW/m, and the results were consistent with Rusu and Rusu, (2021b), which was not suitable for wave energy development and utilization (GB/T 34910.3-2017). The maximum value was located in the offshore waters in the north of Zhoushan and the south of Taizhou. Moreover, the annual average wave energy current density exceeded 6 kW/m. In most sea areas, the effective wave duration was 1,000–2000 h, and the maximum value was located in the south of Taizhou, and the effective wave duration could reach 5,000 h.
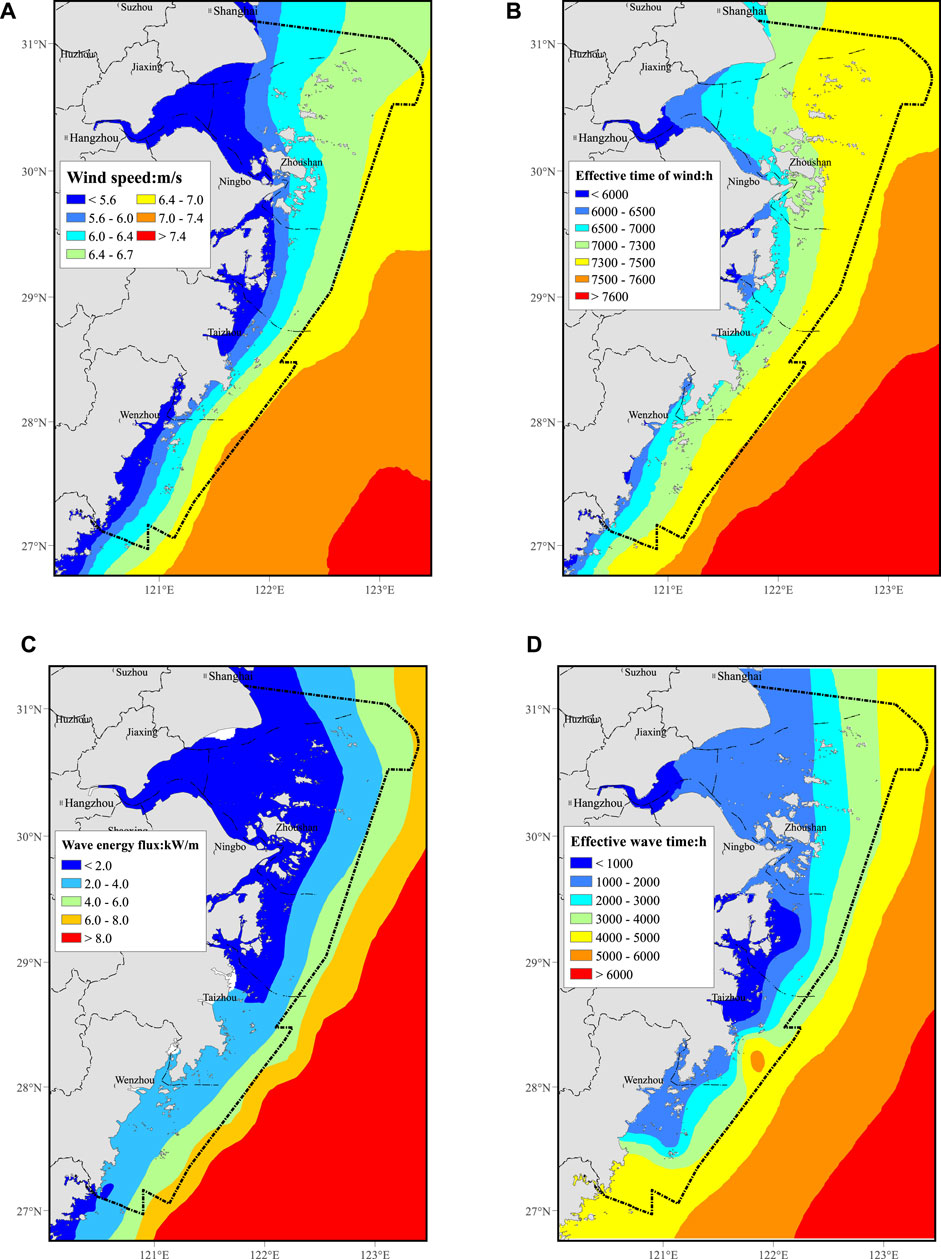
FIGURE 2. Spatial distribution of the annual mean in Zhejiang Province. (A) Annual average wind speed, (B) effective offshore wind time, (C) annual average wave energy density, and (D) effective wave time, for the period 1986–2015.
Figures 3, 4 show the seasonal behavior of the offshore wind and wave energy in winter (December–January–February, DJF), spring (March–April–May, MAM), summer (June–July–August, JJA), and autumn (September–October–November, SON). The seasonal variation of offshore wind energy and wave energy in the Zhejiang sea area is not obvious. The wind energy is maximum in summer (mean 230 W/m2), medium in winter (mean 220 W/m2) and autumn (mean 208 W/m2), and minimum in spring (mean 202 W/m2). The wave energy is maximum in winter (mean 2.8 kW/m), medium in summer (mean 2.3 kW/m) and autumn (mean 1.9 kW/m), and minimum in spring (mean 1.8 kW/m). Under the influence of the typhoon in summer and the northeast monsoon in winter, offshore wind energy and wave energy are relatively abundant in these two seasons.
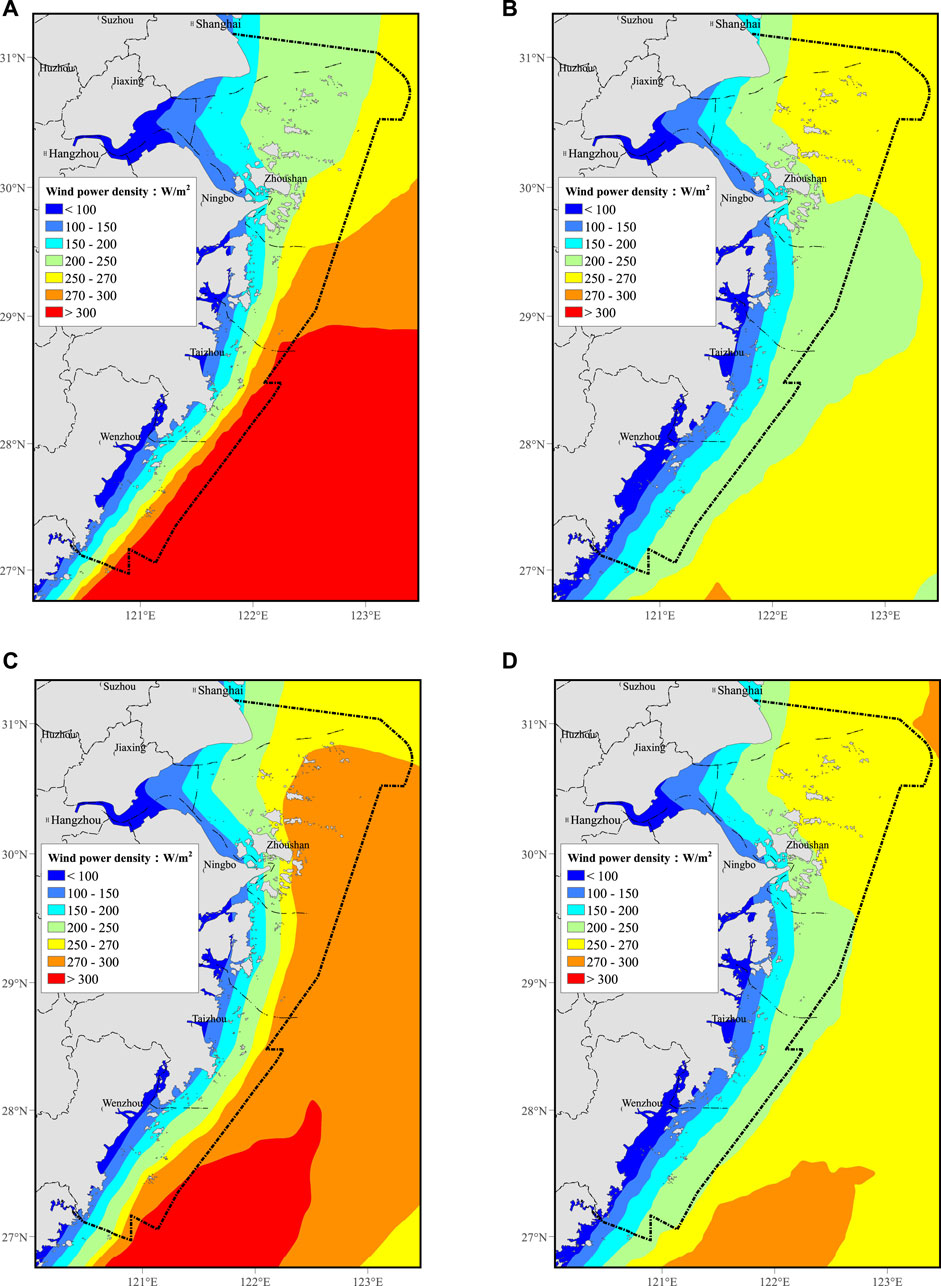
FIGURE 3. Spatial distribution of the seasonal behavior of the mean wind power density for the period 1986–2015. The selected seasons are: (A) winter (DJF); (B) spring (MAM); (C) summer (JJA); and (D) autumn (SON).
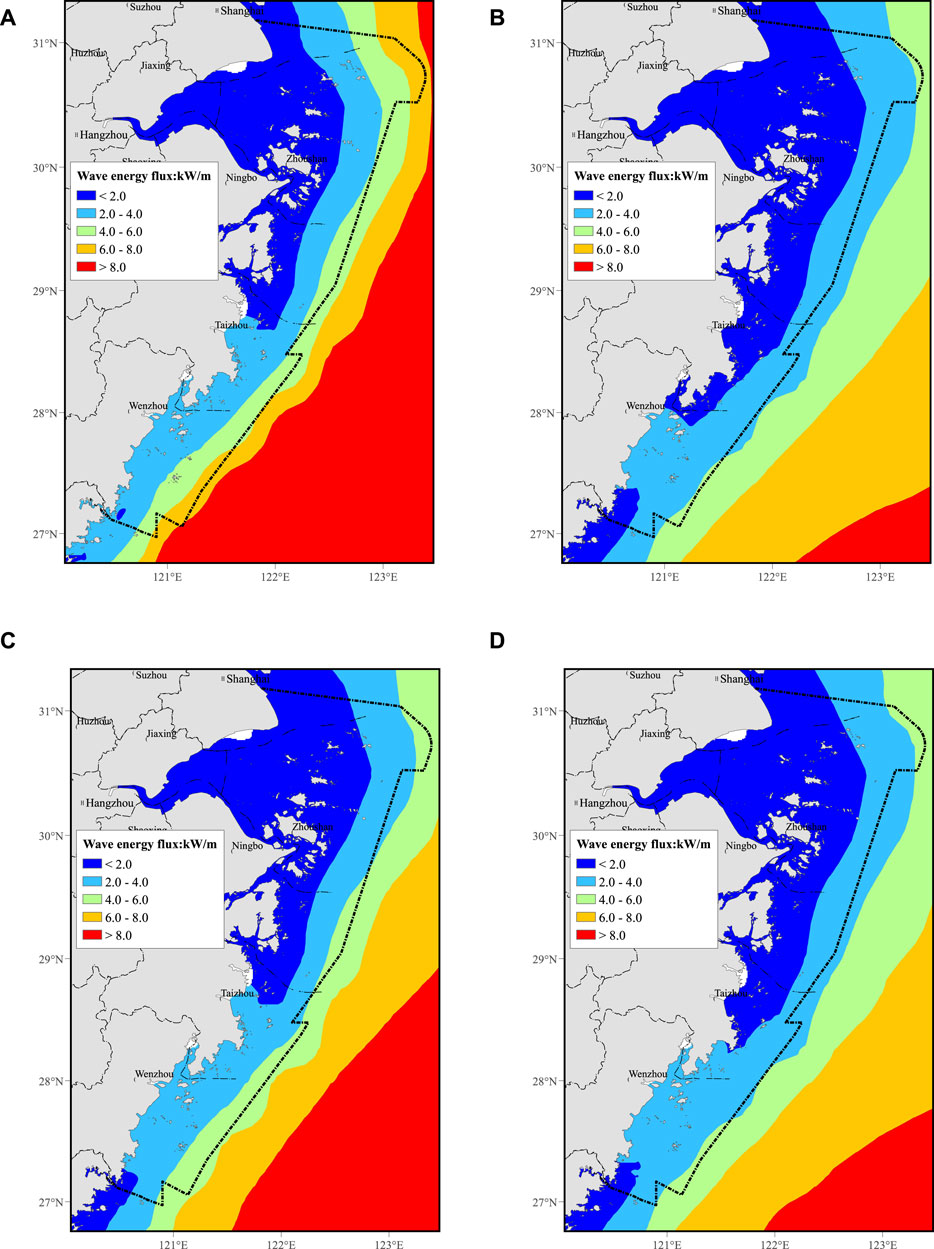
FIGURE 4. Spatial distribution of the seasonal behavior of the mean wave energy flux for the period 1986–2015. The selected seasons are: (A) winter (DJF); (B) spring (MAM); (C) summer (JJA); and (D) autumn (SON).
Research of Wen et al. (2022) shows that the Zhejiang coast experiences the lowest correlation between the two resources; therefore, wind and wave joint development is more conducive to stable power output (Muliawan et al., 2012; Kalogeri et al., 2017; Zhu et al., 2019).
Current Situation of Sea Area Development as Well as Utilization and Ocean Function Zoning in Zhejiang Province
Current Situation of Sea Area Development and Utilization in Zhejiang Province
The coastline length of Zhejiang Province ranked first in the country, and the beach resources lied at the top in the country, but the degree of development and utilization was high. Meanwhile, the demand and use intensity of land reclamation as well as the deep-water coastline increased day by day. More than 40% of the coastline in Zhejiang Province had been developed and utilized. The deep-water coastline resources with a water depth of more than 10 m were about 500 km, and 80% of them were concentrated in Ningbo and Zhoushan (Planning of Zhejiang Marine Functional Area). On the one hand, the large-scale reclamation had brought great pressure on the ocean ecological environment protection and the sea area use management. On the other hand, the over exploitation of nearshore was serious; the available shoreline, beach space, and shallow sea biological resources were decreasing day by day, and the ocean reserve resources were insufficient (Planning of Zhejiang Marine Functional Area).
Ocean Functional Zoning in Zhejiang Province
According to the natural environment characteristics, natural resource advantages, and socio-economic development needs of sea areas in Zhejiang Province, the ocean functional areas in Zhejiang Province could be divided into eight first-class categories: agricultural and fishery areas, port and shipping areas, industrial and urban sea areas, mining and energy areas, tourism, leisure, and entertainment areas, ocean protection areas, special utilization areas, and reserved areas, with a total of 223 ocean basic functional areas divided (Shao et al., 2020). The development of ocean energy was prohibited for port shipping areas, tourism, leisure, and entertainment areas, ocean reserves, and special utilization areas [as shown in Planning of Zhejiang Marine Functional Area (2017)].
Data and Methods
Site Selection Method of COWWF
To determine the most suitable sea area for COWWF construction in Zhejiang Province, we develop and apply a site selection method, which is based on the combination of the literature survey method, Delphi method, and GIS, including three stages. The purpose of the first stage (exclusion stage) was to exclude the sea areas that are not suitable for COWWF construction, so as to determine the possible suitable ocean areas, which are the alternative areas to be further evaluated. For this purpose, the GIS database has been developed to generate a thematic map of exclusion indicators for utilization restrictions (including resources, economy, technology, and policy constraints). By superimposing the aforementioned map, the sea areas unsuitable for COWWF construction are determined, while the other areas represent the areas where COWWF may be constructed, namely, the selected assessment alternative sea areas. As for the second stage (evaluation index establishment stage), the literature survey method is used to determine the evaluation index of COWWF site selection, and the Delphi method is used to determine each index weight. As for the third stage (comprehensive evaluation stage), the alternative sea areas determined in the first stage are comprehensively evaluated by using the evaluation indexes and weights designed in the second stage. According to the evaluation results, the appropriate sea areas of COWWF are selected to give the development sequence of starting the electric field.
Exclusion Indicators
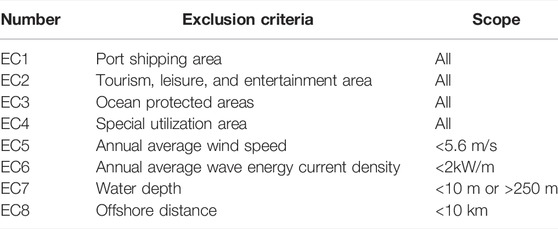
To determine the sea area which is not suitable for COWWF construction in Zhejiang Province, a set of exclusion indicators is considered. These indicators describe the resource, economic, technological, and social constraints of wind and wave development as well as utilization. According to Zhejiang Province water functional zoning (2011–2020) (Marine function zoning in Zhejiang Province), the sea areas which could not be compatible with wind and wave development as well as utilization were analyzed and determined. The remaining restrictions mainly consider the economic, the technical feasibility, and the policy compliance. A total of eightexclusion indicators are selected in this study, as shown in Table 1. The selection of exclusion indicators refers to the references, namely, Vasileiou et al. (2017), Planning of Zhejiang Marine Functional Area, and Shao et al. (2020).
The first four exclusion indexes (EC1 ∼ EC4) are related to the use restrictions of ocean functional zoning. Specifically, the following ocean functional areas are excluded:
The port shipping areas: these sea areas are used to develop and utilize the port shipping resources for the construction of ports, waterways, and anchorages.
The tourism, leisure, and entertainment area: the development of the sea area should pay attention to the protection of coastal natural landscape and beach resources. Also, the non-public welfare facilities are prohibited from occupying public tourism resources.
The ocean protected areas: the sea areas dedicated to ocean resources, environment, and ecological protection.
The special utilization area: it refers to the sea area used for other special purposes such as submarine pipeline laying, road and bridge construction, sewage discharge up to standard, and dumping, which is prohibited to build other permanent buildings within the sea area.
Exclusion indicators of EC5–EC7 are related to the economic and technical constraints, and EC8 is related to the policy impact. These exclusion indicators are described as follows:
The annual average wind speed: the available offshore wind potential determines the economic and technical feasibility of the COWWF project. This potential can be expressed quantitatively by the annual average wind speed at 10 m height. The sea area with an annual average wind speed of less than 5.6 m/s was considered not suitable for the site selection of COWWF (GB/T 34910.3-2017).
The annual average wave energy flow density: the COWWF project aims to develop offshore wind energy and wave energy at the same time. Therefore, the economic and technical feasibility of this hybrid energy system also largely depends on the available wave energy. It was generally considered that the annual average wave energy density was greater than 2kW/m (GB/T 34910.3-2017; Measures for the management of offshore wind power development and construction).
The water depth: the spatial limitation of water depth on-site selection is based on the basic design of COWWF. The pile foundation type is generally applicable to the water depth within 50 m. Although the floating type overcomes the shortcomings of water depth limitation and develops to the deep-water area of hundreds of meters, the main challenges of the floating foundation are how to maintain the foundation stability, limit the foundation displacement, the efficient anchor chain system, and reduce the design, the installation, and the maintenance costs. At present, the Hywind demo of the deepest floating wind farm has a water depth of 220 m. On account of the forward-looking principle, the depth is limited to 250 m in this article.
The offshore distance: the COWWF construction near the coast would have a negative impact on the environment, such as the impact of vision and noise, which might affect the safety of various existing human activities (such as fishing and leisure activities) in the corresponding coastal areas (Vasileiou et al., 2017). Zhang et al. (2013) stipulated that offshore wind farms should comprehensively consider the development intensity, resource, and environmental carrying capacity in accordance with the requirements of ecological civilization construction. In principle, they should be arranged in the sea area with a water depth of no less than 10 m when the offshore distance was not less than 10 km and the beach width was more than 10 km (State Energy Administration and State Oceanic Administration, 2016).
Evaluation Indicators
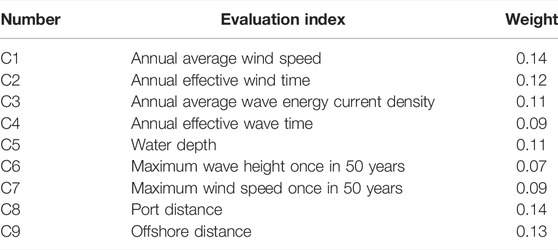
To determine the COWWF site and development sequence, the alternative sea area needs to be evaluated. Therefore, the site selection index system of resources, economy, and technology is established according to the literature survey method (Flocard et al., 2016; Zheng et al., 2018; Shao et al., 2020). Also, the preliminarily established index system has 14 indexes. The Delphi method is used to determine the weight of each index and solicit the first round of opinions from 18 experts of 14 enterprises, universities, and scientific research institutes, who score the weight of 14 indexes preliminarily selected. Meanwhile, the opinions of 18 experts are integrated, and five indexes with a weight less than 0.02 are deleted. Moreover, the second round of opinions is solicited from 18 experts for the remaining 9 indexes, and the final results are shown in Table 2 (Zheng et al., 2019; Zheng, 2021).
To comprehensively evaluate the indicators of different dimensions in Table 2, the normalization is used in this study. The normalization is a way to simplify the calculation, namely, the dimensional values being transformed into dimensionless values. By means of using the linear normalization function, the evaluation index is transformed into the standardization factor. C1–C4 represent the resource potential of wind and wave energy. Also, the resource richness increases with the increasing value, and the conversion method is shown in Equation 1:
where x is the value before conversion; y is the standardized value after conversion, which is dimensionless with the range of 0–1 (1 being the best and 0 being the worst); MaxValue is the maximum value of the sample; and MinValue is the minimum value of the sample.
C5, C8, and C9 are the operating water depth and the distance to the nearest port or coastline, respectively, which have a great impact on the construction and maintenance cost of the power station. C6 and C7 are the maximum wave height and the maximum wind speed, respectively, once in 50 years, which are used to evaluate the survival level of the device under extreme conditions. Moreover, the conversion method is shown as Equation 2:
where x is the value before conversion, y is the standardized value after conversion, MaxValue is the maximum value of the sample, and MinValue is the minimum value of the sample.
According to the weighted linear combination, namely, each standardized value being multiplied by the corresponding weight in Table 2. Also, the results are summed to obtain a location suitability index of COWWF, as shown in Equation 3:
where SI is the site suitability index of COWWF, wi is the weight of ith evaluation index, and yi is the ith standardized value.
Results
Exclusion of Unsuitable Sea Areas
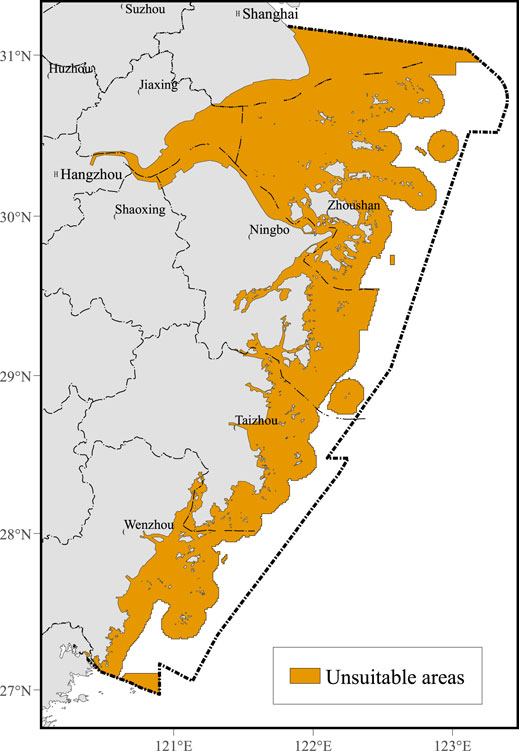
After determining the exclusion indicators shown in Table 1, the corresponding thematic map is formed by means of GIS. According to GIS superposition, the sea areas unsuitable for COWWF construction are determined (as shown in Figure 5), and the other sea areas are alternative sea areas that may be suitable for COWWF construction.
Major Criteria Classification
All the alternative sea areas are divided into many units with 0.125 ° × 0.125 ° for the evaluation and ranking to determine the priority of COWWF site selection. The evaluation criteria layer was designed to take into account the annual average wind speed, annual effective wind time, annual average wave energy current density, annual effective wave time, water depth, maximum wave height once in 50 years, maximum wind speed once in 50 years, port distance, and offshore distance at the suitable areas previously calculated. Each of these nine factors was normalized using formulation Eq. 1 or Eq. 2, attributed to the weights given in Table 2.
The annual average wind speed, annual effective wind time, annual average wave energy current density, and annual effective wave time represent the potential of wind and wave energy resources, with site suitability increasing with this criterion value. Each of the four factors was normalized using formulation Eq. 1, attributed a weight (Table 2), and combined to create the layer using the GIS.
The water depth, port distance, and offshore distance have a great impact on the construction and maintenance cost of the power station. The maximum wave height once in 50 years and maximum wind speed once in 50 years are used to evaluate the survival level of the device under extreme conditions. It can be observed that, contrary to the results of the five parameters, they were normalized using formulation Eq. 2, the same attributed a weight (Table 2), and combined to create the layer using the GIS.
Site Classification
The spatial restrictions are associated with the resource, economic, technological, and social constraints as well as conflict of use (Table 1 and Figure 5). Using the formulation (Eq. 3), the previously defined major criteria were in turn combined using the major weights given in Table 2.
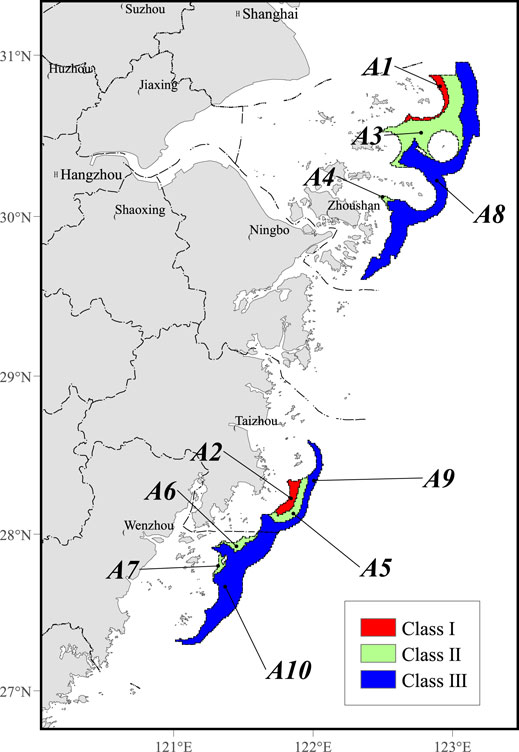
According to the location suitability index (SI), it is divided into three categories: class I area (SI ≥ 0.70), class II area (0.70 ≥ SI > 0.65), and class III area (0.65 ≥ SI > 0.60). The final results for the base case in Figure 6 show that the areas of class I are located in the north of Zhoushan and south of Taizhou, accounting for more than 0.13% of the study area. This is mainly due to the fact that these areas yield the highest values of offshore wind and wave energy and they are also in close proximity to important infrastructure such as a harbor facility. The areas of class II are located in the northeast of Zhoushan, middle of Zhoushan, south of Taizhou, north of Taizhou, and north of Wenzhou, accounting for more than 0.58% of the study area. The areas of class III are located in the east of Zhoushan, middle and south of Taizhou, and east and middle of Wenzhou, accounting for more than 1.51% of the study area.
According to the geographical location and zoning level, the potential sea area for COWWF construction in Zhejiang Province is divided into ten areas A1 ∼ A10 (as shown in Table 3).
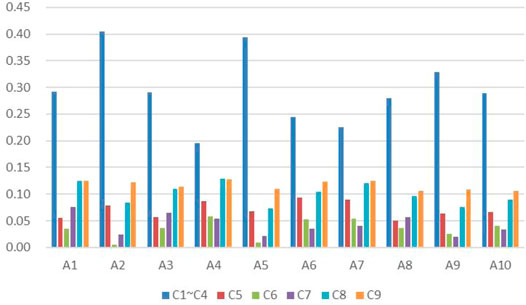
The relative weights of assessment indicators for ten areas A1∼A10 are shown in Figure 7. C1∼C4 represent the wave and wind energy resources, which are combined into one index. It can be seen that A2 and A5 are the most abundant in wave energy and wind energy resources, but the maximum wave height once in 50 years in these two regions exceeds 9 m (the highest value in the sea area of Zhejiang Province), which is a great test for the plant viability. Although A8∼A10 have the same resources as A1 (even A9 is better than A1), they are divided into class III areas because they are far from the coastline and port.
Conclusion
In this study, we present a methodology for selecting the most suitable locations for COWWF considering technical, socio-economic, and environmental parameters. The suitability of the sites was evaluated based on nine essential criteria: the annual average wind speed, annual effective wind time, annual average wave energy current density, annual effective wave time, water depth, maximum wave height once in 50 years, maximum wind speed once in 50 years, port distance, and offshore distance.
The procedure was applied to the Zhejiang sea area and demonstrates how criteria ranked using weightings based on an expert judgment can be used to evaluate promising locations for COWWF that may assist in setting an ocean energy policy. The results clearly identified optimal locations, totaling an area of over 325 km2, for COWWF with high suitability scores corresponding to two locations previously earmarked in the north of Zhoushan (A1) and the south of Taizhou (A2).
Based on the literature survey, Delphi, and GIS, this study puts forward a site selection method for the COWWF construction in the suitable sea area of Zhejiang Province, so as to determine the most suitable sea area for the COWWF deployment in Zhejiang Province. The results show the potential of deploying COWWF in Zhejiang Province, which can provide the technical support for the micro-location of COWWF in Zhejiang Province.
Data Availability Statement
The original contributions presented in the study are included in the article/Supplementary Material; further inquiries can be directed to the corresponding authors.
Author Contributions
BJ, EH, and CZ: conceptualization and methodology. JD and YF: methodology and data curation. GW, WX, and SK: investigation and methodology. YL and HZ: original draft preparation. MW, FF, and DB: software and validation. BJ, EH, JD, and CZ: manuscript revision.
Funding
This research was funded by the National Key R&D Program of China under grant numbers 2017YFE0132000, 2019YFE0102500, and 2019YFB1504401 and National Natural Science Foundation of China under grant number 52078251.
Conflict of Interest
The authors declare that the research was conducted in the absence of any commercial or financial relationships that could be construed as a potential conflict of interest.
Publisher’s Note
All claims expressed in this article are solely those of the authors and do not necessarily represent those of their affiliated organizations, or those of the publisher, the editors, and the reviewers. Any product that may be evaluated in this article, or claim that may be made by its manufacturer, is not guaranteed or endorsed by the publisher.
References
Akpınar, A., Jafali, H., and Rusu, E. (2019). Temporal Variation of the Wave Energy Flux in Hotspot Areas of the Black Sea. Sustainability 11 (3), 562. doi:10.3390/su11030562
Astariz, S., and Iglesias, G. (2016). Selecting Optimum Locations for Co-located Wave and Wind Energy Farms. Part I: The Co-location Feasibility Index. Energy Convers. Manag. 122, 589–598. doi:10.1016/j.enconman.2016.05.079
Astariz, S., and Iglesias, G. (2017). The Collocation Feasibility Index - A Method for Selecting Sites for Co-located Wave and Wind Farms. Renew. Energy 103, 811–824. doi:10.1016/j.renene.2016.11.014
Azzellino, A., Ferrante, V., Kofoed, J. P., Lanfredi, C., and Vicinanza, D. (2013). Optimal Siting of Offshore Wind-Power Combined with Wave Energy through a Marine Spatial Planning Approach. Int. J. Mar. Energy 3-4, e11–e25. doi:10.1016/j.ijome.2013.11.008
Berrisford, P., Dee, D., Poli, P., Brugge, R., and Simmons, A. (2011). The ERA-Interim Archive: Version 2.0. Nihon Seirigaku Zasshi. J. Physiological Soc. Jpn. 31 (10), 1–40.
Clark, C. E., Miller, A., and DuPont, B. (2019). An Analytical Cost Model for Co-located Floating Wind-Wave Energy Arrays. Renew. Energy 132, 885–897. doi:10.1016/j.renene.2018.08.043
Flocard, F., Ierodiaconou, D., and Coghlan, I. R. (2016). Multi-criteria Evaluation of Wave Energy Projects on the South-East Australian Coast. Renew. Energy 99, 80–94. doi:10.1016/j.renene.2016.06.036
GB/T 18710——2002 (2002). Methodology of Wind Energy Resource Assessment for Wind Farm.Beijing: Standards Press of China.
GB/T 34910.3 — 2017 (2017). Guidelines for Marine Renewable Energy Resources Survey and Assessment —Part 3: Wave Energy. Beijing: Standards Press of China.
Gideon, R. A., and Bou-Zeid, E. (2021). Collocating Offshore Wind and Wave Generators to Reduce Power Output Variability: A Multi-Site Analysis. Renew. Energy 163, 1548–1559. doi:10.1016/j.renene.2020.09.047
Kalogeri, C., Galanis, G., Spyrou, C., Diamantis, D., Baladima, F., Koukoula, M., et al. (2017). Assessing the European Offshore Wind and Wave Energy Resource for Combined Exploitation. Renew. Energy 101, 244–264. doi:10.1016/j.renene.2016.08.010
Kamranzad, B., and Lin, P. (2020). Sustainability of Wave Energy Resources in the South China Sea Based on Five Decades of Changing Climate. Energy 210, 118604. doi:10.1016/j.energy.2020.118604
Kamranzad, B., and Takara, K. (2020). A Climate-dependent Sustainability Index for Wave Energy Resources in Northeast Asia. Energy 209, 118466. doi:10.1016/j.energy.2020.118466
Magagna, D., and Uihlein, A. (2015). Ocean Energy Development in Europe: Current Status and Future Perspectives. Int. J. Mar. Energy 11, 84–104. doi:10.1016/j.ijome.2015.05.001
Martinez, A., and Iglesias, G. (2020). Wave Exploitability Index and Wave Resource Classification. Renew. Sustain. Energy Rev. 134, 110393. doi:10.1016/j.rser.2020.110393
Muliawan, M. J., Karimirad, M., Moan, T., and Gao, Z. (2012). Stc (Spar-Torus Combination): A Combined Spar-Type Floating Wind Turbine and Large Point Absorber Floating Wave Energy Converter – Promising and Challenging. The 31st International Conference on Ocean, Offshore and Arctic Engineering, OMAE2012 conference.Rio de Janeiro, Brazil. July 1–6, 2012
Murphy, J., Lynch, K., and Serri, L. (2011). “Site Selection Analysis for Offshore Combined Resource Projects in Europe,” in Report of the Off-Shore Renewable Energy Conversion Platforms – Coordination Action (ORECCA) Project.
Planning of Zhejiang Marine Functional Area (2017). Zhejiang Provincial Development and Reform Commission.
Ribeiro, A. S., deCastro, M., Costoya, X., Rusu, L., Dias, J. M., and Gomez-Gesteira, M. (2021). A Delphi Method to Classify Wave Energy Resource for the 21st Century: Application to the NW Iberian Peninsula. Energy 235, 121396. doi:10.1016/j.energy.2021.121396
Rusu, E., and Rusu, L. (2021a). An Evaluation of the Wave Energy Resources in the Proximity of the Wind Farms Operating in the North Sea. Energy Rep. 7, 19–27. doi:10.1016/j.egyr.2021.05.058
Rusu, L., Ganea, D., and Mereuta, E. (2017). A Joint Evaluation of Wave and Wind Energy Resources in the Black Sea Based on 20-year Hindcast Information. Energy Explor. Exploitation 36 (2), 335–351. doi:10.1177/0144598717736389
Rusu, L., and Rusu, E. (2021b). Evaluation of the Worldwide Wave Energy Distribution Based on ERA5 Data and Altimeter Measurements. Energies 14 (2), 394. doi:10.3390/en14020394
Shao, M., Han, Z., Sun, J., Xiao, C., Zhang, S., and Zhao, Y. (2020). A Review of Multi-Criteria Decision Making Applications for Renewable Energy Site Selection. Renew. Energy 157, 377–403. doi:10.1016/j.renene.2020.04.137
State Energy Administration and State Oceanic Administration (2016). Measures for the Management of Offshore Wind Power Development and Construction, December 29, 2016. Beijing.
The People's Government of Zhejiang Province (2012). Office of Zhejiang Provincial Department of Natural Resources. Marine Function Zoning of Zhejiang Province (2011–2020) (2018 Revision) was Officially Released. Zhejiang Land and Resources 2018 (11), 1.
Vasileiou, M., Loukogeorgaki, E., and Vagiona, D. G. (2017). GIS-based Multi-Criteria Decision Analysis for Site Selection of Hybrid Offshore Wind and Wave Energy Systems in Greece. Renew. Sustain. Energy Rev. 73, 745–757. doi:10.1016/j.rser.2017.01.161
Wan, Y., Fan, C., Dai, Y., Li, L., Sun, W., Zhou, P., et al. (2018). Assessment of the Joint Development Potential of Wave and Wind Energy in the South China Sea. Energies 11 (2), 398. doi:10.3390/en11020398
Wan, Y., Zhang, J., Meng, J., Wang, J., and Dai, Y. (2016). Study on Wave Energy Resource Assessing Method Based on Altimeter Data-A Case Study in Northwest Pacific. Acta Oceanol. Sin. 35 (3), 117–129. doi:10.1007/s13131-016-0804-2
Wen, Y., Kamranzad, B., and Lin, P. (2022). Joint Exploitation Potential of Offshore Wind and Wave Energy along the South and Southeast Coasts of China. Energy 249, 123710. doi:10.1016/j.energy.2022.123710
Zhang, R., Jiang, B., and Sun, H. (2013). Study of Wave Energy Priority Utilization Zoning. Ocean. Technol. 32 (3), 114–117. in Chinese.
Zheng, C.-w., Li, C.-y., and Xu, J.-j. (2019). Micro-scale Classification of Offshore Wind Energy Resource --A Case Study of the New Zealand. J. Clean. Prod. 226, 133–141. doi:10.1016/j.jclepro.2019.04.082
Zheng, C.-w., Pan, J., and Li, J.-x. (2013). Assessing the China Sea Wind Energy and Wave Energy Resources from 1988 to 2009. Ocean. Eng. 65, 39–48. doi:10.1016/j.oceaneng.2013.03.006
Zheng, C. W. (2021). Dynamic Self-Adjusting Classification for Global Wave Energy Resources under Different Requirements. Energy 236, 121525. doi:10.1016/j.energy.2021.121525
Zheng, C. W., Xiao, Z. N., Peng, Y. H., Li, C. Y., and Du, Z. B. . (2018). Rezoning Global Offshore Wind Energy Resources. Renew. Energy, 129, 1–11.doi:10.1016/j.renene.2018.05.090
Keywords: marine renewable resource, co-located offshore wind and wave farms, site selection, ECMWF, Zhejiang Province
Citation: Jiang B, Ding J, Fang Y, Wu G, Wang X, Ke S, Li Y, Hou E, Zheng C, Zhou H, Wang M, Bi D and Fang F (2022) Preliminary Study on the Co-Location Offshore Wind and Wave Farms in Zhejiang Province. Front. Energy Res. 10:922072. doi: 10.3389/fenrg.2022.922072
Received: 17 April 2022; Accepted: 31 May 2022;
Published: 13 July 2022.
Edited by:
Paulo Jorge Rosa-Santos, University of Porto, PortugalReviewed by:
José Víctor Ramos, University of Porto, PortugalCarlos Pérez-Collazo, University of Vigo, Spain
Liliana Celia Rusu, Dunarea de Jos University, Romania
Copyright © 2022 Jiang, Ding, Fang, Wu, Wang, Ke, Li, Hou, Zheng, Zhou, Wang, Bi and Fang. This is an open-access article distributed under the terms of the Creative Commons Attribution License (CC BY). The use, distribution or reproduction in other forums is permitted, provided the original author(s) and the copyright owner(s) are credited and that the original publication in this journal is cited, in accordance with accepted academic practice. No use, distribution or reproduction is permitted which does not comply with these terms.
*Correspondence: Erhu Hou, aG91ZXJodUAxNjMuY29t; Chongwei Zheng, Y2hpbmFvY2Vhbnpjd0BzaW5hLmNu
 Bo Jiang
 Jie Ding1