- 1College of Electrical and Information Engineering, Changsha University of Science and Technology, Changsha, China
- 2State Key Laboratory of Power Grid Safety and Energy Conservation (China Electric Power Research Institute), Beijing, China
- 3China Electric Power Research Institute, Beijing, China
Clean and low-carbon electricity-gas integrated energy system (EGIES) is being developed rapidly in order to meet the dual-carbon target. Situation awareness can provide an early warning of operational risks to the EGIES, which is helpful for its promotion and application. In this paper, a data-driven situation awareness method of EGIES considering time series features is proposed. The state and deviation vectors of EGIES are solved at the situation perception level based on the state estimation. The recurrence plot (RP) is used at the situation comprehension level to extract the time series features of historical deviations, and the operating state of future deviations is encoded in the form of labels. A convolutional neural network (CNN) is established at the situation projection level to project the future operating state of the EGIES based on the RP of the historical deviations. A case study of EGIES coupling a 14-node power system with a 7-node gas system shows that the projection accuracy of the proposed method increases by 2.07 and 3.04% compared with the long-short term memory (LSTM) neural network and the support vector machine (SVM), respectively.
1 Introduction
The steady advancement of carbon neutrality and carbon peaking goals has resulted in the concepts of energy conservation, emission reduction and low-carbon living gradually becoming a consensus in the development of the energy field (Zeng et al., 2014; Li et al., 2018; Cheng et al., 2020; Jiang et al., 2021; Zhang et al., 2021). The electricity-gas integrated energy system (EGIES) is a new energy system, which is environmentally friendly, low-carbon and clean. It not only promotes the transformation of the energy structure, but also provides a strong support for the dual-carbon goals (Clegg and Mancarella, 2016; Wang and Bu, 2020). However, the multi-source heterogeneity of EGIES affects the economy, efficiency, safety and reliability of system operations. Achieving efficient and accurate situation awareness of EGIES is of great significance to ensure safety and reliability of its operations.
Situation awareness originated from the aviation and military fields. It has been applied in the fields of transportation, network security, and power system in recent years (Panteli and Kirschen, 2015; Xu et al., 2017; Li et al., 2018; Zhu, 2020). In the power systems, it is mainly divided into three levels: situation perception, situation comprehension and situation projection (Panteli et al., 2013; Lin et al., 2016). Situation awareness is defined as “the perception of the elements in an environment within a volume of time and space, the comprehension of their meaning, and the projection of their status in the near future”. Situation perception represents the perception of information related to key elements of the system; situation comprehension is the understanding of what the perceived data means in relation to the projection objectives, and the mining of connections in perceived data; situation projection denotes the projection of the future state of the system based on the perceived data and comprehended information.
So far, research efforts have been devoted to different levels of situation awareness in the power systems (Sayed et al., 2020; Chen et al., 2021; Fang et al., 2021). However, only a small part of the existing research work linked the three levels of situation awareness, which caused a lack of interaction and progressive logical relationship. On the other hand, most studies on situation projection focused on quantitative regression forecasting, e.g., load forecasting and wind power forecasting (Sun et al., 2019; Chen and Wang, 2021). These studies did not consider qualitative forecasting of system operation trend, which could provide an intuitive and concise display for operation and maintenance personnel. Subject to the availability of diverse and sufficient data, it is a feasible method to qualitatively evaluate and project the operation state of the system by establishing a situation indicator system. However, there are industry barriers vis-a-vis the electricity and gas aspects of the EGIES, and it is difficult to share and interconnect a large amount of data or information involving commercial privacy and confidentiality in the whole EGIES. Therefore, it is considerably hard to establish a perfect situation indicator system for situation awareness.
Meanwhile, the EGIES is more complex and diverse than the power system in terms of energy flow, characteristic dimension and time scale, which results in the generation of massive and diverse measurement data (Wang et al., 2018). The effective use and mining of hidden information in these measurement data for situation awareness is one of the key directions that needs to be explored urgently. In recent years, data-driven theory has been widely used in the electric power field. It has become one of the important means to promote the development of power systems and integrated energy systems (Zhou et al., 2016; Fu et al., 2018; He et al., 2018). The end-to-end relationship between “historical state” and “future trend” can be automatically mined and obtained by collecting raw measurement data and combining data-driven technology. This can avoid complex mechanism analysis, which provides new ideas for the application of situation awareness in EGIES.
Hence, a data-driven situation awareness method of EGIES considering time series features is proposed in this paper, which can be divided into three stages. A state estimation model based on basic measurement data is established for situation perception. The recurrence plot (RP) is used to extract the time series features of the EGIES deviation vectors for situation comprehension. A convolutional neural network (CNN) model is built to project the operation trend of EGIES for situation projection.
The remainder of this paper is organized as follows. Section 2 introduces the state estimation model of EGIES. Section 3 explains the differential comprehension of the historical and future deviation vectors of EGIES. Section 4 establishes the EGIES projection model based on CNN. Section 5 uses a case study to verify the performance of the proposed method. Section 6 concludes the paper.
2 Situation Perception of Electricity-Gas Integrated Energy System Based on State Estimation
The key to situation perception lies in the collection of topology information and measurement data, thereby realizing the extraction of state and deviation vectors. Therefore, the first step for achieving situation perception is to obtain the physical topology of nodes and branches, and subsequently use the phasor measurement unit, wide area measurement system, pressure transmitter, turbine flowmeter and other measurement devices in EGIES for acquiring measurement vectors. The measurement vectors include voltage amplitude, voltage phase angle, power, pressure, pipeline flow, etc., (Chen et al., 2021).
The measurement vectors obtained directly from the measurement devices usually suffer from the problems of measurement noise and missing measurements, resulting in poor data accuracy and insufficient comprehensiveness. Thus, these measurements cannot meet the actual operation requirements of the EGIES. Using the state estimation to filter the measurement vectors can achieve the state vectors solution, and subsequently provide accurate information for the safe and reliable EGIES operation. The state vectors include voltage amplitude, voltage phase angle and pressure. Compared with the methods in (Chen et al., 2015; Zang et al., 2019), the weighted least square method is lacking in robustness, its calculation speed is faster and meets the timeliness requirements of situation awareness. Thus, the weighted least square method is adapted to the state estimation model of EGIES, which can be written as follows:
where ze and zg are the measurement vectors of power and gas systems, respectively, he and hg are the measurement functions of power and gas systems, respectively, which are given in (Du et al., 2019; Zhang et al., 2021), xe and xg are the state vectors of power and gas systems, respectively, Re and Rg are the weight matrices of power and gas systems, respectively, and c(x) is the zero equality constraint including power constraint, voltage constraint, gas flow constraint, etc., which is given in (Du et al., 2019; Zhang et al., 2021).
The state vectors are the direct mappings to the operation state of the EGIES. The most direct sign of the abnormality of operation state is the exceeding of threshold by the state vectors. Therefore, the power system voltage amplitude and the gas system pressure are selected as the key state vectors for per unit processing. The mean absolute percentage error is used to quantify the degree of operating deviation of the EGIES, which is given by
where d is the deviation vector of EGIES, ρ is the weight coefficient, Me and Mg are the numbers of nodes in the power and gas systems, respectively, Ui and Pj are the voltage amplitude of ith node in the power system and the pressure of jth node in the gas system, and UN and PN are the rated voltage of the power system and the rated pressure of the gas system, respectively.
3 Situation Comprehension of Electricity-Gas Integrated Energy System Considering Time Series Features
Based on the situation perception, the deviation vectors of the EGIES are obtained at time t during p∼f period, t denotes an intermediate timestamp and t∈(p, f). Assuming that p is a past moment, f is a future moment, and t is the current moment, then the p∼f period can be regarded as a time domain that includes the past and the future. Hence, in time domain, the deviation vectors dp∼t and dt∼f during the p∼t and t∼f periods, respectively, can be classified into historical information (historical state) and future information (future trend), respectively.
3.1 Comprehension of Historical Deviation
The historical deviation implies the characteristics of time series changes, which affect the future operation trend of the EGIES. The RP can convert one-dimensional time series into two-dimensional images, reveal the periodicity, chaos and non-stationarity of time series, and enhance its features. It is used to extract the time series features from deviation vectors and encode them in the image form (Amiri et al., 2022). The specific steps are as follows:
3.1.1 Normalization of the Deviation Vector dp∼t
The normalization of deviation vectors dp∼t used to scale the data within the range of [0, 1] is given by
where di and
3.1.2 Phase Space Reconstruction of the Deviation Vector dp∼t
For a one-dimensional time series
where τ is the delay time, k is the embedding dimension, and Nk = N-(k-1)·τ is the number of phase spaces. In this paper, the delay time is set to zero, i.e., N timestamps correspond to N phase spaces, which avoids the selection of embedding dimension and further enhances the feature comparison between timestamps.
3.1.3 Recurrence Plot Matrix Calculation
Improper threshold selection will cause the loss of important information of the RP. Therefore, the deviation obtained by the phase space reconstruction is used to calculate the non-threshold RP matrix. For vector
where Rij is the element of the ith row and the jth column of the RP matrix, and‖
3.1.4 Generation of Recurrence Plot
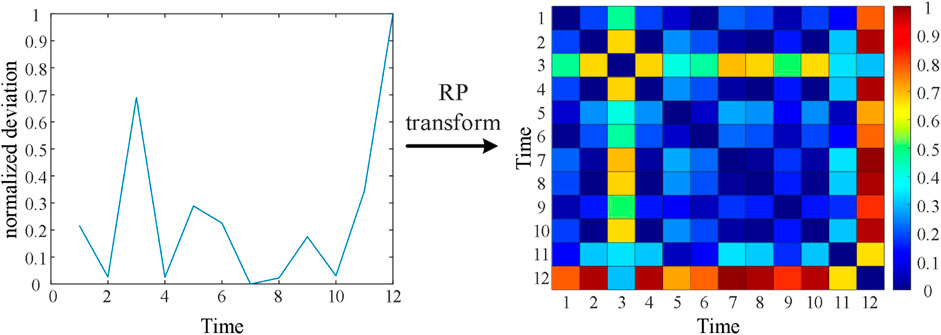
The RP matrix elements are encoded in the RGB color form, and subsequently the two-dimensional RP is plotted. Figure 1 shows the diagram of the RP encoding of the deviation vectors.
The recursion between the timestamps of the Cartesian coordinate in Figure 1 is mapped to the corresponding areas in the RP by different colors. As can be seen from Figure 1, when the Euclidean distance between the deviations of the two timestamps is farther, the color is closer to red; when the Euclidean distance between the deviations of the two timestamps is closer, the color is closer to blue. By using RP to encode and reconstruct the original one-dimensional deviation vectors, the time series features of the deviation vectors in the time domain are extracted. This step can improve the visual inspection and learning ability of the CNN model in situation projection.
3.2 Comprehension of Future Deviation
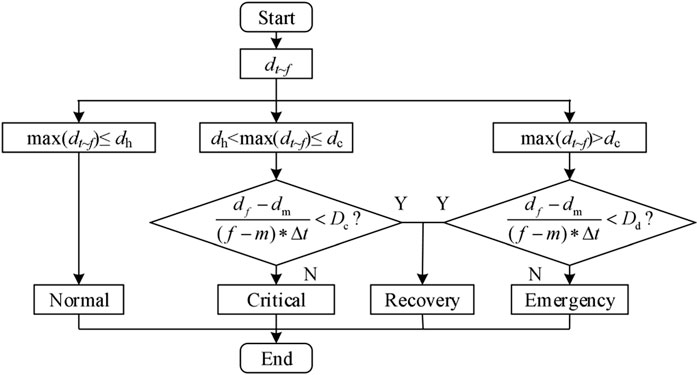
Although there is no clear definition of the operation state of the EGIES, it is closely related to the temporal change in deviation. Hence, according to the change of deviation, the operation state can be divided into four categories based on the quantitative and qualitative combined method: normal, recovery, critical and emergency.
The deviation is within the normal threshold in the normal state, whereas it is in the transition process from critical or emergency to normal in the recovery state. The deviation exceeds the normal state deviation threshold and is lower than the critical state deviation threshold in the critical state. Meanwhile, the system has a certain self-adjustment ability and it can slowly recover by itself after reaching the maximum deviation. The deviation exceeds the critical state deviation threshold in the emergency state, and consequently, the system fails and cannot recover to the normal state by itself.
Figure 2 shows the specific operation state classification process for the deviation vector dt∼f in the t∼f period. In the figure, dn is the normal state deviation threshold, dc is the critical state deviation threshold, dm is the maximum deviation in the period t∼f, Dc and Dd are the critical state fluctuation and the emergency state fluctuation thresholds, respectively, and Δt is the timestamp interval.
4 DATA-DRIVEN SITUATION PROJECTION OF ELECTRICITY-GAS INTEGRATED ENERGY SYSTEM
4.1 Basic Theory of Convolutional Neural Network
The CNN improves the multi-level perceptron with respect to two features: reducing the number of weights that speeds up the training process, and lowering the risk of overfitting. The CNN is not limited to one-dimensional data input and can receive two-dimensional image data with a higher amount of complex feature information. Therefore, it has been widely used in natural language processing, image identification, computer vision, and other fields (Mei et al., 2017; Zheng et al., 2018; Du et al., 2019). The CNN is mainly composed of convolutional layers, pooling layers, fully connected layers, drop-out layers and activation functions. The function of each layer is explained as follows:
The convolution layer traverses the input image by sliding a convolution kernel and calculating the inner product between the kernel and the local pixel information of the image. It strengthens and filters the information features, and greatly reduces the computational burden. The convolution operation can be described as
where X is the input matrix of the convolution calculation, W denotes the convolution kernel of size M×N, Y is the output matrix of the convolution calculation, and b represents the bias.
The purpose of pooling layer is to reduce the size of the two-dimensional image as much as possible, and reduce the number of parameters to avoid overfitting the model. This layer normally uses max-pooling or average pooling operations.
The activation function is usually a nonlinear function. It can enhance the nonlinear fitting and representation ability of the CNN, and effectively adapt the model to the strong nonlinearity of the EGIES (Martínez-Ceseña and Mancarella, 2019). Common activation functions include Sigmoid, Tanh and ReLU. The calculation of the ReLU function saves the computational time as it does not contain any exponential term, and consequently, the calculation efficiency can be improved during the backpropagation calculation. Therefore, ReLU is selected as the activation function, that is, given by Eq. 7 as follows:
4.2 Situation Projection Model Based on Convolutional Neural Network
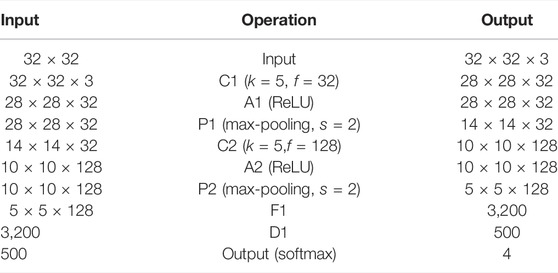
Using the deviation vectors data set over the p∼t period and the operation state label set over the corresponding t∼f period obtained by the situation comprehension in Section 3, the CNN can supervise the training and learning of RP, which can improve the classification and projection performance. In this paper, a CNN model with a total of ten layers (one input layer, two convolution layers, two activation layers, two pooling layers, one flattening layer, one fully connected layer and one output layer) is established for EGIES situation projection. Section 5 describes the selection of hyperparameters and Table 1 provides the parameters, operations, input and output of each layer of the model.
The input layer uses RP over the p∼t period and converts them into a RGB pixel matrix of size 32 × 32 × 3. Subsequently, 128 feature maps of size 5 × 5 are obtained through two convolution, activation and pooling operations. The ReLU is selected as the activation function, and the pooling layer uses the max-pooling method. The flattening layer F1 is used to compress the three-dimensional feature maps into a one-dimensional array with a length of 3,200. The information of the flattening layer is transmitted to the output layer through the fully connected layer, and the softmax classifier is used to obtain the projection result of the operation state over the t∼f period. In Table 1, k represents the size of the convolution kernels, f is the number of convolution kernels, and s is the stride.
5 Case Studies
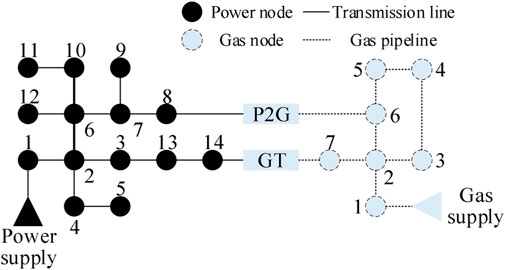
The measurement data used in this paper are collected from an EGIES, including voltage amplitude, voltage phase angle, active power, reactive power, gas pressure, and pipeline flow. As shown in Figure 3, the EGIES includes a 14-node power system and a 7-node gas system, where node 8 of the power system and node 6 of the gas system are connected by power to gas equipment, node 14 of the power system and node 7 of the gas system are connected by gas turbine. The time interval is 5 min, and the lengths of the p∼t and t∼f intervals are equal to 12 and 6, respectively. The operating conditions of different EGIES are different and, therefore, the appropriate p∼f interval value should be selected based on the historical data in applications. The measurement data include a total of 2000 groups of EGIES measurements within 90 min, where there are 500 groups each for normal, recovery, critical and emergency states, and the ratio between training and validation sets is 7:3. The training set is used to update the weight parameters of the CNN, and the validation set is used to optimize the model hyperparameters.
In order to realize the proposed situation awareness method, firstly, the measurement data is used for state estimation to obtain the state vectors and the deviation vectors; based on the comprehension of the deviation vectors, the RP sample set and the label sample set are obtained; finally, a CNN model is established, and the RP sample set is used as the input, and the label sample set is used as the output, then the situation projection model is obtained by training.
The simulated hardware platform is based on a personal computer, using an Intel (R) Core (TM) i7-9700K CPU @ 3.00 GHz processor with a memory of 16.0 GB. The CNN model is built using the Keras module in the Tensorflow framework.
5.1 Optimization of Hyperparameters
During the training process of the CNN model, it is necessary to optimize the hyperparameters to improve its performance in situation projection. The five hyperparameters: number of neurons in the convolution layer C1, number of neurons in the convolution layer C2, batch size, epoch and learning rate are optimized based on the accuracy results.
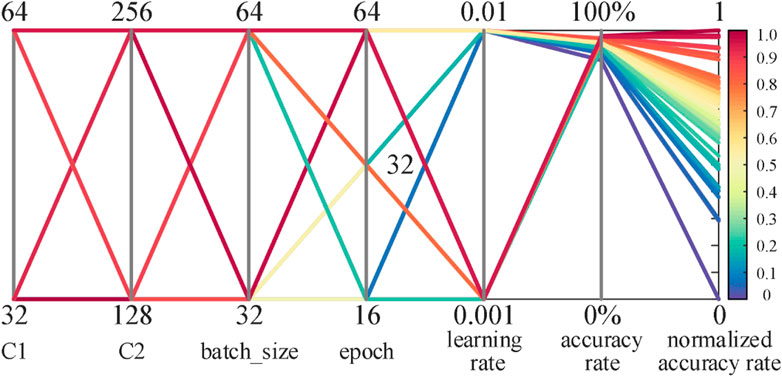
The number of neurons in the convolution layer determines the learning depth of the model and the ability to extract features from images. Batch size represents the number of samples selected for each training, which affects the optimization degree and speed of the model. Epoch is the number of times the sample set is trained, which affects the training time and fitting degree of the model. The learning rate is one of the most important hyperparameters, which controls the gradient convergence during training. An excessively large learning rate will hinder the convergence of the gradient, while an excessively small learning rate will slow down the convergence. Considering the time and calculation costs, the hyperparameters combination is optimized based on random search. Figure 4 shows the optimization of hyperparameters.
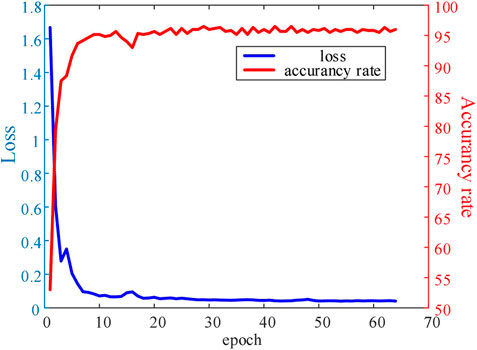
A total of 48 combinations are used for the hyperparameter configurations. In order to compare the pros and cons of configurations, the accuracy rate and normalized accuracy rate of all configurations are color-coded and shown in Figure 4. It can be observed that when the learning rate is set to 0.001, the accuracy rates of the corresponding configurations are higher than 90%, which are better than those of the configurations where the learning rate is set to 0.01. The accuracy rates of the configurations when the epoch is set to 64 are also higher than those with 16 or 32 epochs. Therefore, the model has better predictive performance when the learning rate is set to 0.001 and the epoch is set to 64. An exhaustive comparison of 48 configurations gives the optimal hyperparameter configuration as [32, 128, 64, 64, 0.001]. In this configuration, the accuracy rate is 97.90%, and the cross-entropy loss is 0.0536. Figure 5 shows the loss function and accuracy values over different epochs. It can be seen that when the epoch reaches more than 50, the model can be considered convergent, the loss function is close to 0.05, and the accuracy rate remains around 95%.
5.2 Analysis of Projection Results
In order to further analyze the performance of the proposed method, 400 groups of independent test set data are applied to the well-trained CNN model in order to achieve unbiased situation awareness. A total of 100 groups each are used for normal, recovery, critical and emergency states. Furthermore, the long-short term memory (LSTM) in deep learning and the support vector machine (SVM) in machine learning are adapted for comparison and verification. Before comparing, the parameters of LSTM and SVM are optimized. The inputs in LSTM and SVM are one-dimensional deviation vectors without RP transformation. The outputs in LSTM and SVM are the projection results of the future states.
The confusion matrix is used to visualize the results of classification projection on the test set (Chicco et al., 2021). The matrix divides the results into four categories: True Positive (TP), True Negative (TN), False Positive (FP) and False Negative (FN). In addition, four performance indicators of Accuracy Rate (AR), Precision Rate (PR), Recall Rate (RR) and Specificity Rate (SR) can be obtained based on the statistical results of the confusion matrices, which are calculated according to the following expressions:
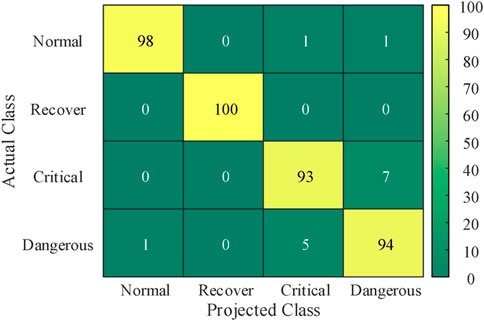
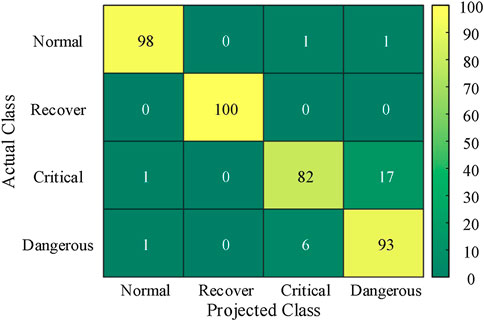
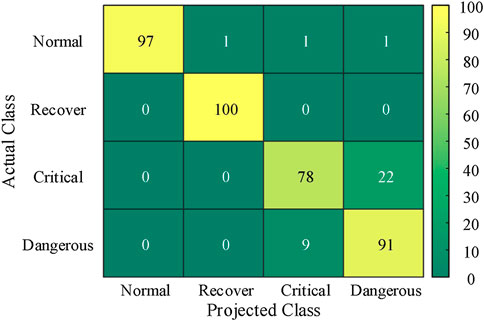
where TP represents the result that the sample belongs to a positive class and the model also recognizes it as belonging to the positive class, and TN represents the result that the sample belongs to a negative class and the model also recognizes it as belonging to the negative class. The FP represents the result that the sample belongs to a negative class but the model recognizes it as belonging to a positive class, and FN represents the result that the sample belongs to a positive class but the model recognizes it as belonging to a negative class. The projected classification results obtained by applying the three methods of CNN, LSTM and SVM on the test set are shown in Figures 6–8, respectively.
When the future operation state of the EGIES is actually normal, the historical deviations are usually within the allowable deviation range. However, the time domain features are more complex and diverse, and do not follow a single law. The CNN can extract time series features through RP feature maps, while LSTM, as a variant of recurrent neural network, also has the ability to deal with the time series data. On the other hand, SVM, as a traditional machine learning method, has difficulty in comprehending and extracting the time series relationships. Although the CNN and LSTM are more capable of time series feature extraction than the SVM, the intricate features of deviation cause the differences in feature extraction by the three methods to have a minor effect on the projection results. Therefore, Figures 6–8 show that among the 100 groups of actual normal samples, the CNN, LSTM and SVM accurately project 98, 98 and 97 groups, respectively. Thus, the projection results are almost the same with the three methods.
When the EGIES is actually in the future operation state of recovery, the historical deviations show obvious decreasing trends. In addition, the corresponding mapping is also generated along the diagonal line on the RP. The significant difference in the deviation in the time domain makes the SVM, which cannot perceive the time series differences, have a good projection performance. Hence, the CNN, LSTM and SVM all achieve accurate projection for the 100 samples that are actually recovered.
When the future operation state of the EGIES is actually critical or emergency, the historical deviations exhibit both fluctuations and increase in values, and there are slight differences in the fluctuation range and the increasing gradient. The time series features of the historical deviations in critical and emergency states are similar. Consequently, the three methods make a certain degree of cross prediction, i.e., the actual critical state is projected as emergency or the actual emergency state is projected as critical. However, the CNN accurately captures and maps the differences in amplitude and gradient through RP, and the LSTM extracts the correlation of deviations by the memory characteristic. Figures 6–8 show that the CNN, LSTM and SVM make cross projections of 13, 25 and 31 groups, respectively. The number of cross projections of CNN is significantly smaller than those of the LSTM and SVM, which verifies the accuracy and effectiveness of the proposed method.
Based on the classification projection results shown in Figures 6–8, the AR, PR, RR and SR of the three methods can be calculated using Eq. 8–11. Table 2 shows the results of these four performance indicators.
Table 2 shows that all three methods have good projection performance for the projection of normal state: the accuracy rates are maintained above 99.00%, and the differences of the same indicators between the three methods is maintained at about 1%. In the projection of recovery state, the AR, PR and SR of CNN and LSTM are higher than those of SVM. In the projection of critical and emergency states, the average AR of CNN is 96.51%, which is 4.01 and 5.96% higher than 92.50% of LSTM and 90.55% of SVM, respectively. The average AR of CNN for the projection of four operating states is 98.07%, which is 2.07 and 3.04% higher than those of LSTM and SVM, respectively. These results further verify the performance improvement of the proposed method compared with the LSTM and SVM in situation projection.
5.3 Analysis of Projection Results
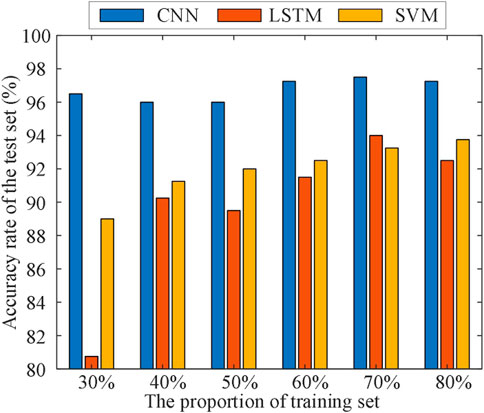
There are differences in the number of historical samples provided by different EGIES. Furthermore, the performance of data-driven models depends on the size of the training data set. The model performance will change when the size of the data set changes. Therefore, the adaptability of the proposed method in different data environments is tested by changing the proportion of the training data set in the sample set. Figures 9, 10 compare the AR for the validation and test sets of the three methods under six different training set proportions of 30, 40, 50, 60, 70 and 80%.
As Figure 9 shows, the average AR of the validation set with the CNN is 94.47% over the six different training set proportions, which is 4.58 and 4.20% higher than 90.27% of LSTM and 89.89% of SVM, respectively. Figure 10 shows that the average AR of the test set of CNN is 96.75%, which is 7.00 and 4.79% higher than 89.75% of LSTM and 91.96% of SVM, respectively. The proposed method has better projection performance under various training set proportions, which proves that it is more adaptable under different scenarios.
6 Conclusion
In this paper, a data-driven situation awareness method for EGIES operation risk warning considering time series features was proposed. The method could be divided into three levels: 1) situation perception based on state estimation, 2) situation comprehension considering time series features, 3) situation projection based on data-driven methodology. Simulation results showed that the proposed method could effectively extract the temporal features in the RP, hence its performance and situation awareness adaptability were better than those of LSTM and SVM. More importantly, the proposed method could qualitatively and intuitively display the future operation state of the EGIES, which would be helpful for the operators to comprehend the EGIES conditions and provide them guidance to make operation and maintenance decisions.
Data Availability Statement
The raw data supporting the conclusions of this article will be made available by the authors, without undue reservation.
Author Contributions
ZL and FJ contributed to the conception and design of the proposed method. All authors wrote and edited the manuscript.
Funding
Supported by Open Fund of State Key Laboratory of Power Grid Safety and Energy Conservation (China Electric Power Research Institute) (NO.YDB51202101241).
Conflict of Interest
The authors declare that the research was conducted in the absence of any commercial or financial relationships that could be construed as a potential conflict of interest.
Publisher’s Note
All claims expressed in this article are solely those of the authors and do not necessarily represent those of their affiliated organizations, or those of the publisher, the editors and the reviewers. Any product that may be evaluated in this article, or claim that may be made by its manufacturer, is not guaranteed or endorsed by the publisher.
References
Amiri, A., Samet, H., and Ghanbari, T. (2022). Recurrence Plots Based Method for Detecting Series Arc Faults in Photovoltaic Systems. IEEE Trans. Ind. Electron. 69 (6), 6308–6315. doi:10.1109/tie.2021.3095819
Chen, B., and Wang, Y. (2021). Short-term Electric Load Forecasting of Integrated Energy System Considering Nonlinear Synergy between Different Loads. IEEE Access 9, 43562–43573. doi:10.1109/ACCESS.2021.3066915
Chen, Q., Yang, D., Wang, Y., Rehtanz, C., and Pandžić, H. (2021). Robust State Estimation of Electricity‐gas‐heat Integrated Energy System Based on the Bilinear Transformations. IET Gener. Transm. & Distrib. 15 (1), 149–163. doi:10.1049/gtd2.12037
Chen, Y., Liu, F., Mei, S., and Ma, J. (2015). A Robust WLAV State Estimation Using Optimal Transformations. IEEE Trans. Power Syst. 30 (4), 2190–2191. doi:10.1109/tpwrs.2014.2358452
Cheng, Y., Zhang, N., Zhang, B., Kang, C., Xi, W., and Feng, M. (2020). Low-carbon Operation of Multiple Energy Systems Based on Energy-Carbon Integrated Prices. IEEE Trans. Smart Grid 11 (2), 1307–1318. doi:10.1109/tsg.2019.2935736
Chicco, D., Starovoitov, V., and Jurman, G. (2021). The Benefits of the Matthews Correlation Coefficient (MCC) over the Diagnostic Odds Ratio (DOR) in Binary Classification Assessment. IEEE Access 9, 47112–47124. doi:10.1109/access.2021.3068614
Clegg, S., and Mancarella, P. (2016). Integrated Electrical and Gas Network Flexibility Assessment in Low-Carbon Multi-Energy Systems. IEEE Trans. Sustain. Energy 7 (2), 718–731. doi:10.1109/tste.2015.2497329
Du, Y., Li, F., Li, J., and Zheng, T. (2019). Achieving 100x Acceleration for N-1 Contingency Screening with Uncertain Scenarios Using Deep Convolutional Neural Network. IEEE Trans. Power Syst. 34 (4), 3303–3305. doi:10.1109/tpwrs.2019.2914860
Du, Y., Zhang, W., and Zhang, T. (2019). ADMM-based Distributed State Estimation for Integrated Energy System. CSEE J. Power Energy Syst. 5 (2), 275–283. doi:10.17775/cseejpes.2019.00400
Fang, Z., Lin, Y., Song, S., Li, C., Lin, X., and Chen, Y. (2021). State Estimation for Situational Awareness of Active Distribution System with Photovoltaic Power Plants. IEEE Trans. Smart Grid 12 (1), 239–250. doi:10.1109/tsg.2020.3009571
Fu, X., Li, G., Zhang, X., and Qiao, Z. (2018). Failure Probability Estimation of the Gas Supply Using a Data-Driven Model in an Integrated Energy System. Appl. Energy 232, 704–714. doi:10.1016/j.apenergy.2018.09.097
He, X., Chu, L., Qiu, R. C., Ai, Q., and Ling, Z. (2018). A Novel Data-Driven Situation Awareness Approach for Future Grids-Using Large Random Matrices for Big Data Modeling. IEEE Access 6, 13855–13865. doi:10.1109/access.2018.2805815
Jiang, F., Peng, X., Tu, C., Guo, Q., Deng, J., and Dai, F. (2021). An Improved Hybrid Parallel Compensator for Enhancing PV Power Transfer Capability. IEEE Trans. Ind. Electron., 1. doi:10.1109/TIE.2021.3121694
Li, Y., Zou, Y., Tan, Y., Cao, Y., Liu, X., Shahidehpour, M., et al. (2018). Optimal Stochastic Operation of Integrated Low-Carbon Electric Power, Natural Gas, and Heat Delivery System. IEEE Trans. Sustain. Energy 9 (1), 273–283. doi:10.1109/tste.2017.2728098
Lin, J., Wan, C., Song, Y., Huang, R., Chen, X., Zong, Y., et al. (2016). Situation Awareness of Active Distribution Network: Roadmap, Technologies, and Bottlenecks. CSEE J. Power Energy Syst. 2 (3), 35–42. doi:10.17775/CSEEJPES.2016.00033
Martínez-Ceseña, E. A., and Mancarella, P. (2019). Energy Systems Integration in Smart Districts: Robust Optimisation of Multi-Energy Flows in Integrated Electricity Heat and Gas Networks. IEEE Trans. Smart Grid 10 (1), 1122–1131. doi:10.1109/TSG.2018.2828146
Mei, S., Ji, J., Hou, J., Li, X., and Du, Q. (2017). Learning Sensor-specific Spatial-Spectral Features of Hyperspectral Images via Convolutional Neural Networks. IEEE Trans. Geosci. Remote Sens. 55 (8), 4520–4533. doi:10.1109/tgrs.2017.2693346
Panteli, M., Crossley, P. A., Kirschen, D. S., and Sobajic, D. J. (2013). Assessing the Impact of Insufficient Situation Awareness on Power System Operation. IEEE Trans. Power Syst. 28 (3), 2967–2977. doi:10.1109/tpwrs.2013.2240705
Panteli, M., and Kirschen, D. S. (2015). Situation Awareness in Power Systems: Theory, Challenges and Applications. Electr. Power Syst. Res. 122, 140–151. doi:10.1016/j.epsr.2015.01.008
Sayed, A. R., Wang, C., and Bi, T. (2019). Resilient Operational Strategies for Power Systems Considering the Interactions with Natural Gas Systems. Appl. Energy 241, 548–566. doi:10.1016/j.apenergy.2019.03.053
Sun, M., Feng, C., and Zhang, J. (2019). Conditional Aggregated Probabilistic Wind Power Forecasting Based on Spatio-Temporal Correlation. Appl. Energy 256, 113842. doi:10.1016/j.apenergy.2019.113842
Wang, D., Liu, L., Jia, H., Wang, W., Zhi, Y., Meng, Z., et al. (2018). Review of Key Problems Related to Integrated Energy Distribution Systems. Csee Jpes 4 (2), 130–145. doi:10.17775/cseejpes.2018.00570
Wang, Q., and Bu, S. (2020). Deep Learning Enhanced Situation Awareness for High Renewable‐penetrated Power Systems with Multiple Data Corruptions. IET Renew. Power Gener. 14 (7), 1134–1142. doi:10.1049/iet-rpg.2019.1015
Xu, G., Cao, Y., Ren, Y., Li, X., and Feng, Z. (2017). Network Security Situation Awareness Based on Semantic Ontology and User-Defined Rules for Internet of Things. IEEE Access 5, 21046–21056. doi:10.1109/access.2017.2734681
Zang, H., Geng, M., Xue, M., Mao, X., Huang, M., Chen, S., et al. (2019). A Robust State Estimator for Integrated Electrical and Heating Networks. IEEE Access 7, 109990–110001. doi:10.1109/access.2019.2933525
Zeng, B., Zhang, J., Yang, X., Wang, J., Dong, J., and Zhang, Y. (2014). Integrated Planning for Transition to Low-Carbon Distribution System with Renewable Energy Generation and Demand Response. IEEE Trans. Power Syst. 29 (3), 1153–1165. doi:10.1109/tpwrs.2013.2291553
Zhang, T., Zhang, W., Zhao, Q., Du, Y., Chen, J., and Zhao, J. (2021). Distributed Real-Time State Estimation for Combined Heat and Power Systems. J. Mod. Power Syst. Clean. Energy 9 (2), 316–327. doi:10.35833/mpce.2020.000052
Zheng, Z., Yang, Y., Niu, X., Dai, H.-N., and Zhou, Y. (2018). Wide and Deep Convolutional Neural Networks for Electricity-Theft Detection to Secure Smart Grids. IEEE Trans. Ind. Inf. 14 (4), 1606–1615. doi:10.1109/tii.2017.2785963
Zhou, K., Fu, C., and Yang, S. (2016). Big Data Driven Smart Energy Management: From Big Data to Big Insights. Renew. Sustain. Energy Rev. 56, 215–225. doi:10.1016/j.rser.2015.11.050
Keywords: situation awareness, data-driven, electricity-gas integrated energy system, convolutional neural network, recurrence plot
Citation: Lin Z, Jiang F, Luo Y, Liu K and Zhang X (2022) Data-Driven Situation Awareness of Electricity-Gas Integrated Energy System considering Time Series Features. Front. Energy Res. 10:921296. doi: 10.3389/fenrg.2022.921296
Received: 15 April 2022; Accepted: 12 May 2022;
Published: 31 May 2022.
Edited by:
Liansong Xiong, Nanjing Institute of Technology (NJIT), ChinaReviewed by:
Gautam Kumar, San Jose State University, United StatesZhixiang Zou, Southeast University, China
Rongwu Zhu, Harbin Institute of Technology, China
Copyright © 2022 Lin, Jiang, Luo, Liu and Zhang. This is an open-access article distributed under the terms of the Creative Commons Attribution License (CC BY). The use, distribution or reproduction in other forums is permitted, provided the original author(s) and the copyright owner(s) are credited and that the original publication in this journal is cited, in accordance with accepted academic practice. No use, distribution or reproduction is permitted which does not comply with these terms.
*Correspondence: Fei Jiang, amlhbWc4NTUyMUAxMjYuY29t
 Zhengyang Lin
 Fei Jiang
 Yongheng Luo1,2
 Xinhe Zhang