 Xianbo Meng
 Yalou Li1
- 1China Electric Power Research Institute, Beijing, China
With the rapid development of urban power grids, distributed renewable energy sources and adjustable loads have increased significantly, resulting in more complex operation conditions, increasing the difficulty of power flow calculations. The usage of artificial intelligence technology to assist in calculating power flows for large-scale urban grids has a wide range of application prospects. It is currently difficult to generate enough grid operation database with controlled distribution for artificial intelligence (AI) method research. Data is one of the important factors affecting the performance of deep learning algorithms, and the lack of research on data distribution characteristics also hinders the performance of deep learning algorithms. The distributional characteristics of data sets in high-dimensional feature spaces are difficult to represent and measure, and the algorithm design process is prone to encounter curse of dimensionality. This paper proposed a novel method for generating databases to improve the solving efficiency of data-driven power flow calculation problems. The proposed method removes samples based on the characteristics of data distribution. It constructs two databases, namely the blue noise distribution database and the variable density boundary enhanced distribution database. Compared with the classical stochastic sampling database, the proposed boundary-enhanced variable density (BEVD) database has significantly improved the judgment accuracy of power flow convergence. Finally, the China Electric Power Research Institute-36 (CEPRI-36) bus system is used to verify the effectiveness of the proposed method. The judgment accuracy was improved by 2.91%–9.5%.
1 Introduction
As the complexity of power grid operation increases, new power systems’ safe and stable operation is facing severe challenges. Traditional state sensing and operation control technologies are challenging. Artificial intelligence (AI) technology is increasingly required to participate in power grid security and stability analysis. At present, the application research of artificial intelligence technology in power system analysis has been gradually carried out (Shi et al., 2020; Wang et al., 2021), and it has become an inevitable trend to use big data and deep learning technology to assist and supplement traditional time-domain simulation methods. The training and prediction effects of deep learning are highly dependent on sufficient and reasonable datasets (Sun et al., 2017). Among them, supervised learning, as the most mature research branch, is highly dependent on large-scale labelled datasets and requires that each sample contains labelled information. In power systems, the research of database distribution and generation methods have always been a relatively weak link in related research. When migrating deep models and learning algorithms that have performed well in other fields to the power system analysis, the primary problem is the data problem (Zhang et al., 2021).
The scope of application of data problem-solving methods is affected by data acquisition, which can be divided into actual acquisition and simulation. In some tasks, acquisition can only obtain samples, and adjusted or synthesized samples are primarily meaningless. Such tasks can only maximize the sample capacity to improve the generalization ability of the depth model, but the marginal benefit of its enhancement gradually decreases (Joulin et al., 2016) and the enhancement efficiency is low, and it is prone to the class imbalance problem (Japkowicz and Stephen, 2002; He and Garcia, 2009), which also leads to the decrease of the generalization ability of the deep model. In some other tasks, samples can only be supplemented by minor adjustments of a single sample, such as in the image field. Adjustments to databases in the image domain are called data augmentation techniques (Cubuk et al., 2018), including rotation, translation, cropping, and fine-tuning of colours for a single image sample.
More general approaches include simple resampling techniques, such as undersampling and random over-sampling (ROS) (Batista et al., 2004), which do not add new samples to the database. Still, other tasks, where the simulation samples are valid in a particular area, can apply some data synthesis methods, such as the SMOTE (Synthetic Minority Oversampling Technique) (Chawla et al., 2002) algorithm, the ADASYN (Adaptive syn-thetic sampling) (He et al., 2008) algorithm, and the mixup algorithm (Zhang et al., 2017). Reference (Tan et al., 2019) uses the Generative Adversarial Networks (GAN) method to generate a database with a similar distribution to the original data and extract unstable samples to supplement the original sample set, which can quickly adjust the class ratio. However, the above sample supplementation methods are all based on existing samples, and the reconstructed database does not change the cover but only changes the class ratio. In the literature (Chen et al., 2019), a grid simulation sample generation method based on the LSTM (Long short-term memory) algorithm was proposed, which achieved good results in automatic sample generation and improved the efficiency of simulation sample generation but did not consider the sample distribution characteristics, which made it difficult to evaluate the generated sample set.
For power systems, data can be obtained either through measurement or simulation. The continuous power flow method (Chiang et al.) shows that samples extending continuously beyond the acquisition range are also meaningful in power grid analysis. Therefore, the collected data can be effectively supplemented with simulation-generated data for grid analysis applications. The calm conditions allow more operation space when constructing the database, and the room for improving the quality of the database is also larger. For such tasks, improving the performance of machine learning algorithms by tuning databases rather than tuning model parameters has become a new research direction known as “data-centric machine learning” (Alvarez-Melis and Fusi, 2020). Research has been carried out on the problem of solving partial differential equations satisfying the conditions for sampling methods to improve the generalization ability of the model (Tang et al., 2021). However, in power grid applications, research on high-quality database generation methods is still very rare. The research on data problems has become a critical technical problem restricting the application of deep learning methods in power grid analysis, which needs to be improved and solved urgently. Because of this, the blue noise sampling in computer graphics (Dippé and Wold, 1985; Cook, 1986; Yuksel, 2015) is borrowed in this paper to enhance the quality of the database from the perspective of its distributional characteristics, and a sample generation method that considers distributional characteristics in a high-dimensional feature space is implemented using a weighted sample elimination method. For deep learning methods, whether the database distribution characteristics are better or worse is reflected in the model’s generalization performance after training. The task selected in this paper is convergence discrimination of power flow calculation. Using deep learning to judge the convergence of power flow calculation is a classification process. The trained deep model classifies the grid operation samples as feasible or not. The model can be regarded as an implicit representation of the boundary of the feasible region of power flow (Hu et al., 2017). Fitting the boundary of the feasible region is the basis for subsequent power system analysis and planning.
In this paper, for the first time, the distribution characteristics of the database suitable for the task of convergence discrimination of grid tide calculation are analyzed, the sampling rules of high-dimensional blue noise and BEVD under the framework of the elimination method are proposed, and sampling in high-dimensional feature space considering the distribution properties is realized. Finally, the CEPRI36 node model is used to verify the effectiveness of the database generation method and the correlation between the database distribution characteristics and the generalization performance of the deep learning method. The experiments specifically verify two conclusions.
1) The distribution characteristics of the dataset do have an impact on the generalization performance of the deep learning algorithm, and that the randomly generated database with the lowest generation cost is not the optimal distribution characteristic, so it is meaningful to investigate the distribution characteristics of the database.
2) It is verified that the BEVD distribution characteristics proposed for the classification problem with attention to boundaries have a positive impact on the generalization performance of deep learning algorithms.
2 Distribution Characteristics of Existing Databases and Target Distribution Characteristics
The database required for artificial intelligence methods is composed of samples, which are a collection of features that have been quantified. These features are collected from some objects or tasks that need to be processed. The sample is usually represented as a vector
where N is the number of nodes in the system. The power flow calculation process is to specify one part of the features and find another part of the features through the power flow equations. Usually, the input features are the node injection power, that is, the active power and reactive power of the PQ node, and the active power and voltage of the PV node. Therefore, the number of feature values, i.e., the dimensionality of the feature space, is two times the number of nodes. Whether the power flow calculation can converge to a feasible solution is the label of this task, and the label and feature together constitute a sample required for supervised learning. Specifically, the sample is labelled as convergent if the remaining values can be obtained by computing the power flow equations, and conversely, the sample is labelled as non-convergent if the power flow equations cannot be solved by the computational program.
From a geometric point of view, a sample can be regarded as a data point in a high-dimensional feature space, and a sample set is a point cloud in a high-dimensional feature space. The distribution characteristic of the database is the distribution characteristic of the sample point cloud. This paper’s research on distributional properties aims to improve the generalization ability of deep learning methods. In the task of convergence discrimination of power flow calculation, the generalization ability is reflected in the discrimination accuracy of the model to the test set. In the following, the distribution characteristics of the existing database are analyzed from a specific task. Based on this, a potentially better distribution characteristic is proposed as the goal of the generation method in this paper.
2.1 Analysis of the Distribution Characteristics of Existing Databases
The existing power system operation data are mainly obtained based on offline simulation or online collection. The original online and offline databases cannot meet the requirements of deep learning. Specifically, the online analysis data are collected under the actual operation condition, which constitutes a large amount of sample data but is unevenly distributed, thus showing the characteristics of many similar samples with low importance; the offline analysis data are obtained under the manually adjusted extreme operation mode, which constitutes a sample with solid typicality. However, the data volume is small, and it is challenging to cover all the typical working conditions of the grid. The distribution of samples consisting of two types of data in the operational feature space is shown in Figure 1.
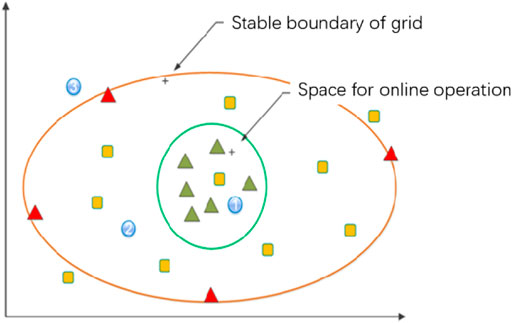
FIGURE 1. illustration on grid operation sample sets.
The red triangle represents the offline analysis sample, the green triangle represents the online analysis sample, and the yellow squares represent samples that need replenishment. The operation space is divided into three regions by two lines: the green line indicates the boundary of online operation, and the resulting region one is the online operation region; the red line shows the boundary of stable operation of the grid, and the region three outside the boundary indicates the characteristic region of infeasibility or fault instability; the middle region two indicates the characteristic region where online operation does not occur, but the stable operation is possible. The samples in region two and region three provide critical information in the tasks related to the stability boundary, so the corresponding sample supplement operations need to be done.
2.2 Blue Noise Distribution
In computer graphics, the blue noise distribution is recognized as the best distribution property.
As shown in Figure 2, the left figure shows the point set formed by blue noise sampling, and the right figure shows the point set formed by random sampling. Many researchers default to random sampling as a form of uniform sampling; in fact, pure randomness does not give the desired results, and points tend to clutter the region and leave blank space, while blue-noise sampling makes the sample points uniform as possible. Assuming that each sample point can represent the information in a certain range, the blue noise distribution can cover a larger feature space. In contrast, the distribution formed by random sampling shows the characteristics of some regions are blank while some other regions are denser in points. The online data of the power grid presents a more heterogeneous distribution characteristic. Many duplicate samples are represented in the feature space as a dense cloud of points in a region. At the same time, there are no non-converging samples in the online data, so the region of non-convergence in the feature space is blank. In this paper, the blue noise distribution characteristic refers to the distribution characteristic in the high-dimensional space. Since the configurable number of samples in the feature space is much larger than the usually used sample set capacity as the dimensionality grows, forming a significant sparsity, the blue noise characteristic referred to in this paper cannot cover the entire feature space uniformly but can only ensure that no two sample points are too close to each other. Under the above assumptions, the blue noise distribution is still a distribution characteristic covering the largest feature space range with the same sample size.
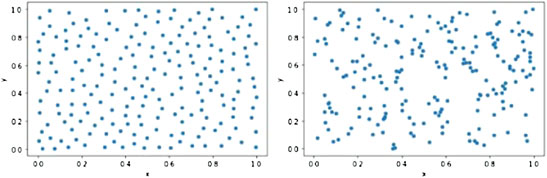
FIGURE 2. Blue noise sampling and stochastic sampling in the two-dimensional plane.
2.3 Boundary-Enhanced Variable Density Distribution
Unlike the classical classification problem in computer vision, this task is more concerned with the situation near the boundary between classes. Specifically, the task of power flow solvable discrimination is consistent with the definition of a binary classification problem. The input feature x of the database is the node injected power of the grid. The class label y of the output is the presence or absence of a solution. And the performance metric is the accuracy of the discrimination, where the DL model classifies the input represented by x to the output represented by y.
However, unlike the classical binary classification problem, in the task of power flow solvable discrimination, the input features x moves continuously toward another class without passing through the other class, and there is a clear boundary between the two classes. In contrast, in the classical classification problem of computer vision, input features x belonging to one class movecontinuously toward another class, usually passing through a region that belongs to neither class 1 nor class 2, and the samples in this region are also considered as invalid samples and discarded. For example, identify whether the picture is of a “cat” or a “dog”. The input feature X moves from the “cat” class to the “dog” class, passing through the “non-cat” and “non-dog” classes, which do not usually appear in the database either. Thus, a more precise interpretation of the physical meaning of the task is formed: fitting the viable domain boundary.
The deep learning model makes sense of the task from the data and acquires knowledge. A database that better meets the requirements of this task should provide more boundary information. There should be more sample points near the boundary, fewer samples far from the boundary, and the distribution characteristics of this database are referred to as BEVD.
3 Database Generation Methods Consider-ing Distribution Characteristics
This paper implements the database generation method considering the distribution characteristics by the weighted sample elimination method. This section introduces the definition and algorithmic process of the weighted sample elimination method. Then the rules for implementing each of the two distributions proposed in the previous section in the framework of the elimination method, i.e., the weight calculation formula, are designed.
3.1 Weighted Sample Elimination Algorithm
The algorithm that takes a set of samples as input and selects a subset as output is sample elimination. The method of assigning weights to all samples and eliminating the samples with the highest weights until the target number of samples is reached is called weighted sample elimination. The weighted sample rejection method is an algorithmic framework that can generate databases with different distribution characteristics by replacing the core rules. In other words, for sampling tasks targeting different distribution characteristics, the workflow of the elimination method is the same, and the only difference is the design of the weighting formula that determines the elimination order. The core idea of the algorithm is to guarantee the overall distribution characteristics of the sample point set by ensuring its local characteristics so that the elimination rule only needs to consider the nearby region of each sample point, which means that the weight calculation is only relevant to the sample points in its nearby region. Therefore, an efficient algorithm implementation requires two relatively common data structures: a spatial division structure for quickly finding the neighboring samples and a priority queue for selecting the sample with the highest weight. In the implementation of this paper, the kd-tree and the heap are used, respectively, and the detailed steps of the algorithm are shown in the following Figure 3. The first three operations are preparing the input terms of the algorithm, including the generation of the original database and the calculation of the parameters, the former of which requires the use of a power system simulation program. The middle two operations are the preparation of the algorithm and, finally, the loop operation of eliminating samples. The weight value of each sample is formed by the joint contribution of other points in the range, which is calculated as follows.
where wi denotes the weight of sample i, wij denotes the weight contributed by each sample in the range to sample i, and the search range is a spherical region with sample point si as the center and radius r, and n is the number of other sample points in this range. The formula for wij reflects the elimination rule and is given in the next section.
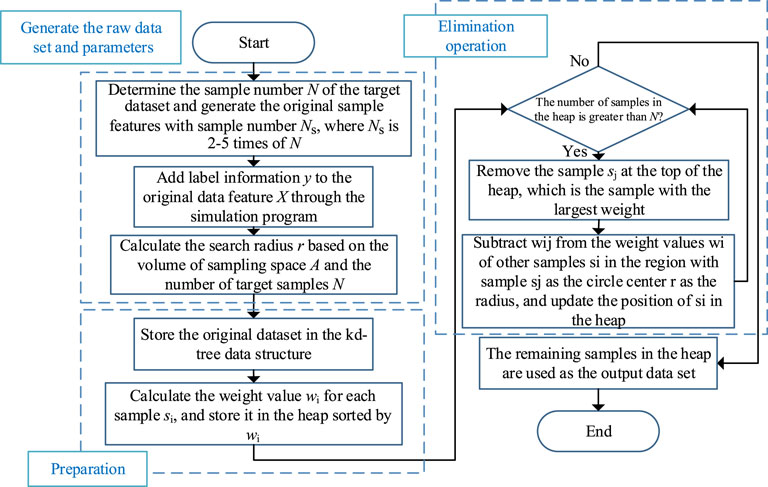
FIGURE 3. Algorithm flow chart of weighted sample elimination.
When a sample is eliminated, only the weights of a few samples within its search range need to be adjusted, which means that the weights wij contributed by two sample points to each other are subtracted, so the computational complexity is significantly reduced. To further optimize the algorithm execution speed, the hardware parallel acceleration method provided by the tbb library is introduced in the kd-tree construction process. The various data structures and hardware accelerations mentioned above allow the algorithm to be practically applied in a limited high-dimensional space without suffering the curse of dimensionality.
3.2 Design of Weighting Formula for Blue Noise Sampling
The blue noise distribution in the high-dimensional feature space is a distribution that keeps no two sample points too close to each other, such that duplicate or similar samples can be eliminated under such a rule. The blue noise database covers the largest range in the feature space or has the largest amount of information for the same sample size. Here, the sample point distance represents the similarity between two samples, which is the similarity between two operation methods for the grid operation sample. The distance between two sample input features is in vector form in practical calculation, such as the distance between sample Xi[xi1,xi2,…,xin] and sample Xj[xj1,xj2,…,xjn] is calculated by the formula
The formula for calculating the weight function wij can be expressed as
Where,
where A2 and A3 are the area and volume of the sampling domain, N is the number of target samples.
In higher dimensions we use a conservative estimate for rmax,d with d > 3, assuming that the hypervolume of the domain Ad can be completely filled with hyperspheres with no overlap. Note that this assumption causes overestimation of the rmax values. The hypervolume Vd of a hypersphere with radius r is
The above scanning radius is also referred to as the maximum Poisson disc radius in Poisson disc sampling.
3.3 Design of Weighting Formula for Boundary-Enhanced Variable Density Sampling.
Traditional variable density sampling requires specifying the interval location and density. In contrast, the location is the area near the boundary in this task. The explicit representation of the boundary is the result of power flow calculation convergence discrimination, which cannot be known in advance. Obtaining a more accurate representation of the boundary requires a higher density of sampling near the boundary, and sampling near the boundary requires information about the location of the boundary, which is the main difficulty of the problem. In this paper, we use the label information and the distance information between sample points to make a judgment on the location of the sample points where the distance between sample points represents the similarity between two samples, and for grid operation samples, it can represent the similarity between two operation states. The distance of two samples in this paper is calculated using vector operation representation form, such as sample Xi = [xi1,xi2,...,xin] and sample Xj = [xj1,xj2,...,xjn] are calculated as
The weight of the mutual contribution between the two samples is calculated by the formula:
where yi and yj are the label value of the samples and
The purpose of this is to make the effect of samples with different classes tend to retain the sample more, and the more samples with different classes in the range and the closer the distance, the more that sample point should be retained. As shown in Figure 4 below, the dot’s color indicates the class, and the circle indicates the scanned area of the three sample points, where the same class surrounds the sample point s1, and its weight value w1 is the maximum value of 0. s2 and s3 sample points contain sample points of different classes within the scanned area. The sample points of different classes around s2 are more and closer, so their weight values will be smaller, which means that they are retained with the highest priority.
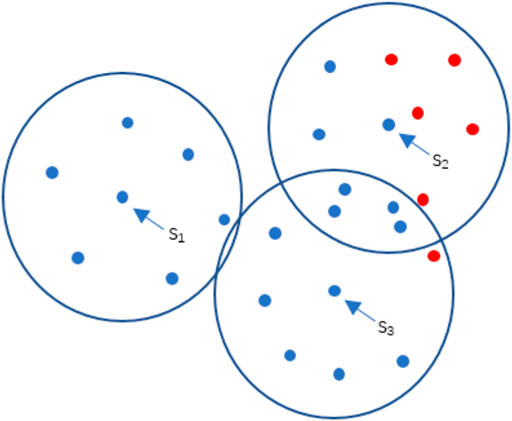
FIGURE 4. Schematic of the rule of BEVD sampling.
Since it is difficult to visualize the high-dimensional feature sample set, the morphology of the variable density distribution characteristics is demonstrated here by a 2-dimensional arithmetic example, as shown in Figure 5. The two images to the left of the arrow are the algorithm’s input database and output database, respectively. The color is the label information, which indicates the class to which the samples belong. The algorithm prioritizes eliminating sample points far from the boundary, thus forming BEVD distribution characteristic, which characterizes the data as more sample points near the boundary and a smaller number of sample points in the region far from the boundary. The right side of the arrow is the probability density heat map of the output database, which can reflect the target distribution characteristics more intuitively. The color scale on the right side indicates the number of samples in the region. The brighter it is, the more samples there are, and the distribution characteristics show a higher density near the boundary between classes.
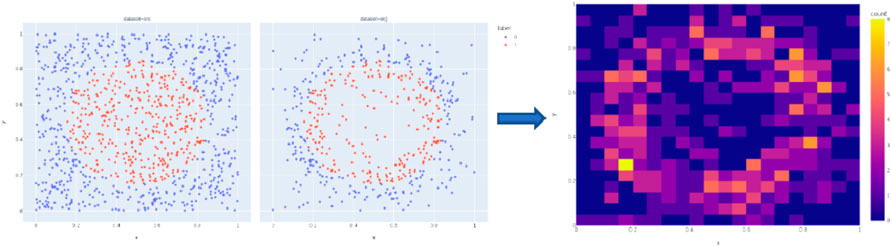
FIGURE 5. Input/output of the algorithm in 2D arithmetic and Density heat map of BEVD sampling results.
4 Databases Quality Comparison Method
In this paper, the study of database distribution characteristics aims to improve the performance of deep models, so the quality of databases cannot be compared only from some statistical characteristics of databases but needs to be put into the complete training-testing process of deep learning. The ability to train a model with higher discriminative accuracy is the indicator to evaluate the database distribution characteristics.
The specific comparison method is shown in Figure 6 below. The databases to be compared are used as training sets. The same deep network structure is trained. The same learning algorithm is used to update the parameters in the network. The training result models corresponding to the training set are obtained, and then the same test set is evaluated to obtain the discrimination accuracy of each model. The difference in database quality in this paper is only reflected in the distribution characteristics of the database, so the sample size should be kept consistent when used as the training set.
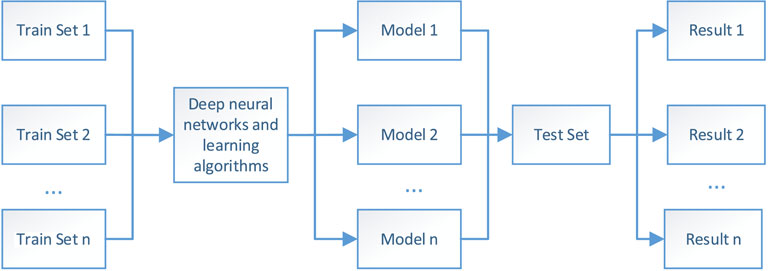
FIGURE 6. Overall diagram of database comparison method.
The confusion matrix generally represents the test results of the binary classification problem, as shown in Table 1, where m, n represents the true number of samples in category one and category 2, respectively, and s, t represents the number of samples predicted to be in two categories in the test classification; w is the sum of all samples; a, b represent the number of samples correctly classified and c, d represent the number of samples incorrectly classified. From the confusion matrix, it can be directly observed which class of samples the problem occurs in the discriminations.
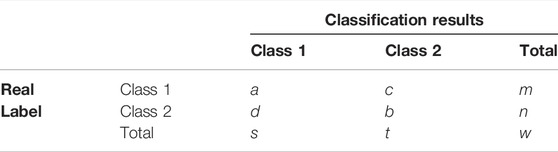
TABLE 1. Confusion matrix of the two-category task.
A more detailed analysis is possible from the confusion matrix, which is divided into the following three indicators.
Accuracy is the proportion of correct predictions among the total number of cases examined. The formula for quantifying binary accuracy is:
Precision is for classification results and is defined as the probability that all samples predicted to be of a certain class have a real label of that class.
Recall is for real labels and is defined as the probability that all samples that are actually of a class are classified as samples of that class.
5 Experimental Verification
5.1 Case Introduction
The grid model used in this paper is CEPRI36, and the specific structure is shown in Figure 7, in which some nodes are connected to capacitors or reactors not involved in regulation. There are 18 nodes involved in the regulation of generating units or loads. The nodes inject power as input feature values, for a total of 36 variables, i.e., the sample contains a feature dimension of 36 dimensions.
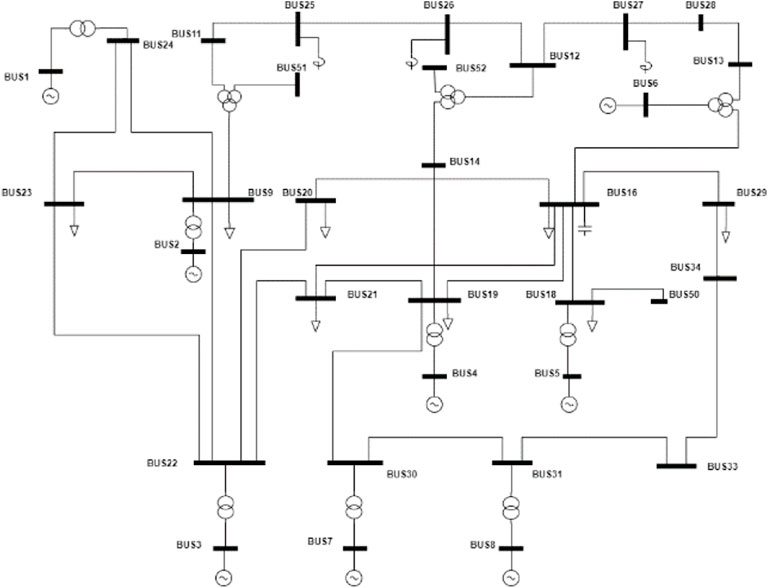
FIGURE 7. CEPRI36 grid model topology connection diagram.
The original database generation method required for the weighted sample rejection method: The feature values are formed by randomly specifying the nodes to inject power and dynamic balance pre-processing. The power flow calculation program automatically generates the label information based on the feature values. The resulting original database contains 15,000 samples. THE WEIGHTED ELIMINATION METHOD GENERATED a BEVD database of 5000 samples and a blue noise database of 5000 samples, respectively; the comparison group randomly sampled 5000 samples from the original database. The above three subsets of the original database are used as the train set in the experiment. The test set contains 2000 samples different from the original database, of which 1000 samples each for the two classes of convergence and non-convergence. Two types of deep learning models are selected.
Model 1: Multilayer Perceptron Model (MLP). The MLP is a forward-structured artificial neural network that maps a set of input vectors to output vectors and consists of multiple layers of nodes, each fully connected to the next layer. In addition to the input nodes, each node is a processing unit with a nonlinear activation function.
Model 2: Convolutional neural network (CNN). CNN contains two convolutional layers and two fully connected layers. Each node is a processing unit with a nonlinear activation function except the input node.
The experimental environment of the database generation program is 3.30Gis Hz, the CPU is AMD Ryzen9 5900 HS, and the kd-tree construction process calls tbb to achieve 8-core parallel acceleration, which takes less than 1 min to generate 5000 samples from 15000 samples elimination, which can meet the practical application.
The weighted elimination algorithm is implemented in C++ to ensure the performance; the deep learning algorithm is implemented through the pytorch framework.
5.2 Results and Discussion
The confusion matrix of the experimental results is shown in Figure 8. Combining different databases and deep models forms six confusion matrixes of model test results. According to the combination of different databases and depth models to form six sets of confusion matrices of model test results, where the column direction of each confusion matrix represents the model’s predicted class, and the row direction represents the real class to which the samples belong. Class 0 in the figure is convergence, and class 1 is non-convergence. The color shade of each cell of the matrix indicates the number of samples. The discrimination accuracy of the deep model trained by the BEVD database is significantly higher than the other two in the non-convergence class. And the case of the blue-noise database compared with the random sampling database is that the blue-noise database is better under the MLP model and the random sampling database is better under the CNN model.
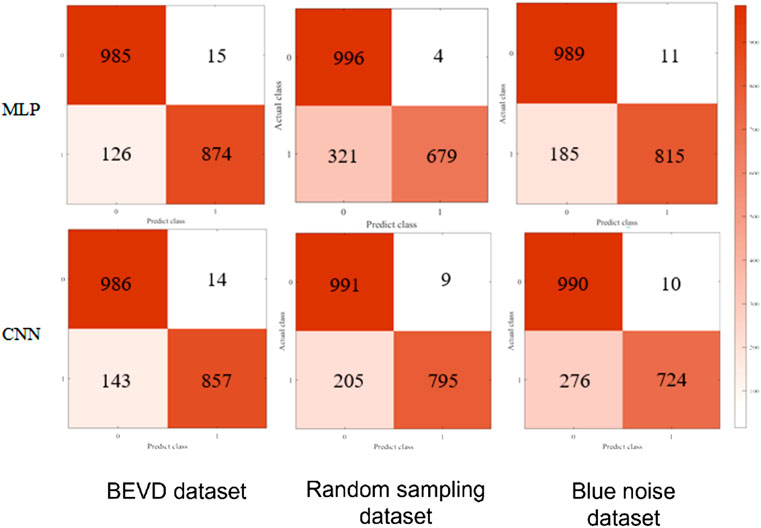
FIGURE 8. Confusion matrix for the results of experiment.
The collated 2-level metrics are shown in Table 2, where P0 and P1 denote the precision of converged and non-converged samples, R0 and R1 denote the recall of converged and non-converged samples, and A denotes the accuracy. In terms of accuracy A, the combination of the variable density boundary enhancement database with both depth models is the highest; while the blue noise database and the random sampling database present performance related to the deep model, with the blue noise database performing better under the MLP model and the random sampling database performing better under the CNN model. In terms of precision and recall, the error in discrimination mainly occurs in the error of discriminating non-converging samples as converging samples.
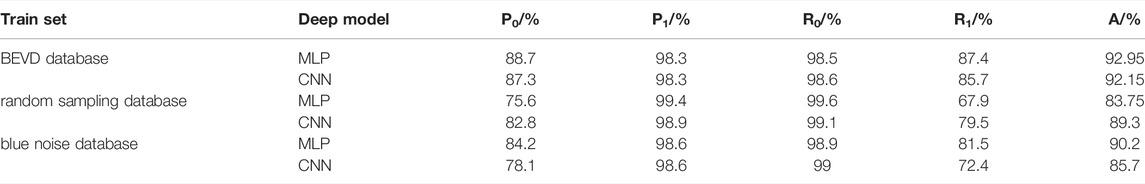
TABLE 2. Level 2 indicator for the results of experiment.
The above experimental results show that the generalization performance of the deep learning algorithm has the following relationship with the database.
1) The generalization performance of deep learning algorithms is determined by the database together with the model and algorithm. The discriminative accuracy of the BEVD database with the combination of both models is the highest and has similar values, while the accuracy of the other two datasets with the combination of different deep models are significantly different, with a difference of 5.55% and 4.5%, respectively
2) For the class boundary fitting task like convergence discrimination of power flow calculation, the database with BEVD distribution is more suitable for the demand.
3) The uniformity of the database distribution has no significant effect on the generalization performance of this task. The blue-noise database is more uniform than the random sampled database, The blue-noise database is more uniform than the random sampled database, and the discriminative accuracy of the MLP combined with the former is 6.45% higher than that of the combination with the latter, while the CNN with both has the opposite result of 3.6% lower.
Among the above three conclusions, the third one is inconsistent with intuition. This phenomenon can be understood as follows: if the labels of the database are continuously changing in the feature space, then a more uniformly distributed database should have a positive impact on the generalization performance of the deep model, while the labels in the trend convergence discrimination task are step-changing at the boundaries, and the positions of the samples in the feature space have different levels of importance. Therefore, the uniformity of the database distribution does not show a significant relationship with the model generalization performance.
The weighted sample elimination algorithm has the following features:
1) It Allows specifying the number of samples in the target database, and the termination condition of the algorithm can be controlled.
2) Good scalability to generate databases with different distribution characteristics by designing different sample weight calculation formulas.
3) It Supports the sampling domain as an arbitrary stream shape, which can meet the pre-processing operations such as the active balance of the original data.
4) The computational complexity of the algorithm is O(NlogN) and the storage complexity is O(N), which can be applied in high-dimensional feature space.
6 Conclusion
In order that the application of artificial intelligence in grid analysis can be further developed and model algorithms can be compared and optimized in a unified database, this paper researches the impact of the distribution characteristics of power flow database on the performance of deep learning generalization, and the methods for generating database considering the distribution characteristics, with the following contributions:
1) A database generation method T considering distribution characteristics in high-dimensional feature space is proposed, which can effectively reduce the computational complexity and storage complexity by typical data structure design and parallel acceleration of hardware.
2) The sample weight calculation rules for blue noise distribution and BEVD distribution in high-dimensional feature space are proposed and applied in the framework of the weighted elimination method, which can realize blue noise sampling and BEVD sampling in high-dimensional feature space.
3) The requirements of the power flow convergence discrimination problem on the database distribution characteristics are analyzed, and it is verified that the deep model trained by the variable density boundary-enhanced distribution database has apparent advantages in handling this task. The judgment accuracy was improved by 2.91%–9.5%.
Improving the generalization performance of learning models from the perspective of improving the quality of databases belongs to the field of data-centered machine learning. The research results of this paper can lay the foundation for the study of database distribution characteristics of classification problems focusing on boundaries.
Data Availability Statement
The raw data supporting the conclusions of this article will be made available by the authors, without undue reservation.
Author Contributions
XM: conceptualization, methodology, software, writing—original draft. YL: validation, writing—review and; editing. DS: resources, project administration, investigation. SH: data curation, supervision, software. FZ: visualization.
Funding
This work was supported by State Grid Corporation of China Science and Technology Project—Research on Evaluation and Verification Technology of Artificial Intelligence Model for Power Flow Adjustment and Stability Discrimination of Large Power Grid—under Grant 5100-202155343A-0-0-00.
Conflict of Interest
The authors declare that the research was conducted in the absence of any commercial or financial relationships that could be construed as a potential conflict of interest.
Publisher’s Note
All claims expressed in this article are solely those of the authors and do not necessarily represent those of their affiliated organizations, or those of the publisher, the editors and the reviewers. Any product that may be evaluated in this article, or claim that may be made by its manufacturer, is not guaranteed or endorsed by the publisher.
References
Alvarez-Melis, D., and Fusi, N. (2020), Database Dynamics via Gradient Flows in Probability Space. 12. doi:10.13334/j.0258-8013.pcsee.181622
Batista, G. E. A. P. A., Prati, R. C., and Monard, M. C. (2004). A Study of the Behavior of Several Methods for Balancing Machine Learning Training Data. SIGKDD Explor. Newsl. 6, 20–29. doi:10.1145/1007730.1007735
Chawla, N. V., Bowyer, K. W., Hall, L. O., and Kegelmeyer, W. P. (2002). SMOTE: Synthetic Minority Over-sampling Technique. jair 16, 321–357. doi:10.1613/jair.953
Chen, J., Chen, Y., Tian, F., Guo, Z., and Li, T. (2019). The Method of Sample Generation for Power Grid Simulation Based on LSTM. Proc. CSEE 39, 4129–4134. (in Chinese).
Chiang, H.-D., Flueck, A. J., Shah, K. S., and Balu, N. C. P. F. L. O. W. A Practical Tool for Tracing Power System Steady-State Stationary Behavior Due to Load and Generation Variations.10(2):623-634. doi:10.1109/59.387897
Cook, R. L. (1986). Stochastic Sampling in Computer Graphics. ACM Trans. Graph. 5, 51–72. doi:10.1145/7529.8927
Cubuk, E. D., Zoph, B., Mane, D., Vasudevan, V., and Le, Q. V. (2018). Autoaugment: Learning Augmentation Policies from Data. 2019 IEEE/CVF Conference on Computer Vision and Pattern Recognition (CVPR), arXiv preprint arXiv:1805.09501.
Dippé, M. A., and Wold, E. H. (1985). Antialiasing through Stochastic Sampling. Proc. 12th Annu. Conf. Comput. Graph. Interact. Tech., 69–78. doi:10.1145/325334.325182
Haibo He, H., and Garcia, E. A. (2009). Learning from Imbalanced Data. IEEE Trans. Knowl. Data Eng. 21, 1263–1284. doi:10.1109/tkde.2008.239
He, H., Bai, Y., Garcia, E. A., and Li, S. (2008).ADASYN: Adaptive Synthetic Sampling Approach for Imbalanced Learning. 2008 IEEE international joint conference on neural networks. IEEE, 1322–1328. doi:10.1109/ijcnn.2008.4633969
Hu, W., Zheng, L., Min, Y., Dong, Y., Yu, R., and Wang, L. (2017). Research on Power System Transient Stability Assessment Based on Deep Learning of Big Data Technique. Power Syst. Technol. 41 (10), 3140–3146. (in Chinese). doi:10.13335/j.1000-3673.pst.2017.1889
Japkowicz, N., and Stephen, S. (2002). The Class Imbalance Problem: A Systematic Study1. Ida 6, 429–449. doi:10.3233/ida-2002-6504
Joulin, A., Van Der Maaten, L., Jabri, A., and Vasilache, N. (2016).Learning Visual Features from Large Weakly Supervised Data. European Conference on Computer Vision. Springer, 67–84. doi:10.1007/978-3-319-46478-7_5
Shi, Z., Yao, W., Zeng, L., Wen, J., Fang, J., Ai, X., et al. (2020). Convolutional Neural Network-Based Power System Transient Stability Assessment and Instability Mode Prediction. Appl. Energy 263, 114586. doi:10.1016/j.apenergy.2020.114586
Sun, C., Shrivastava, A., Singh, S., and Gupta, A. (2017). Revisiting Unreasonable Effectiveness of Data in Deep Learning Era. in Proceedings of the IEEE international conference on computer vision, 843–852.doi:10.1109/iccv.2017.97
Tan, Bendong., Yang, Jun., Lai, Qiupin., Xie, Peiyuan., Li, Jun., and Xu, Jian. (2019). Data Augment Method for Power System Transient Stability Assessment Based on Improved Conditional Generative Adversarial Network. Automation Electr. Power Syst. 43 (1), 149–157. (in Chinese). doi:10.7500/AEPS20180522004
Tang, K., Wan, X., and Yang, C. (2021). DAS: A Deep Adaptive Sampling Method for Solving Partial Differential Equations. arXiv preprint arXiv:2112.14038. doi:10.48550/arXiv.2112.14038
Wang, Zhengcheng., Zhou, Yanzhen., Guo, Qinglai., and Sun, Hongbin. (2021). Transient Stability Assessment of Power System Considering Topological Change: a Message Passing Neural Network-Based Approach. Proc. CSEE 44 (07), 2341–2350. (in Chinese).
Yuksel, C. (2015). “Sample Elimination for Generating Poisson Disk Sample Sets,” Comput. Graph. Forum., 34, 25–32. doi:10.1111/cgf.12538
Zhang, H., Cisse, M., Dauphin, Y. N., and Lopez-Paz, D. (2017). Mixup: Beyond Empirical Risk Minimization. arXiv preprint arXiv:1710.09412.
Keywords: High-dimensional space, blue noise distribution, boundaryenhanced variable density (BEVD) distribution, Power flow calculation, Database construction
Citation: Meng X, Li Y, Shi D, Hu S and Zhao F (2022) A Method of Power Flow Database Generation Base on Weighted Sample Elimination Algorithm. Front. Energy Res. 10:919842. doi: 10.3389/fenrg.2022.919842
Received: 14 April 2022; Accepted: 09 May 2022;
Published: 31 May 2022.
Edited by:
Shutang You, The University of Tennessee, Knoxville, United StatesReviewed by:
Lipeng Zhu, Hunan University, ChinaJingbo Wang, Kunming University of Science and Technology, China
Copyright © 2022 Meng, Li, Shi, Hu and Zhao. This is an open-access article distributed under the terms of the Creative Commons Attribution License (CC BY). The use, distribution or reproduction in other forums is permitted, provided the original author(s) and the copyright owner(s) are credited and that the original publication in this journal is cited, in accordance with accepted academic practice. No use, distribution or reproduction is permitted which does not comply with these terms.
*Correspondence: Xianbo Meng, bWVuZ3hpYW55YW5nMTk5MEAxNjMuY29t