 Xingxing Wang1,2
 Anjian Wang
94% of researchers rate our articles as excellent or good
Learn more about the work of our research integrity team to safeguard the quality of each article we publish.
Find out more
ORIGINAL RESEARCH article
Front. Energy Res., 03 June 2022
Sec. Sustainable Energy Systems
Volume 10 - 2022 | https://doi.org/10.3389/fenrg.2022.919510
This article is part of the Research TopicCritical Energy Minerals: A Material Enabler for Carbon NeutralityView all 17 articles
Nickel is a key metal in the low-carbon transition. The industrial chain is a chain network organization system composed of various layers from the initial production of raw materials to the final product sales. The intensified contradiction between supply and demand can easily lead to the problem of resource supply security, and the occurrence of supply shortages will endanger the healthy and orderly development of the whole industrial chain. Therefore, from the perspective of the industrial chain and based on the trade data related to the nickel industrial chain, this study first constructs a multi-layer network model of the nickel industrial chain, and analyzes its trade structure characteristics and the correlation between different layers. It is found that the export policies of resource exporting countries may influence trade structure characteristics. On this basis, a multi-layer network crisis propagation model of the nickel industrial chain is constructed to simulate the impact and its propagation path of Indonesia supply shock on the entire industrial chain. With the increase of supply shock in Indonesia, the impact of crisis gradually concentrates to the downstream. Along the industrial chain, the number of affected countries gradually increases, but the difference in the impact degree gradually decreases. In addition, there are certain differences in countries affected by crisis at different layers of the industrial chain, and the crisis spreads mainly from China and Japan to the countries in midstream and downstream. The research results can provide corresponding policy suggestions for countries involved in the nickel trade.
The Paris Climate Agreement signed in 2015 set climate-change targets, to this end, many countries around the world have made carbon neutral commitments. Vigorously developing electric vehicles is one of the effective ways to achieve carbon neutrality, power battery is an important component in the electric vehicle industry chain, and high-nickel ternary lithium battery is becoming the mainstream, accounting for a gradually increasing proportion. Nickel is listed in the list of 24 strategic minerals by China in 2016, and also listed as a national crisis mineral or strategic mineral of priority concern by the United States, Japan, and other countries. It is mainly used in the fields of steel, nickel-based alloy, electroplating and batteries (Reck et al., 2008; Eggert, 2011). Under the background of carbon peak and carbon neutralization, with the rapid growth of nickel demand in electric vehicle batteries, the sustainable development and utilization of nickel resources have become a global concern (Gulley et al., 2018). Using different scenarios, Elshkaki et al. (2017) calculate that nickel demand will increase by 140–175% by 2025 and 215–350% by 2050. It can be seen that the market demand for nickel resources continues to increase in the future (Alvial-Hein et al., 2021). Although the production rate of nickel is greatly improved compared with that before the last century, mineral resources are limited, and continuous exploitation will eventually lead to exhaustion. The rapid depletion of resources calls for sustainable exploitation and utilization of resources (Mudd, 2010; Lederer et al., 2016). According to the United States Geological Survey (USGS), there are 89 million tons of nickel in the world in 2019, which at current rates of production would last about 37 years. The top three countries with the largest nickel reserves are Indonesia, Australia and Brazil, accounting for 60% of the world’s nickel. In recent years, with the development of new energy vehicles, the importance of nickel has been emphasized, so Indonesia has banned nickel exports more than once to improve its industrial structure. Resource export restriction will bring some uncertainty to global resource supply security (Teo, 2017), the shortage of a key strategic resource will endanger the healthy and orderly development of the whole industry chain (Graedel et al., 2015).
The industrial chain is a chain network organization system composed of various layers from the initial production of raw materials to the final product sales. The complex trade relationship of resources in each layer and between layers of the industrial chain forms a multi-layer trade network. As globalization continues to accelerate and countries involved in trade become more and more closely connected, countries around the world are vulnerable to trade disruptions (Liu and Muller, 2013). The industrial chain itself is a complex multi-layer network chain structure, its risks lurk in the industrial chain, always threatening its normal operation and development (Klimek et al., 2015). However, at present, researches based on trade crisis dissemination mainly focus on single-layer networks (Chen et al., 2018; Wang et al., 2018), using the multi-layer network theory to describe and analyze crisis propagation, it can explain the robustness of inter-layer associated networks when they encounter interference or attack, thus providing a scientific basis for further network optimization.
At present, a large number of scholars have begun to study the propagation of crisis communication in multi-layer networks. Danziger et al. (2018) proposed a dynamic dependency framework and used it to study synchronization and propagation processes in multi-layer networks with interaction layers. Gong et al. (2013) constructed an interdependent multi-layer network to analyze the cascading propagation of supply chains. Some scholars have also built a multi-layer copper trading network, using the complex network theory to determine the relationship between the copper raw material trade network and the copper scrap trade network, and understand the impact of China’s import ban on the multi-layer copper trading network (Hu et al., 2020). However, from mining to the use of nickel in various industries, all layers of the nickel industry chain are interlinked and interact with each other. When there is a shortage of goods in one layer of a country, it is likely to cause the supply of raw materials in the production of goods in the next layer to be insufficient. Then the output of the next layer will be affected, when the impact exceeds a certain limit, the supply risk of the next layer may be triggered. Therefore, on the one hand, it is necessary to understand the correlation between the upper and lower layers of the industrial chain, and on the other hand, we want to know the impact of problems in a layer on the international trade of the whole nickel industrial chain, so as to provide important reference for the development strategies of nickel-related industries of various countries more macroscopically.
Therefore, considering the frequent occurrence of Indonesia’s export restriction policies in recent years, to understand the complex relationship between different layers of the whole nickel industry chain and evaluate the impact of Indonesia’s supply shock, this paper analyzes the evolution characteristics of the trade structure of the global nickel industry chain by constructing a multi-layer trade network. Also, a supply crisis propagation model is constructed to simulate the impact of Indonesia’s supply shock on the nickel industry chain and the crisis propagation path. The rest of this article is organized as follows. Section 2 mainly introduces the data and methods, including the construction of network and the construction of the crisis propagation model. Section 3 mainly analyzes the complex relationship between the multi-layer network of the nickel industry chain and the impact of Indonesia’s supply shock. Section 4 provides the main conclusion and discussion.
According to the whole nickel life cycle process, this paper divides the nickel industry chain into three layers: upstream, midstream and downstream. The upstream products mainly refer to nickel ore and concentrate and nickel matte, the midstream products mainly include refined nickel and intermediate nickel products, the downstream products are final consumer goods containing nickel. See Table 1 for the Harmonization System Code (HS Code) and nickel content of products involved. Nickel-containing products and nickel-containing coefficients (how much nickel is contained in 1 Kg nickel product) refer to the article of (Nakajima et al., 2018). In this paper, we download and use trade data of all commodities related to the nickel industry chain from 2010 to 2019 from the UN Comtrade database, including import and export flows of countries around the world. The volume of trade is measured in Kg. In this study, some countries with low trade volume are excluded, leaving the trade flows in the top 95% of the total trade volume. However, the elimination of these trade relations and trading countries does not affect the impact on the major trading countries and trade relations, including 186 countries. It should be noted that due to the slight differences in statistical diameters among countries, some inconsistency exists between the statistics reported by a country and their trade partners. Therefore, for unification, the maximum value of the statistics from a reporting country and its partners as the trade value in this paper.
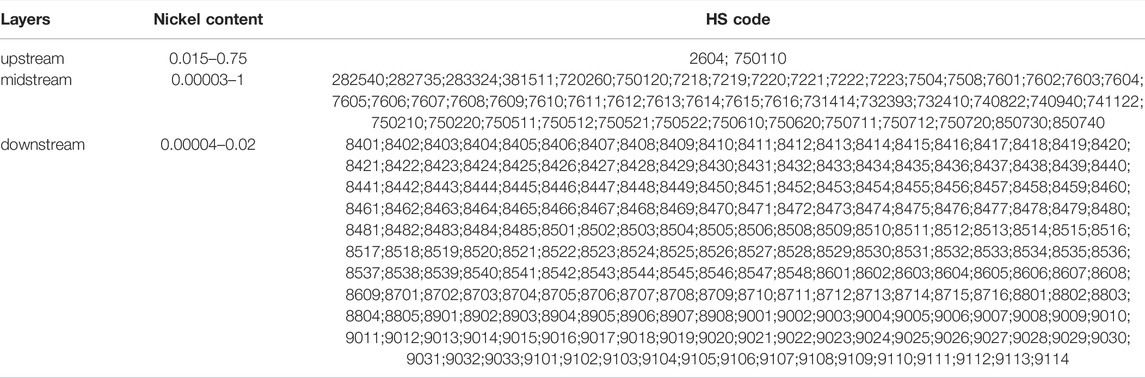
TABLE 1. Nickel content and HS Code in different layers.
This paper constructs a nickel industry chain multi-layer trade network from 2010 to 2019. The multi-layer trade network includes three layers, namely the upstream trade network, the midstream trade network and the downstream trade network. By using nodes to represent countries and edges to represent trade relations between nodes, the global nickel industrial chain trade network is constructed as
Where, n represents the quantity of nickel-containing products in layer
This paper analyzes the dynamic evolution characteristics of global nickel industry chain trade by selecting average weighting degree, density, average clustering coefficient, and average shortest path length. Here, at each layer of the nickel industrial chain, the average weighted degree is used to represent the average trade volume of all participating countries, the density of graphs and the average agglomeration coefficient are used to represent the closeness between participating countries, and the average shortest path length means that through at least how many countries can two countries in the trade network form trade relations.
(1) The average weighted degree
The weighted degree
Where
(2) Destiny
Network density (D) is another metric used to measure how tight the relationships between nodes are. In a trade network, the greater the density, the closer the relationship between countries, which is defined as (Fischer and Shavit, 1995):
Where p represents the number of actual trade relationship in the network, and N represents the number of all countries in the network.
(3) The average clustering coefficient
The clustering coefficient can measure the possibility of trade relationships between two countries that have trade relationships with
Where
(4) The average shortest path length
The average shortest path length is the average shortest distance between nodes in the trade network. The smaller the value is, through the fewer transmissions that any two nodes in the network can have a trade relationship. The definition is as follows:
Where L is the average shortest path length between nodes in the network, and N represents the total number of nodes in the network.
The relationship between different layers of the industrial chain is complicated and there must be some correlation between layers. Therefore, this paper analyzes the correlation between different layers of the industrial chain from the perspectives of node and edge.
In this paper, the node/edge overlap rate between two layers is selected to reflect the correlation between them. Taking the upstream layer
Where,
Node degree refers to the number of edges associated with the node. Node strength is the sum of the weights of the edges connected to the node. To verify whether countries with high node degree or node strength at one layer of the nickel industrial chain also have high node degree or strength at other layers, this paper introduces an indicator:
Where,
For the node strength of a country, its index is defined as:
Where,
Based on the multi-level trade network of the nickel industry chain, this paper constructs a crisis propagation model to simulate the impact of Indonesia’s export reduction on the whole nickel industry chain and assumes Indonesia as the source of crisis i. The aim is to explore how this supply crisis will damage all layers of the nickel chain when Indonesia exports decline, how it will affect other countries, and how the crisis spreads from upstream to downstream of the chain. Based on this idea, the risk communication model of the whole industrial chain is simply described as follows:
(1) Assume that the state of all countries in the whole industrial chain is normal, as shown in Figure 1A
(2) Assuming that Indonesia is the crisis source country i, Indonesia restricts the export of nickel ore, as shown in Figure 1B. If the export volume of crisis source I is reduced by alpha (Occurrence of supply risk, expressed by a reduction in export volume), the reduced export volume is expressed with
Where, α is an adjustable parameter, which can be adjusted according to research needs to simulate the influence of trade volume on the whole nickel industry chain in different degrees.
(3) Countries in the upstream trading layer that have a direct trade relationship with Indonesia will be affected, such countries as country D and country B at the upstream layer in Figure 1C will continue to spread the crisis to other countries in the upstream layer and the midstream layer. Here, when we judge how the affected countries spread down, there are certain differences in the import and export of nickel resources in different countries, and the degree of risk transmission should be different accordingly (Foti et al., 2013). First, we should judge the import and export volume of the country affected by the risk. If the country is a net exporter, its export decrease is the same as its import decrease. If it is a net importer, it will decrease proportionately. In Figure 1C, country B is the crisis-affected country, and its export reduction is calculated by judging whether country B is a net importer or exporter:
Where, Where,
(4) Affected by the reduction of production capacity in the upstream layer, some countries in the midstream layer become the source of crisis transmission, as shown in Figure 1D, countries B, D and E in the midstream layer.
(5) As in Step 3, crisis transmission sources B, D, and E in the midstream layer spread the crisis to other countries in the layer and to the downstream layer, as shown in Figure 1E.
(6) Similarly, countries C, D and E in downstream of Figure 1E become sources of crisis transmission and spread the crisis to other countries in this layer. The simulation is terminated until the trade volume of all countries in the whole industrial chain reaches a stable (Figure 1F).
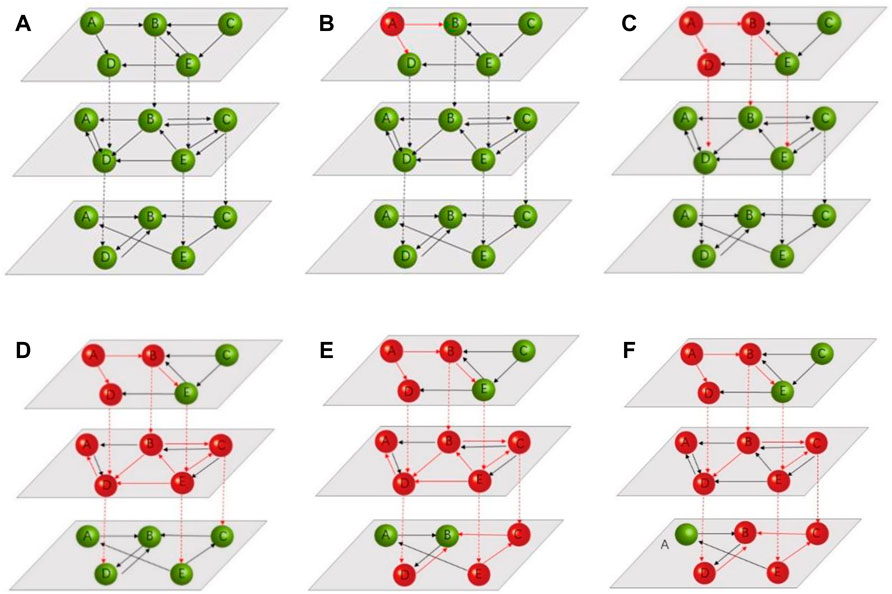
FIGURE 1. A diagram of crisis transmission (A)1,(B)2,(C)3,(D)4,(E)5,(F)6. Note: Each layer in each subgraph represents each layer of the nickel industry chain. Green and red spheres represent countries involved in trade, green spheres represent normal countries, and red spheres represent affected countries. Solid arrows indicate the flow of trade within layers, and dotted lines indicate the flow of nickel material between layers. A red line indicates a decrease in material flow.
To evaluate the development of the global nickel industry chain, this paper studies its evolution characteristics from 2010 to 2019. The analysis shows that the global nickel industry chain development is relatively stable except 2013. Countries and their trade relations have little differences between the upstream and midstream of the industrial chain involved in nickel resource trade (Figures 2A,B), while countries and their trade relations are relatively large in the downstream. It is clear that trade countries and trade relations plummeted in 2013. The reason may be that Indonesia has issued seven policies related to banning the export of nickel ore successively in 2013, and it was stipulated in 2012 that the export of raw nickel ore would be banned in 2014. Therefore, major trading countries in downstream of the nickel industry chain increase the import of nickel products related to the downstream for reserve. In addition, as only 95% of the total trade volume is studied in this paper, the vast majority of downstream products are controlled by a few trading countries, which is also one of the main reasons for the sudden increase in the average weighted degree of downstream nickel industry chain in 2013 (Figure 2C). In terms of the tightness of trade relations, Figures 2D,E show that the trade relations between countries in the nickel industry chain are relatively close and stable in the past decade, and the trade relations between countries in the upstream layer of the nickel industry chain are the loosest. At any level of the nickel industry chain, at most three countries can form trade relations (Figure 2F).
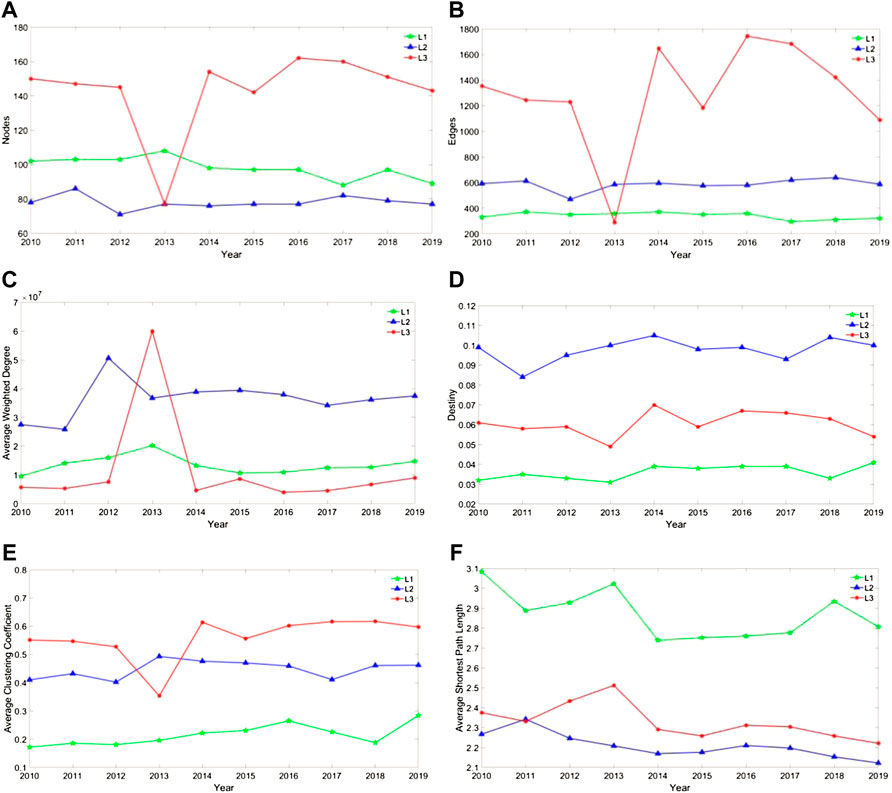
FIGURE 2. Trade evolution of nickel industry chain trade from 2010 to 2019 (A) nodes, (B) edges, (C) he average weighted degree, (D) density, (E) average clustering coefficient, (F) average shortest path length. Note: L1, L2 and L3 represent the upstream, midstream and downstream of the nickel industry chain respectively.
Figure 3 shows the correlation between layers of the nickel industry chain. As shown in Figure 3A, the countries that overlap between layers of the nickel industrial chain have basically remained stable over the past decade. The overlap rate between countries participating in upstream trade and midstream trade is the highest, reaching 72% in 2019, indicating that countries participating in upstream trade of nickel industry chain also actively participated in midstream in 2019. Taking the upstream and midstream of the industrial chain as an example, the horizontal coordinate in Figure 3B shows the nodes in descending order of node degree in the trade network of the upstream and shows the degree changes of countries participating in the trade of midstream. The results show that when a country has more trade relations upstream, it tends to establish more trade channels in the midstream of the nickel industry chain. Similarly, most of the countries with higher trade value in the upstream also have higher point strength in the midstream of the nickel industry chain (Figure 3C). We also study the correlation between layers of the nickel industry chain from the perspective of national trade relations (edges). Figure 3D shows that the overlap rate of trade relations between countries at different layers in the nickel industry chain is basically stable during the decade, among which the overlap rate between the midstream and downstream is the highest. However, compared with the overlap rate of nodes (Figure 3A), the overlap ratio of trade relations between layers is relatively low. The reason may be that there is a large gap in the number of trade relations at different layers of the nickel industry chain (Figure 2B).
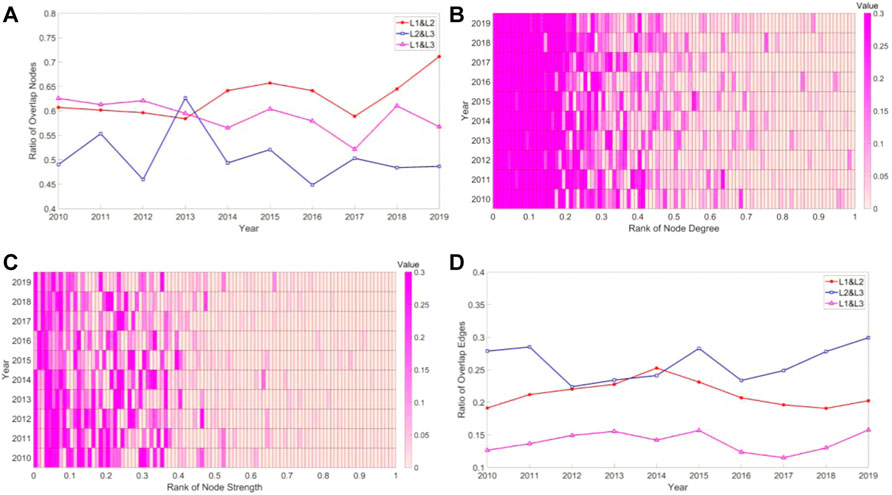
FIGURE 3. Correlation analysis between layers of nickel industry chain in terms of nodes and edges (A) the changes in the proportion of nodes between layers of the nickel industrial chain, (B) the changes in degree of standardized nodes in the midstream based on the nodes in the upstream, (C) the changes in intensity of standardized nodes in the midstream, respectively, based on the nodes in the upstream, (D) the changes in the proportion edges between layers of the nickel industrial chain. Note: For (B,C), the abscissa represents the rank of node degree/intensity, and the ordinate represents the year of study. For each year, we first rank them in reverse order of node degree/intensity in the upstream, for each line, we calculate the normalized value of node degree/strength in the midstream through formulas 4–7. The redder the color is, the greater the value is.
Through the above analysis, we find that there is a certain correlation between layers of the nickel industry chain. Indonesia is a major nickel producer and has had several export bans in recent years. Therefore, using 10-year trade data from 2010 to 2019, this paper constructs a multi-layer crisis propagation model of the nickel industry chain and simulates the impact of the upstream Indonesian nickel resource supply shock on the whole nickel industry chain and how the shock spreads from the upstream to the whole nickel industry chain.
The overall impact of Indonesia’s export supply shock on the nickel industry chain is analyzed in this paper. By adjusting α in Formula 1, we adjust the export supply shock of Indonesia to varying degrees (Table 2). The results show that with the increase of supply shock, on the one hand, more and more countries are affected at all layers of the industrial chain, and on the other hand, the influence gradually concentrates to the downstream. When Indonesia’s exports fall by less than 40%, countries in the upstream are more affected, and those in the midstream and downstream are less affected. When Indonesia’s export decreased by more than 50%, the impact gradually concentrated to the downstream, the number of countries affected in the downstream by more than 10% is gradually increasing, and all of them are larger than the proportion of countries affected in the upstream and midstream. When Indonesia’s supply exports decrease by 50%, 23% of the countries in the upstream imports decrease by more than 10%, and about 12% of the countries in the midstream and downstream imports decrease by more than 10%, respectively.
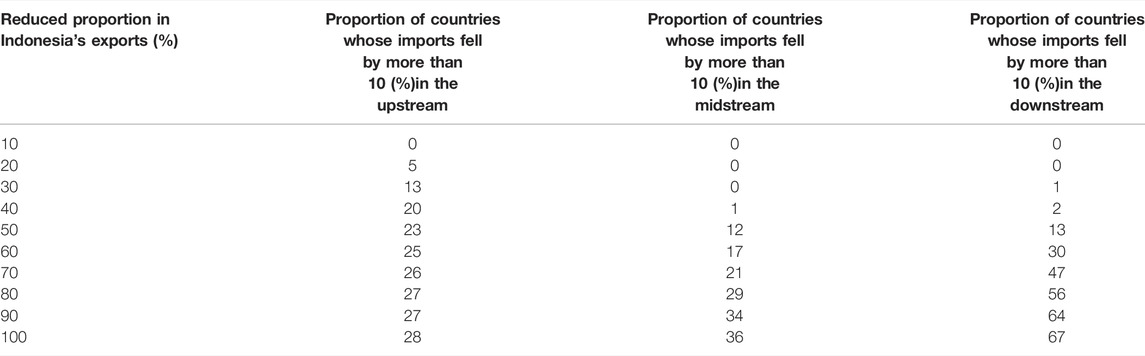
TABLE 2. The impact of upstream supply shocks in Indonesia on the industry chain.
When there is a supply shock in Indonesia (a 50% reduction in exports), there are also certain differences among countries that are more affected in different layers of the nickel chain (Figure 4). Half of the 10 countries most affected in the upstream are in Europe, but China and Japan are the most affected, their import decline is significantly higher than that of other countries, mainly because Indonesia’s upstream nickel resources are mainly exported to China and Japan. The 10 most affected countries in the midstream are mainly in Asia and Europe except the USA, with China being the most affected. The downstream countries most affected are South Africa, Mexico, and the USA, so they are the major importers of final consumer goods containing nickel. The overall analysis shows that along the industrial chain, the number of affected countries gradually increases, and the difference of affected degree gradually decreases. China is among the 10 countries most affected at each layer, with Japan, South Korea, Germany and the USA appearing twice.
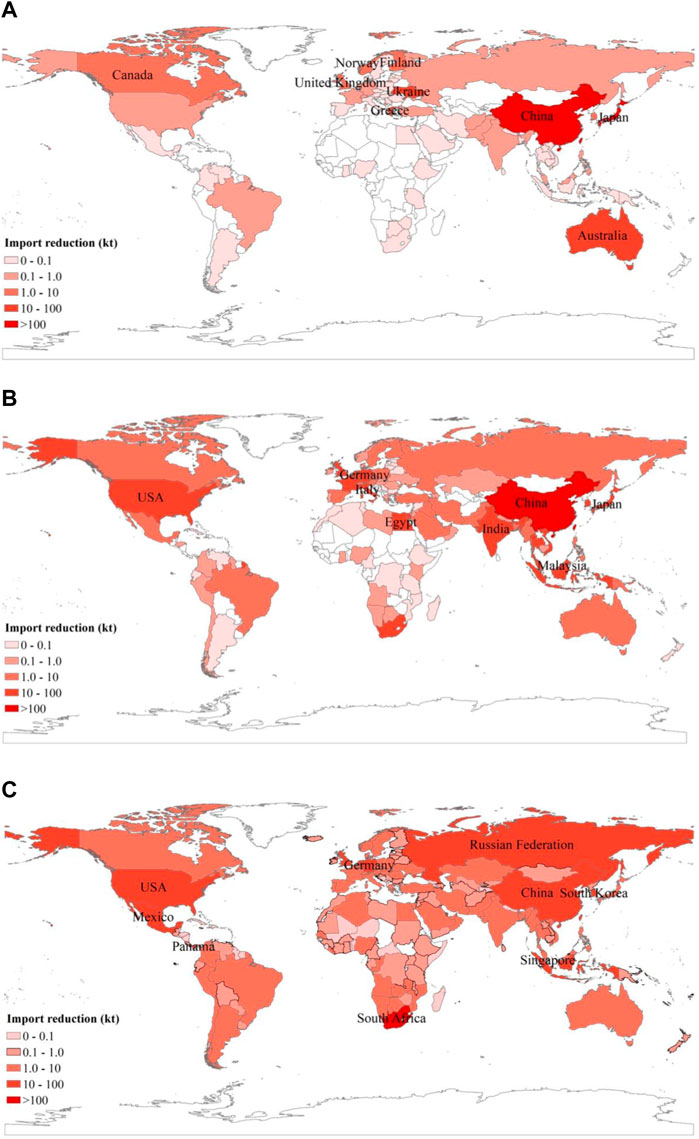
FIGURE 4. The geographical distribution of the impact degree in countries at different layers of the nickel industry chain (A) upstream, (B) midstream, (C) downstream. Note: The depth of color in the figure indicates the degree of impact. The darker the color, the greater the impact and the greater the import volume reduction. The top 10 most affected countries are marked.
Figure 5 shows the transmission path of the impact of Indonesia’s nickel raw material export reduction on the whole industrial chain. The chart shows only the top 20 trade relationships with decreasing trade volume at each layer of the industry chain. Red represents the upstream trading layer of the nickel industry chain. We find that Indonesia mainly transmits the crisis to Japan and China in the upstream layer, while other countries are less affected. The main reason is that resources upstream are all in the hands of a few countries, no matter in the direction of import or export. Indonesia is the main resources producer, while Japan and China are the major resources importers. Blue represents the layer in the middle reaches of the nickel industrial chain. We find that the risk sources in the middle reaches are mainly China and Japan. After the reduction of nickel resources upstream, China and Japan will reduce the production of the midstream and spread the crisis to other countries in the midstream. Green represents the downstream of the nickel industry chain. Similarly, the crisis sources downstream are also China and Japan, which spread the crisis to downstream by reducing the production of downstream products.
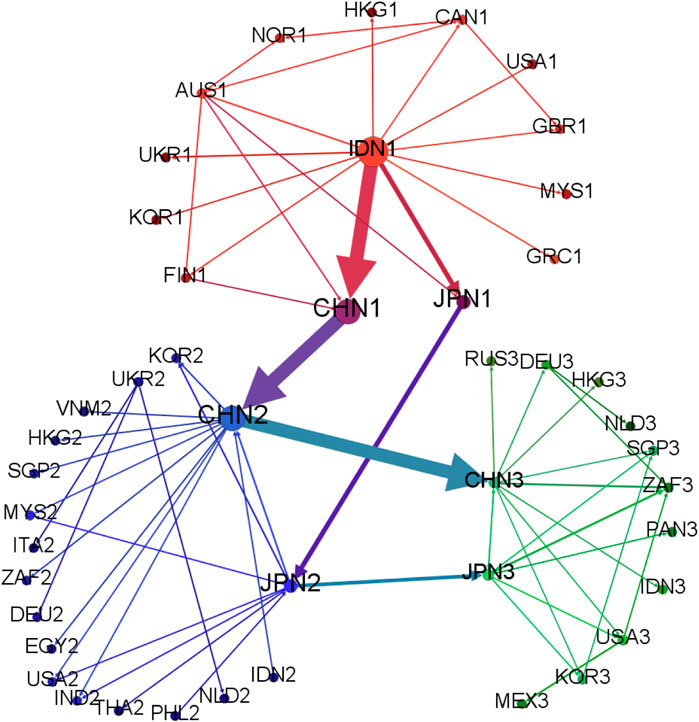
FIGURE 5. The main route of crisis propagation in the nickel industry chain. Note: the nodes represent countries, the edges represent trade relations between countries, the direction of the arrow represents the direction of trade flow, and the wider the edge, the greater the reduction of nickel material. Red nodes and lines represent the upstream layer of the industrial chain, blue nodes and lines represent the midstream layer, and green nodes and lines represent the downstream layer. The number 1,2,3 following the national abbreviation represents the upstream, middle and downstream of the industrial chain respectively. (See Supplementary Materials for the country names corresponding to the abbreviations).
First, we review the evolution characteristics of multi-layer trade networks in the nickel industry chain from 2010 to 2019. The results show that the evolution of the nickel industrial chain is relatively stable from 2010 to 2019, however, the change of export policies of major resource-producing countries can lead to the change of the nickel industrial chain trade pattern. Possibly influenced by various policies related to banning nickel ore exports issued by Indonesia since 2012, countries involved in trade and trade relations between countries plummeted in 2013, while the average trade volume in the downstream soared. At the same time, there are also some differences between the trade networks at all layers of the nickel industry chain, and the trade links between countries participating in the upstream trade are the loosest.
Secondly, we have analyzed the interdependence between industrial chain layers, and the close correlation between the CRM trade network and CWS trade network is identified from the perspective of different structural characteristics determine the close correlation between industrial chain layers from different structural characteristics. In particular, the trade volume and the trade relations between nickel industrial chain layers are highly positive. That is, if a country establishes more trade relations and owns more trade volume in one layer of the nickel industry chain, it generally also has a large number of trading partners and considerable trade volume in other layers. Similarly, if two countries are close at one layer, they tend to establish a tight trade relationship at other layers of the industry chain. In addition, due to the large gap in the number of trade relations between different layers of the nickel industry chain, the proportion of overlapping trade relations between layers is relatively low compared with the overlapping rate of participating countries.
Finally, we build a multi-layer network crisis propagation model for the nickel industry chain to simulate the impact of the upstream supply shock in Indonesia. The results show that with the increase of supply shock in Indonesia, the impact gradually concentrated to the downstream of the industrial chain. By analyzing the impact of Indonesia’s supply shock on countries at different layers of the nickel industry chain, it is found that along the direction of the industrial chain, the number of countries affected gradually increases, but the difference of the impact degree gradually decreases. By analyzing the impact transmission path of Indonesia nickel raw material supply shock in the whole industrial chain, it is found that the crisis is mainly spread to the midstream and downstream of the industrial chain via China and Japan.
Based on the above analysis, this paper puts forward the following policy suggestions:
(1) Countries like Indonesia and the Philippines, as major exporters of nickel upstream resources, should reasonably regulate their export bans to avoid the sudden interruption of upstream resources leading to the healthy and orderly development of the global nickel industry chain. In recent years, to increase the added value of products and boost the development of the local economy, Indonesia has issued more than one policy to improve the industrial structure by banning the export of nickel ore and has been implementing it in advance. In the high-speed development of new energy vehicles, stainless steel production continues to increase, nickel-iron capacity release is not as expected and other factors intertwined, it is likely to cause nickel prices to rise sharply, resulting in chaos in the trade market.
(2) Countries such as China and Japan must find more ways to ensure the stable supply of upstream resources if they want to guarantee the development of their industrial chain. With few domestic resources, these countries are more than 90% dependent on foreign countries. The promulgation of the ban has caused a considerable impact on their industrial chain. On the one hand, these countries can look for new sources of resources. We know that diversification of trade links can reduce dependence on a single country. Except for Indonesia, the Philippines, which has seen its nickel reserves and grades decline due to heavy exports in recent years, and New Caledonia may be the place to look for an increase in exports. On the other hand, they could invest heavily in Indonesia and other nickel-rich countries and strengthen nickel mining projects with these countries, holding the advantage of high and new technology firmly in hand, maintaining its control over the global industrial chain, so as to avoid the phenomenon of resources being “choked up.” In addition, continuing efforts to develop ore extraction technology is also an effective way to alleviate the supply crisis, nickel resources can be recycled more effectively with the improvement of technology.
(3) For all countries, nickel trade should be developed from the perspective of the whole industrial chain. From the above analysis, we know that the trade networks between the industrial chain layers are highly correlated, and the supply shock of the upstream will affect the whole industrial chain. Thus, focusing on a single-layer network will cause some countries to underestimate risks, while others may miss out on opportunities to expand trade. For example, South Africa, which imports a lot of downstream nickel products from China and Japan, should be aware not only of the risks posed by China and Japan but also of the risks they may face.
With the rapid growth of the demand for nickel in electric vehicle batteries, the sustainable development and utilization of nickel resources have become a global concern. The industrial chain is a chain network organization system composed of various layers from the initial production of raw materials to the sale of final products. Changes in export policies of some core countries are likely to have a great impact on this system. Each country needs to ensure the safe supply of nickel resources to determine the complex relationships in the industrial chain and understand the impact of export policies. Therefore, based on the complex network theory and the United Nations database, this paper firstly constructs the multi-layer trade networks of the nickel industrial chain from 2010 to 2019, analyzes the evolution characteristics of multi-layer trade structures, and the correlation between different layers. On this basis, a multi-layer trade crisis propagation model of the nickel industry chain is constructed to simulate the supply crisis impact and its propagation path of Indonesia’s supply shock. The main results are as follows: 1) the variation of the export policy of major resource-producing countries is likely to lead to the change of trade pattern of the whole industrial chain. 2) Each country should gradually improve the construction of its industrial chain. On the one hand, the construction of the “whole industrial chain” can reduce the impact of international factors fluctuations on domestic production activities, on the other hand, it can improve the status of the country in the whole industrial chain. 3) All countries should develop nickel trade from an overall perspective, pay close attention to all layers of the nickel industrial chain, and understand the position of each country in the industrial chain and the cross-layer relationship between all layers, to establish trade relations more effectively.
This paper builds a crisis propagation model of the nickel industry chain, on the one hand, it can simulate the impact of changes in any link on the whole industry chain, on the other hand, COVID-19 and trade frictions have occurred from time to time in recent years, we also hope that this model can be extended to other key mineral fields. However, this model can draw corresponding quantitative conclusions by studying the impact of risks on different countries, but due to space constraints, this manuscript does not show them. In addition, after the occurrence of crisis, how to adjust the industrial structure of each country is also our next research plan.
The raw data supporting the conclusions of this article will be made available by the authors, without undue reservation.
XW and DZ contributed to the conception and design of the study. DZ provided the method and XW completed the first draft of the manuscript. AW contributed to manuscript revision, read, and approved the submitted version.
This research is supported by grants from the Basic Science Center Project for the National Natural Science Foundation of China (Grant No. 71991485 and No.71991480), the National Natural Sciences Foundation of China (No. 72088101,the Theory and Application of Resource and Environment Management in the Digital Economy Era). We express our gratitude to Chunhui Wang, Weidong Li, Hongxiang Jia, who provided valuable suggestions.
The authors declare that the research was conducted in the absence of any commercial or financial relationships that could be construed as a potential conflict of interest.
All claims expressed in this article are solely those of the authors and do not necessarily represent those of their affiliated organizations, or those of the publisher, the editors and the reviewers. Any product that may be evaluated in this article, or claim that may be made by its manufacturer, is not guaranteed or endorsed by the publisher.
The Supplementary Material for this article can be found online at: https://www.frontiersin.org/articles/10.3389/fenrg.2022.919510/full#supplementary-material
Alvial-Hein, G., Mahandra, H., and Ghahreman, A. (2021). Separation and Recovery of Cobalt and Nickel from End of Life Products via Solvent Extraction Technique: A Review. J. Clean. Prod. 297, 126592. doi:10.1016/j.jclepro.2021.126592
Chen, Z., An, H., An, F., Guan, Q., and Hao, X. (2018). Structural Risk Evaluation of Global Gas Trade by a Network-Based Dynamics Simulation Model. Energy 159, 457–471. doi:10.1016/j.energy.2018.06.166
Danziger, M. M., Bonamassa, I., Boccaletti, S., and Havlin, S. (2018). Dynamic Interdependence and Competition in Multilayer Networks. Nat. Phys. 15 (2), 178–185. doi:10.1038/s41567-018-0343-1
Elshkaki, A., Reck, B. K., and Graedel, T. E. (2017). Anthropogenic Nickel Supply, Demand, and Associated Energy and Water Use. Resour. Conservation Recycl. 125, 300–307. doi:10.1016/j.resconrec.2017.07.002
Fischer, C. S., and Shavit, Y. (1995). National Differences in Network Density: Israel and the United States. Soc. Netw. 17 (2), 129–145. doi:10.1016/0378-8733(94)00251-5
Foti, N. J., Pauls, S., and Rockmore, D. N. (2013). Stability of the World Trade Web over Time - an Extinction Analysis. J. Econ. Dyn. Control 37 (9), 1889–1910. doi:10.1016/j.jedc.2013.04.009
Garlaschelli, D., and Loffredo, M. I. (2005). Structure and Evolution of the World Trade Network. Phys. A Stat. Mech. its Appl. 355 (1), 138–144. doi:10.1016/j.physa.2005.02.075
Gong, J., Mitchell, J. E., Krishnamurthy, A., and Wallace, W. A. (2014). An Interdependent Layered Network Model for a Resilient Supply Chain. Omega 46, 104–116. doi:10.1016/j.omega.2013.08.002
Graedel, T. E., Harper, E. M., Nassar, N. T., Nuss, P., and Reck, B. K. (2015). Criticality of Metals and Metalloids. Proc. Natl. Acad. Sci. U.S.A. 112 (14), 4257–4262. doi:10.1073/pnas.1500415112
Gulley, A. L., Nassar, N. T., and Xun, S. (2018). China, the United States, and Competition for Resources that Enable Emerging Technologies. Proc. Natl. Acad. Sci. U.S.A. 115 (16), 4111–4115. doi:10.1073/pnas.1717152115
Hu, X., Wang, C., Lim, M. K., and Chen, W.-Q. (2020). Characteristics of the Global Copper Raw Materials and Scrap Trade Systems and the Policy Impacts of China's Import Ban. Ecol. Econ. 172, 106626. doi:10.1016/j.ecolecon.2020.106626
Klimek, P., Obersteiner, M., and Thurner, S. (2015). Systemic Trade Risk of Critical Resources. Sci. Adv. 1 (1), e1500522. doi:10.1126/sciadv.1500522
Lederer, J., Kleemann, F., Ossberger, M., Rechberger, H., and Fellner, J. (2016). Prospecting and Exploring Anthropogenic Resource Deposits: The Case Study of Vienna's Subway Network. J. Industrial Ecol. 20 (6), 1320–1333. doi:10.1111/jiec.12395
Liu, G., and Müller, D. B. (2013). Mapping the Global Journey of Anthropogenic Aluminum: a Trade-Linked Multilevel Material Flow Analysis. Environ. Sci. Technol. 47 (20), 11873–11881. doi:10.1021/es4024404
Mudd, G. M. (2010). Global Trends and Environmental Issues in Nickel Mining: Sulfides versus Laterites. Ore Geol. Rev. 38 (1-2), 9–26. doi:10.1016/j.oregeorev.2010.05.003
Nakajima, K., Daigo, I., Nansai, K., Matsubae, K., Takayanagi, W., Tomita, M., et al. (2018). Global Distribution of Material Consumption: Nickel, Copper, and Iron. Resour. Conservation Recycl. 133, 369–374. doi:10.1016/j.resconrec.2017.08.029
Reck, B. K., Müller, D. B., Rostkowski, K., and Graedel, T. E. (2008). Anthropogenic Nickel Cycle: Insights into Use, Trade, and Recycling. Environ. Sci. Technol. 42, 3394–3400. doi:10.1021/es072108l
Teo, V. (2017). Commentary: Philippines Nickel Ore Export Ban. Available at: https://www.amm.com/Article/3751389/Nonferrous/Commentary-Philippines-nickel-ore-export-ban.html.
Keywords: nickel industry chain, simulation, multi-layer network, crisis propagation, Indonesia supply shock
Citation: Wang X, Wang A and Zhu D (2022) Simulation Analysis of Supply Crisis Propagation Based on Global Nickel Industry Chain. Front. Energy Res. 10:919510. doi: 10.3389/fenrg.2022.919510
Received: 13 April 2022; Accepted: 09 May 2022;
Published: 03 June 2022.
Edited by:
Zhi Cao, University of Antwerp, BelgiumReviewed by:
Feng An, University of Science and Technology Beijing, ChinaCopyright © 2022 Wang, Wang and Zhu. This is an open-access article distributed under the terms of the Creative Commons Attribution License (CC BY). The use, distribution or reproduction in other forums is permitted, provided the original author(s) and the copyright owner(s) are credited and that the original publication in this journal is cited, in accordance with accepted academic practice. No use, distribution or reproduction is permitted which does not comply with these terms.
*Correspondence: Anjian Wang, YWp3YW5nQGNhZ3MuYWMuY24=
Disclaimer: All claims expressed in this article are solely those of the authors and do not necessarily represent those of their affiliated organizations, or those of the publisher, the editors and the reviewers. Any product that may be evaluated in this article or claim that may be made by its manufacturer is not guaranteed or endorsed by the publisher.
Research integrity at Frontiers
Learn more about the work of our research integrity team to safeguard the quality of each article we publish.