 Tao Zhang
 Xing Yan1*
- 1Department of Electrical Engineering, Tsinghua University, Beijing, China
- 2State Grid Wenzhou Power Supply Company, Wenzhou, China
- 3State Grid Wencheng Power Supply Company, Wencheng, China
The intermittency and unpredictability are the obstacles to absorb all wind power. The combined heat and power (CHP) system has been widely utilized as a heat and electricity source, and the heating load limits the regulatory capacity of CHP to reduce curtailed wind power. This study proposes an optimization model of an integrated power and heating network system to fully utilize curtailed wind power. The thermal inertia in the primary heating network, thermal comfort of end-users, and electric boiler in the secondary heating network are included in multiple scenarios to analyze different operation strategies. The simulation results show that considering the heating network, the inertia and thermal comfort of end-users could reduce the curtailed wind power ratio from 15% to 9%. Adding a peak-shaving electric boiler on the user side can increase the system electric load and reduce the curtailed wind power, while reducing the heat output of the CHP unit during the peak and low periods of the heat load at night. Moreover, there is less than 1% of the curtailed wind power ratio if the peak-shaving capacity ratio is higher than 10%, which means the application recommendations of installed electric boiler capacity are obtained to increase enough flexibility of the power and heating network system.
1 Introduction
As the pollution of fossil fuels and global environmental problems are becoming rigorous gradually, the large-scale utilizations of renewable energy sources and other clean energy resources are of great need (Li et al., 2017; Jaszczur et al., 2020). According to the European Union, renewable energy utilization will achieve 30% of gross energy consumption in 2030 (Lin et al., 2018). As to China, the proportion of nonfossil energy will be 20% in 2030 (Du and Wang, 2016). Moreover, the special feature of renewable energy resources is that they could be installed everywhere and have solar and wind resources. Therefore, the integration of renewable energy and clean energy plays an important role in the future energy system (Bagheri et al., 2019; Huang et al., 2020).
Wind power is rapidly developing practically based on its environmentally friendly and sustainable nature (Chen et al., 2018; Tan et al., 2020). China installed 19.7 GW of wind power, contributing to 37% of the installed global wind power capacity in 2017. As to the United States, the new installed capacity of wind power is about 7 GW, which contributes to 13% of the installed global wind power capacity in 2017 (Global Wind Energy Association, 2018). The installed capacity of wind power systems increases from 75 GW in 2012 to about 188 GW in 2017 in China (Chen et al., 2015). However, the curtailment rate of wind power reached 10–33% in the northern and northeastern provinces of China (33% in Gansu province, 29% in Xinjiang province, and 14% in Heilongjiang province) (U.S. Department of Energy, 2018). The problem of wind curtailment causes the waste of wind resources and reduces the economic benefits of wind power enterprises seriously. Increasing the level of wind penetration reduces a key issue which is how to reduce wind curtailment. The generation in the power grid of the northern and northeastern provinces of China is mainly from coal-fired units, which accounted for 80% higher than that. The proportion of peak-shaving generators such as hydropower, gas turbine, and oil units are 7.8%. Moreover, wind power is an intermittent technology, which has antipeak regulation characteristics (Zhang et al., 2019; Qadir et al., 2021). The combined heat and power system (CHP) is constrained by the thermal load, which is a challenge for the high-penetration integration of renewable energy resources (Li et al., 2017; Wang et al., 2019a). Therefore, there was a great deal of wind curtailment during the peak of heating load and the low valley of electric load at night, especially in winter.
Therefore, numerous research studies have focused on increasing the flexibility of load and generation to reduce wind and PV curtailment (Chen et al., 2015; Xing et al., 2018; Wang et al., 2019b). The optimization method and model are very important for this issue (Babatunde et al., 2019). Chen et al. (2015) explored a linear model using heat storage and an electric boiler to increase the flexibility of coal-fired power plant and CHP units, which are integrated with a renewable energy power system. The results showed that those devices can improve the flexibility of coal-fired power plants or CHP units to reduce wind curtailment, the electric boiler has better efficacy in reducing wind curtailment, and the heat storage tank can reduce energy waste in the energy utilization. Wang et al. (2019a) introduced an efficient method considering multiple energy solutions and thermal inertia to improve the flexibility of the power system with high-penetration integration of renewable energy resources.
Moreover, Ganjehlou et al. (2020) proposed a techno-economic multilevel optimization method to encourage participation in a coalition system. The results indicate an improvement in the voltage profile and grid reliability in the power system. Gholinejad et al. (2020) introduce a hierarchical energy management system for multiple home energy hubs in a power grid to maximize financial profit and shave the peak of the upstream grid. Liu et al. () investigated the performance of electricity and heating networks and provided an engineering solution for multi-energy systems in Barry Island. Li et al. () introduced the strong linkage between the heating network and the power grid integrated by CHP in winter and built a linear model utilizing the heating storage capacity of the heating network to enhance the flexibility of the power system. However, the supplied heating system is modeled as a single node without a network or a single primary heating network without a second heating network in these references. Jadidbonab et al. () introduce a new model on energy hub scheduling which is called virtual energy hub; moreover, the proposed model is applied to a test case, and the numerical results validate the proposed approach. Nazari et al. () proposed a multi-objective two-stage stochastic unit commitment scheme for integrated gas and electricity networks, including P2G technology, demand response, and wind turbines. The results showed that the power-to-gas technology and demand response program reduces environmental pollution and costs.
In this study, we propose a novel approach to integrate the power and heating network system for curtailment of renewable power resources, in which the reserve capacity, thermal inertia, the electric boiler of primary and secondary heating network, and thermal comfort are considered. The main contributions of this study are summarized as follows:
1) An optimization model of integrated CHP, wind power station, conventional power plant, and heating network system to fully utilize curtailed wind power is constructed considering the thermal inertia, thermal comfort, and the electric boiler.
2) The thermal inertia of the primary heating network and the thermal comfort of end-users have a large influence on the curtailed wind power ratio if considering the integration of the power and heating network system.
3) The installed electric boiler capacity is obtained to increase enough flexibility of the power and heating network system.
The remainder of this study is organized as follows: Section 2 introduces the model of the heating network, which includes the general transmission model of the heating network, pipeline flow, and heat exchange station. Section 3 constructs the mathematical model of the CHP, electric boiler, and wind power. Section 4 presents the objective function and constraints of the optimization model, which includes power balance, CHP, heating network, loads, electric boiler, and wind power. Section 5 presents the case study. Section 6 discusses the results and discussion of this study. Finally, the conclusions are provided in Section 7.
2 Model of Heating Network
The urban thermal network transmits heat to the user through the heat medium, which can be divided into hot water network and steam network. In general, a hot water network is used more in urban heating. The model of the heating network includes a hydraulic model and thermal model, which have some key parameters such as mass flow rate, temperatures, and pressure. In this section, the hydraulic model is simplified to the node flow balance, which means every node in the network is observing the conservation of quality. The structure of the model is shown in Figure 1. The combined heat and power systems (CHPs) not only act as the heat source of the primary heating network but also are the key link between the heating supply and the power network. The thermal energy generated by CHP is delivered to the primary heating network, and then the primary heating network is delivered to the second heating network by the primary heat exchanger. The second exchanger is used to deliver the thermal energy to terminal consumers. In this study, the power stations include CHP, wind power station (WP), and conventional power plant (CPP), and the scenario is modeled for the curtailed wind power caused by a high proportion of CHP in the northern and northeastern provinces of China.
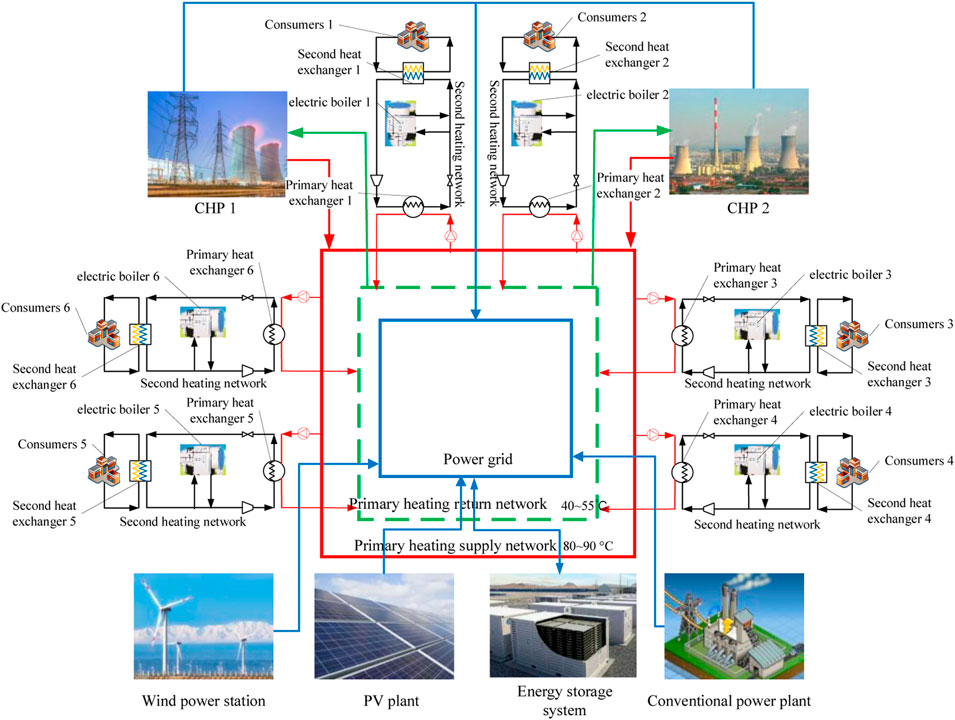
FIGURE 1. Schematic diagram of the integrated power and heating network.
2.1 General Transmission Model of the Heating Network
A general transmission model of the heating network is illustrated in Figure 2, which includes nodes and pipes. The model obeys the law of conservation of energy and mass. The mass/energy flow entering a heat node is equal to the mass/energy flow that leaves the node plus the flow consumption (Wang et al., 2019a).
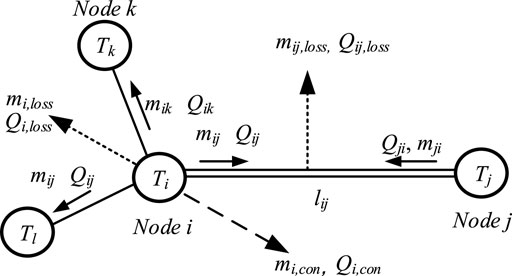
FIGURE 2. General transmission model of the heating network.
The continuities of flow in the heating network which include mass flow and energy flow are expressed as follows.
where
2.2 Pipeline Flow
In the process of heat medium flow in the pipe section, with the loss of heat energy, the heat loss in the pipe
where
The thermal power flowing out of a pipeline (
where
Assuming that
2.3 Heat Exchange Station
In this study, the heat exchange station includes the primary heat exchanger and the second heat exchanger, which are the hubs of the primary heating network, second heating network, and terminal heat consumer. Figure 3 depicts a heat exchanger with energy input
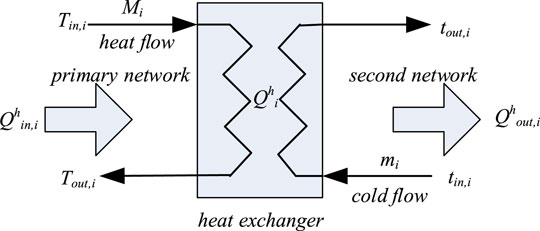
FIGURE 3. General transmission model of the heating network.
The input and output of energy in the heat exchanger can be expressed as follows based on the energy balance in a stable heat transfer process.
where
The heat transfer can be calculated using the mean temperature difference method and is described as follows:
where
The input and output energy of the heat exchanger are calculated as follows:
3 Mathematical Model of Components
3.1 CHP System
The electric power generated by CHP is injected into the power grid, and the heat energy generated by CHP is injected into the primary heating network. Moreover, the heat and power production are coupled all the time, and those output parameters are limited in the feasible operation area of the CHP plant, which is shown in Figure 4. The boundaries of AB, BC, CD, and DA represent the minimum limit of steam output, the maximum output heat rate, the maximum limit of fuel injection, and the maximum limit of power output, respectively. Each specific operating point in the feasible region represented the power and heat output of the CHP plant, which could be expressed by the convex combination of corner points. The electricity and heat output of the
where
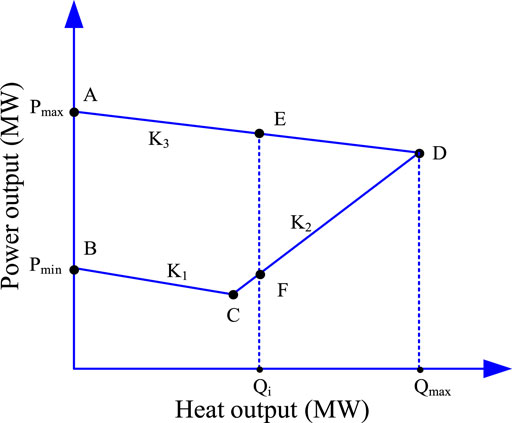
FIGURE 4. Operation area for CHP units.
3.2 Electric Boiler
An electric boiler (EB) consumes electricity to generate heat energy, and the below equations describe the conversion process and capacity constraints.
where
3.3 Wind Power
Wind power output depends on the stochastic characteristic of wind velocity; hence, it is difficult to be forecasted accurately (). Large statistical datasets have shown that wind velocity could be described by the Weibull distribution based on the probability density function (PDF), which is shown as follows:
where
The relationship between wind power output and real-time wind velocity can be calculated as follows.
where
The curtailment of wind power is calculated as follows.
where
4 Optimization Model
In this section, the economic optimization model is proposed to minimize the operation cost. The objective function and constraints are as follows.
4.1 Objective Function
The objective is to minimize the total cost of the integrated power and heating network system, which includes the costs of purchasing electricity and heating from CHP, the costs of purchasing electricity from CPP and wind, the cost of reserve capacity, and the penalty cost of wind power curtailment. The objective function is described as follows:
where
4.2 Constraints
4.2.1 Constraints of Power Balance
The electric load is balanced by CHP units, CPP units, and wind power units in the power grid at all times.
where
4.2.2 Constraints of CHP and CPP
The reserve capacities of CHP and CPP units are less than the ramping rates. Therefore, the generation capacity constraint for CHP units and CPP units considering the reserve capacity is shown as follows.
where
The output of CHP and CPP units have ramping rate constraints which are shown as follows:
where
4.2.3 Constraints of the Heating Network
The heating network includes the primary heating network and a secondary heating network. The thermal energy balances could be expressed as
where
4.2.4 Constraints of the Heating Load
The heating load of the building could be regarded as a large thermal storage because of the thermal inertia of building materials. Therefore, the building heating balance can be established based on the law of conservation of energy as follows.
where
The heating load of end-users could be expressed as
There is a certain thermal comfort zone based on indoor temperature in building heating. The building and indoor air are constantly storing and releasing heat and maintaining a certain indoor temperature range. Therefore, the heating system can adjust its operation strategy in a certain range to achieve optimal operation. The indoor temperature could vary in a certain range between minimum thermal comfort temperature and the maximum thermal comfort temperature, which is shown as follows.
where
4.2.5 Constraints of the Electric Boiler
The reserve capacities of the electric boiler are less than the ramping rates. Therefore, the operational constraints of the electric boiler are shown as follows.
where
4.2.6 Constraints of Wind Power
The whole uncertainty of wind power is described as follows.
where
5 Case Studies
5.1 Input Data
To demonstrate the effectiveness and advantage of the proposed model, an integrated power and heating network system for curtailed wind power is used for research. The case study is based on a primary heating network, a secondary heating network, two CHPs, one CPP, and a wind power station as shown in Figure 1, and the rated capacities are shown in Table 1.
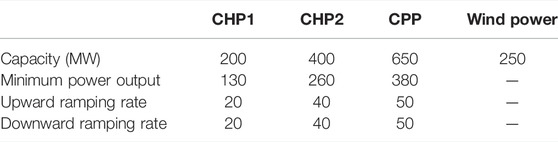
TABLE 1. Installed capacities of different generators.
Moreover, the maximum/minimum thermal outputs of CHP1 and CHP2 are 168/42 and 336/84 MW, respectively. The temperature is variable in the primary heating network, the supply temperature range of the node with a heat source is at 80–90°C, and the temperature in the return pipe depends on the absorption of heat demand. The standard indoor temperature is 20°C for heat demand, and the minimum and maximum thermal comfort temperatures are set to be 18°C and 22°C, respectively. The forecasted wind power output is shown in Figure 5.
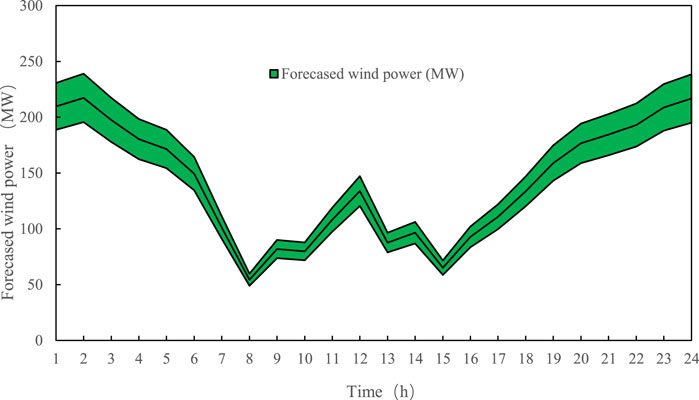
FIGURE 5. Forecasted wind power output and deviation.
The hourly electric load and the heating loads are shown in Figures 6, 7. The proposed optimization model is a mixed-integer linear programming (MILP) problem and is simulated by LINGO software.
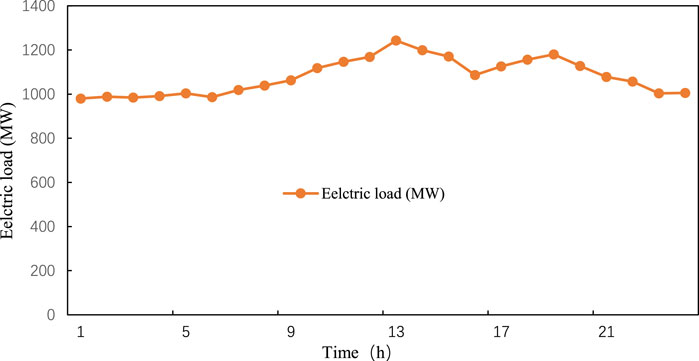
FIGURE 6. Total electrical load.
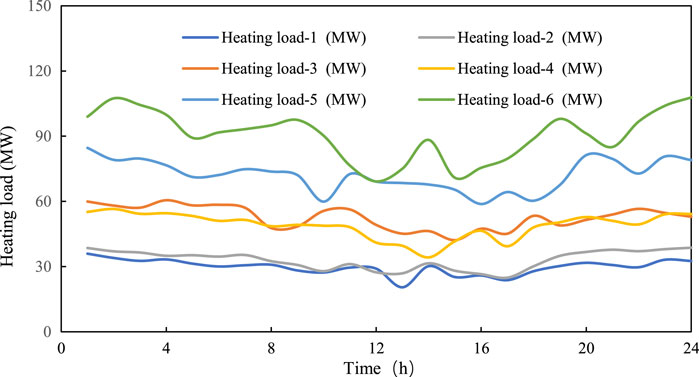
FIGURE 7. Heat loads of different heating consumers.
5.2 Different Scenarios
The proposed integrated power and heating network system is investigated by developing four scenarios, which involve traditional operation, heating network, inertia, thermal comfort, and electric boiler. A summary of the developed scenarios in this study is presented in Table 2.
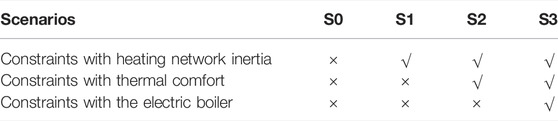
TABLE 2. Different scenarios.
In this study, we assume that the peak shaving capacity ratio of heating is a proportion of electric boiler capacity to the maximum heating load. Therefore, there are three other scenarios to analyze the impact of electric boiler capacity on the operation optimization results, which are shown in Table 3.
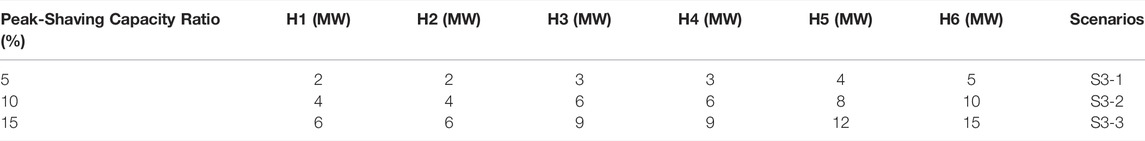
TABLE 3. Different scenarios based on S3.
6 Results and Discussion
6.1 Electricity Dispatch Results
The original operation of the reference scenario with curtailed wind power is shown in Figure 8. There is lot of curtailed wind power at midnight, and a little curtailed wind power in the daytime. The main reason is that the heat demands at night are high, which limits the ability of wind power absorption. The high electric demand and ramping rate limit the capability of wind power absorption. Therefore, the curtailed wind power ratio is about 15%.
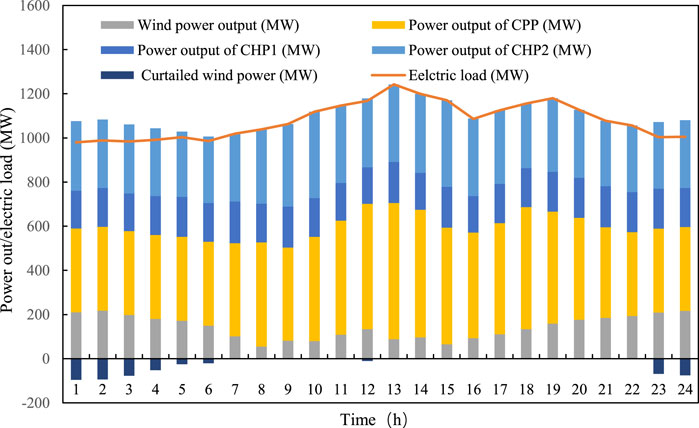
FIGURE 8. Optimal original electricity dispatch results with curtailed wind power in S0.
The hourly dispatching results of electricity power in scenarios S1∼3 are shown in Figure 9. Among the three scenarios, scenario S1 has the highest curtailed wind power ratio, which is 13%; scenario S1 has the highest curtailed wind power ratio, which is 13%; scenario S2 has the higher curtailed wind power ratio, which is 9%; and scenario S3-3 has no curtailed wind power. Therefore, the integrated power and heating network system considering heating network inertia and thermal comfort could reduce the curtailed wind power ratio from 15% to 9%. There will be no curtailed wind power if there are electric boilers installed in the second heating network as peak-shaving boilers.
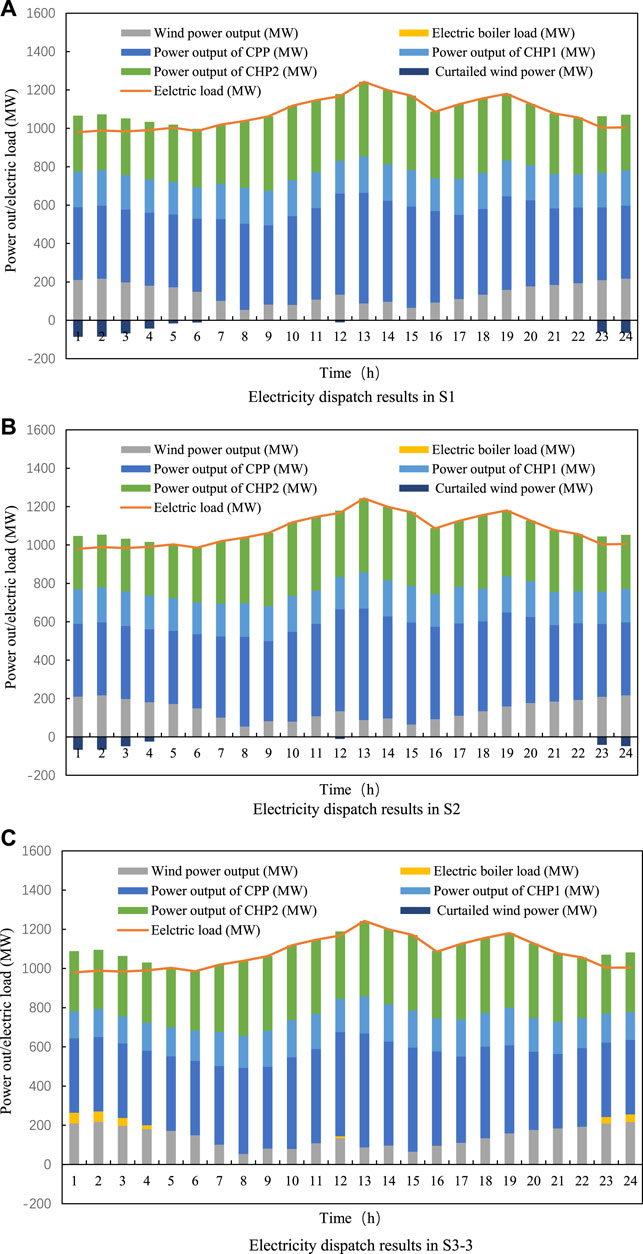
FIGURE 9. Optimal electricity dispatch results.
6.2 Heating Dispatch Results
The original heating load is changed in this optimization model when the heating network inertia and thermal comfort are considered. As shown in Figure 10, the actual heating load of buildings can be temporarily different from the original heating load, and the total heating demands are equal. The interior temperature increases, and the surplus heat is stored in the building when the actual heating load is more than the heat demand and vice versa. Therefore, the flexibility of CHP1 and CHP2 is further improved by considering the thermal inertia, thermal comfort, and electric boilers.
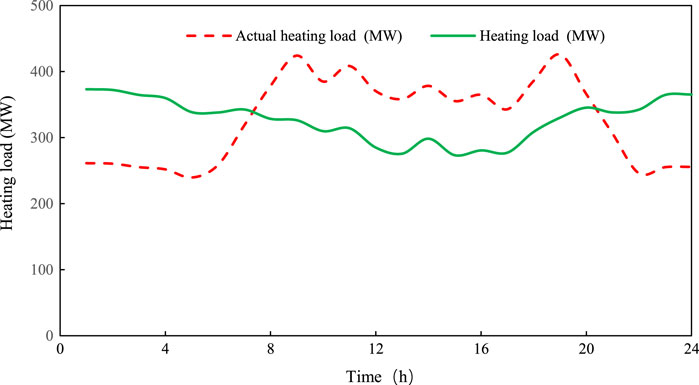
FIGURE 10. Comparison of heating load and actual heating load in S3.
Figure 11 illustrates the optimal dispatch results in S3-3. The surplus wind power is all transformed into heating which is supplied to the secondary heating networks, and the main heating resource is still CHP1 and CHP2 to meet the heating load demand, which is shown in Figure 11A. Moreover, the required reserve capacity which is shown in Figure 11B is decided by the predicted maximum wind power which is shown in Figure 5. The reserve compositions of the optimal results are described in Figure 11B, which shows that there is still not enough reserve capacity in the situation of maximum wind power. However, the results of the calculation show that the total curtailed wind power ratio is only 1.5% in the worst situation, in which the output of wind power is always the predicted maximum. According to the results, it is necessary to gradually increase the peak-shaving standby electric boiler and adjust the heating demand and reduce the curtailed wind power. It can be concluded that we can obtain a suitable wind power penetration rate based on the integrated power and heating network system considering thermal inertia and thermal comfort in practical applications.
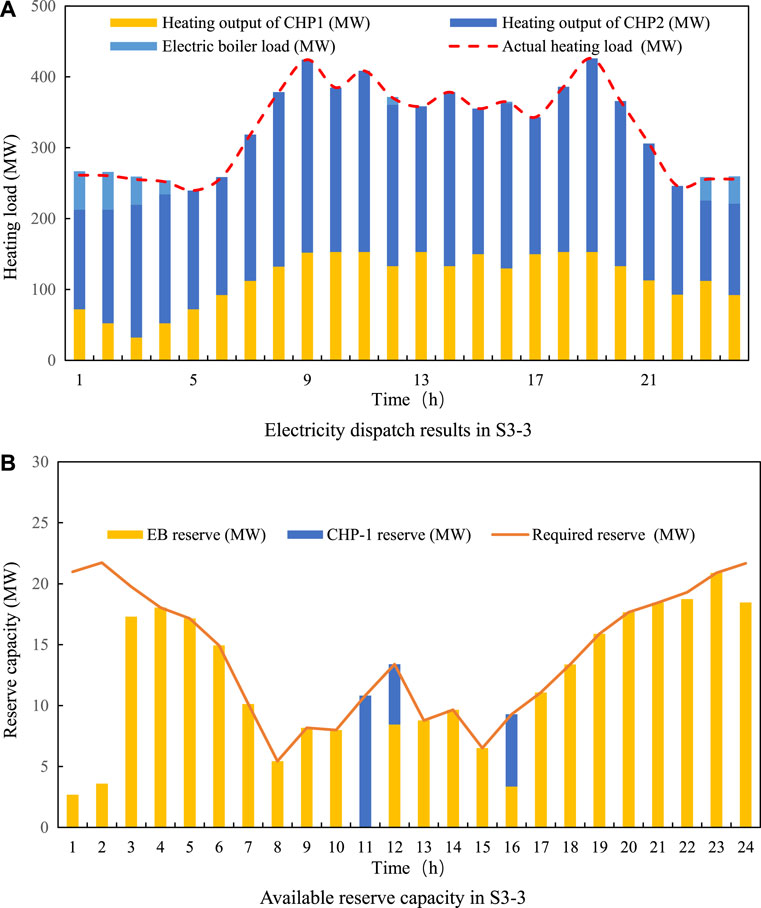
FIGURE 11. Optimal dispatch results in S3-3.
The curtailed wind power and cost comparison of different scenarios are listed in Table 4. The results are consistent with the theoretical analysis, in which the total cost can be further reduced considering the thermal inertia, thermal comfort, and electric boiler in the heating network.
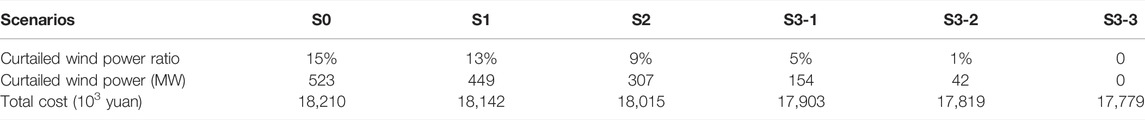
TABLE 4. The curtailed wind power and costs of different scenarios.
7 Conclusion
This study proposed an optimization model of an integrated power and heating network system to fully utilize curtailed wind power. The thermal inertia in the primary heating network, thermal comfort of end-users, and electric boiler in the secondary heating network are included in multiple scenarios to analyze different operation strategies. The three main achievements of the study could be summarized as follows:
1) The thermal inertia of the primary heating network and the thermal comfort of end-users have a large influence on the curtailed wind power ratio if considering the integration of the power and heating network system, and the result shows that considering heating network inertia and thermal comfort could reduce the curtailed wind power ratio from 15% to 9%.
2) Adding a peak-shaving electric boiler on the user side can increase the system electric load and reduce the curtailed wind power, while reducing the heat output of the CHP unit during the peak and low periods of the heat load at night. Moreover, the electric boiler could increase the available reserve capacity to absorb more wind power considering uncertainty.
3) The peak-shaving capacity ratio is introduced to research the impact of electric boiler capacity on the curtailed wind power ratio. There is less than 1% of the curtailed wind power ratio if the peak-shaving capacity ratio is 10%, which means the application recommendation of installed electric boiler capacity is obtained to increase enough flexibility of the power and heating network system.
Data Availability Statement
The original contributions presented in the study are included in the article/Supplementary Material; further inquiries can be directed to the corresponding author.
Author Contributions
All authors listed have made a substantial, direct, and intellectual contribution to the work and approved it for publication.
Funding
This study received funding from the Technology project of State Grid Zhejiang Electric Power Co., LTD (5211WZ2000WY). The funder was not involved in the study design, collection, analysis, interpretation of data, the writing of this article, or the decision to submit it for publication.
Conflict of Interest
Author RZ is employed by State Grid Wenzhou Power Supply Company, and author QY is employed by State Grid Wencheng Power Supply Company.
The remaining authors declare that the research was conducted in the absence of any commercial or financial relationships that could be construed as a potential conflict of interest.
Publisher’s Note
All claims expressed in this article are solely those of the authors and do not necessarily represent those of their affiliated organizations, or those of the publisher, the editors, and the reviewers. Any product that may be evaluated in this article, or claim that may be made by its manufacturer, is not guaranteed or endorsed by the publisher.
References
Babatunde, O. M., Munda, J. L., and Hamam, Y. (2019). A Comprehensive State‐of‐the‐art Survey on Power Generation Expansion Planning with Intermittent Renewable Energy Source and Energy Storage. Int. J. Energy Res. 43, 6078–6107. doi:10.1002/er.4388
Bagheri, M., Delbari, S. H., Pakzadmanesh, M., and Kennedy, C. A. (2019). City-integrated Renewable Energy Design for Low-Carbon and Climate-Resilient Communities. Appl. Energy 239, 1212–1225. doi:10.1016/j.apenergy.2019.02.031
Chen, X., Kang, C., O'Malley, M., Xia, Q., Bai, J., Liu, C., et al. (2015). Increasing the Flexibility of Combined Heat and Power for Wind Power Integration in China: Modeling and Implications. IEEE Trans. Power Syst. 30, 1848–1857. doi:10.1109/tpwrs.2014.2356723
Chen, X., Zhang, H., Xu, Z., Nielsen, C. P., McElroy, M. B., and Lv, J. (2018). Impacts of Fleet Types and Charging Modes for Electric Vehicles on Emissions under Different Penetrations of Wind Power. Nat. Energy 3, 413–421. doi:10.1038/s41560-018-0133-0
Du, Y., and Wang, J. (2016). China's Non-fossil Energy Accounts for the Total Consumption. Avilable At: http://energy.people.com.cn/n1/2016/1116/c71661-28871558.html (Accessed November 21, 2016).
Ganjehlou, H. G., Niaei, H., Jafari, A., Aroko, D. O., Marzband, M., and Fernando, T. (2020). A Novel Techno-Economic Multi-Level Optimization in Home-Microgrids with Coalition Formation Capability. Sustain Cities Soc. 60, 102241. doi:10.1016/j.scs.2020.102241
Gholinejad, H. R., Loni, A., Adabi, J., and Marzband, M. (2020). A Hierarchical Energy Management System for Multiple Home Energy Hubs in Neighborhood Grids. J. Build. Eng. 28, 101028. doi:10.1016/j.jobe.2019.101028
Global Wind Energy Association (2018). Statistical Analysis of Global Wind Power Industry Operation Situation and Installed Capacity of Wind Power Generation in China in 2017. Avilable at: http://www.chyxx.com/industry/201808/669765.html (Accessed on Aug 22, 2018).
Huang, J., Li, W., Guo, L., Hu, X., and Hall, J. W. (2020). Renewable Energy and Household Economy in Rural China. Renew. Energy 155, 669–676. doi:10.1016/j.renene.2020.03.151
Jaszczur, M., Hassan, Q., Palej, P., and Abdulateef, J. (2020). Multi-Objective Optimisation of a Micro-grid Hybrid Power System for Household Application. Energy 2020, 117738. doi:10.1016/j.energy.2020.117738
Li, G., Zhang, R., Jiang, T., Chen, H., Bai, L., Cui, H., et al. (2017). Optimal Dispatch Strategy for Integrated Energy Systems with CCHP and Wind Power. Appl. Energy 192, 408–419. doi:10.1016/j.apenergy.2016.08.139
Lin, W., Jin, X., Mu, Y., Jia, H., Xu, X., Yu, X., et al. (2018). A Two-Stage Multi-Objective Scheduling Method for Integrated Community Energy System. Appl. Energy 216, 428–441. doi:10.1016/j.apenergy.2018.01.007
Qadir, Z., Khan, S. I., Khalaji, E., Munawar, H. S., Al-Turjman, F., Mahmud, M. A. P., et al. (2021). Predicting the Energy Output of Hybrid PV–Wind Renewable Energy System Using Feature Selection Technique for Smart Grids. Energy Rep. 7, 8465–8475. doi:10.1016/j.egyr.2021.01.018
Tan, J., Wu, Q. W., Hu, Q. R., Wei, W., and Liu, F. (2020). Adaptive Robust Energy and Reserve Co-optimization of Integrated Electricity and Heating System Considering Wind Uncertainty. Appl. Energy 260, 114230. doi:10.1016/j.apenergy.2019.114230
U.S. Department of Energy (2018). Operation of Wind Power in 2017. Avilable at: http://www.nea.gov.cn/2018-02/01/c_136942234.htm (Accessed on Feb 01, 2018).
Wang, D., Hu, Q. e., Jia, H., Hou, K., Du, W., Chen, N., et al. (2019). Integrated Demand Response in District Electricity-Heating Network Considering Double Auction Retail Energy Market Based on Demand-Side Energy Stations. Appl. Energy 248, 656–678. doi:10.1016/j.apenergy.2019.04.050
Wang, D., Zhi, Y.-q., Jia, H.-j., Hou, K., Zhang, S.-x., Du, W., et al. (2019). Optimal Scheduling Strategy of District Integrated Heat and Power System with Wind Power and Multiple Energy Stations Considering Thermal Inertia of Buildings under Different Heating Regulation Modes. Appl. Energy 240, 341–358. doi:10.1016/j.apenergy.2019.01.199
Xing, X., Lin, J., Lin, J., Song, Y., Zhou, Y., Mu, S., et al. (2018). Modeling and Operation of the Power-To-Gas System for Renewables Integration: A Review. Csee Jpes 4, 168–178. doi:10.17775/cseejpes.2018.00260
Zhang, H., Lu, Z., Hu, W., Wang, Y., Dong, L., and Zhang, J. (2019). Coordinated Optimal Operation of Hydro-Wind-Solar Integrated Systems. Appl. Energy 242, 883–896. doi:10.1016/j.apenergy.2019.03.064
Nomenclature
Greek symbols
Abbreviations
CHP Combined heat and power
CPP Conventional power plant
PV Photovoltaic system
WP Wind power
Keywords: integrated energy network, heating network, wind power curtailment, reserve capacity, electric boiler
Citation: Zhang T, Yan X, Zhang R, Ye Q and Ma J (2022) Optimized Dispatching for Integrated Energy System With Wind Power. Front. Energy Res. 10:917805. doi: 10.3389/fenrg.2022.917805
Received: 11 April 2022; Accepted: 20 May 2022;
Published: 04 July 2022.
Edited by:
Yunfei Mu, Tianjin University, ChinaReviewed by:
Xing Lu, Texas A&M University, United StatesLv Chaoxian, China University of Mining and Technology, China
Copyright © 2022 Zhang, Yan, Zhang, Ye and Ma. This is an open-access article distributed under the terms of the Creative Commons Attribution License (CC BY). The use, distribution or reproduction in other forums is permitted, provided the original author(s) and the copyright owner(s) are credited and that the original publication in this journal is cited, in accordance with accepted academic practice. No use, distribution or reproduction is permitted which does not comply with these terms.
*Correspondence: Xing Yan, eWFueGluZ0Bjd3h1LmVkdS5jbg==