 Tianxiang Li
 Qian Xiao
 Hongjie Jia
 Yunfei Mu
 Xinying Wang
 Wenbiao Lu
 Tianjiao Pu
- 1Key Laboratory of Smart Grid of Ministry of Education, Tianjin University, Tianjin, China
- 2China Electric Power Research Institute, Beijing, China
Regional energy internet (REI) contains massive market agents, whose interests and objectives vary from each other. In consequence, it is challenging to stimulate the energy conservation and emissions reduction participation of each agent by the conventional schedule optimization method. This paper proposes a multi-agent schedule optimization method for REI considering the improved tiered reward and punishment carbon trading model. Firstly, the energy flow constraints and device constraints of REI are established. Secondly, to tighten restrictions on carbon emissions, the relative carbon emission is used as the criterion to establish the improved tied reward and punishment carbon trading model. Next, to analyze the real multi-agent game situation in the market, different agents are classified, and the objective functions are defined based on their revenue. Finally, a two-layer algorithm is used to solve the above multi-agent model. Simulation results verify that the proposed method can effectively reduce carbon emissions and significantly enhance the revenue of the region.
1 Introduction
Low-carbon and environmentally friendly energy production is the foundation of sustainable development in the world. Therefore, reducing the carbon emissions of energy systems gradually become a key research work. At present, with the gradual integration of energy systems, the research in this area mainly focuses on the following two aspects. The first is establishing a detailed carbon trading system to limit carbon emissions (Zhang et al., 2020), and the second is establishing an energy internet optimization system to improve energy efficiency (Yu et al., 2016).
Many scholars have made outstanding contributions to the energy internet carbon trading model. Huang et al. (2021) summarized the research status and application prospect of low carbonization technology, and respectively refined the carbon emissions reduction removal technologies of energy supply side and consumption measurement. Li et al. (2021) established a multi-layer key index system of source-net-network-load, and set a carbon index membership function suitable for central cities on the premise that the subjective and objective weight deviations were the smallest sum of squares. Yuan et al. (2022) introduced carbon capture power plants, which improved peak regulation capabilities and system economic benefits for cogeneration units, while the carbon emissions were reduced. Cui et al. (2021) introduced a comprehensive and flexible operation mode of carbon capture power plants on the source site, which was considered on the load side demand response. This mode explored the dispatching advantages of the complementary low-carbon characteristics of the two means, achieving a high degree of wind power consumption. Li and Niu (2021) summarized the current technical characteristics of the power system and believed that the expansion of renewable energy, the early withdrawal of coal power, the application of carbon capture technology, and the guarantee of transformation investment need to be handled in the future energy transition. Cui et al. (2022) proposed a multi-time scale source-load dispatch method of power system with wind power considering low-carbon characteristics of carbon capture power plant, which was able to take advantage of the dispatch of source-load adjustable resources to achieve low power systems the goal of carbon economy schedule. However, the above literature did not put strong restrictions on ultra-high carbon emissions enterprises, which was not conducive to significant control of carbon emissions.
Optimizing energy internet operation and reducing energy consumption is one of the current research priorities. Zhang et al. (2016) fully considered the characteristics of renewable energy and the characteristics of user demand response. He proposed a renewable energy day dispatch method to improve the revenue of the energy system. Based on the current energy internet operation model, Zhang et al. (2015) proposed a new energy Internet optimization model that considered electricity, heat, and gas. Because of the distribution characteristics of the energy internet, Xiao et al. (2022) proposed a side-cloud collaborative architecture. Under this architecture, the system optimization scheduling was realized by using multi-server layering, and the rapid scheduling of the energy internet was realized. Bahrami et al. (2015) and Zhang et al. (2019) extended the demand response of the traditional power system to the heat and gas system and proposed an optimal dispatching method that considered multi-dimensional demand response. Mohammadian et al. (2021) proposed a data-driven classifier for extreme outage prediction based on Bayes decision theory, which can guarantee the optimization effect and significantly improve the optimization rate of the energy system. Kamruzzaman et al. (2021) used deep reinforcement learning to improve the elasticity of the power system and then laid the foundations for improved energy efficiency and a low-carbon economy. In the microgrid scenario, Zeng et al. (2019) proposed a grid optimization and energy management method based on a deep neural network. Mohsenian-Rad et al. (2010) proposed an autonomous demand-side management based on game-theoretic energy consumption scheduling, which provided direction for the low-carbon transformation of smart grids in the future. Peng et al. (2021), Wang et al. (2020), and Chen et al. (2019) used the edge computing method to realize the hierarchical optimization of energy internet. However, the above literature did not consider the game relationship between different agents of energy internet adequately. It is difficult to mobilize the enthusiasm of the energy internet to participate in energy conservation and emissions reduction only by general overall optimization.
To reduce REI’s carbon emissions and enhance the different agents’ revenue, this paper proposes a multi-agent schedule optimization method for REI considering the improved tiered reward and punishment carbon trading model.
Compared with other works, the main contributions of the paper are summarized as follows.
1) This paper establishes a tiered reward and punishment carbon trading model for REI, which includes reward zone, ladder punishment zone, and index punishment zone. The model can reward enterprises that actively participate in reducing carbon emissions, and gradually raises the price of carbon to limit those enterprises that exceed carbon emissions standards.
2) This paper establishes a multi-agent schedule optimization method considering carbon trading for REI, which considers the interest demands of different agents in REI. This method divides all kinds of agents into supply agents, service agents and user agents. Then it sets up the objective function according to its actual revenue, which can stimulate the vitality of agents to participate in emissions reduction and market competition.
The rest of this paper is organized as follows. Section 2 establishes the REI mathematical model. The proposed tied reward and punishment carbon trading model is detailed in Section 3, and the proposed multi-agent schedule optimization method considering carbon trading is detailed in Section 4. In Section 5, this paper uses two sets of contrasting scenes to support the advantages of the proposed model and method. Finally, some conclusions are given in Section 6.
2 Regional Energy Internet Model and Main Work of This Paper
2.1 Regional Energy Internet Model
The REI model is shown in Figure 1.
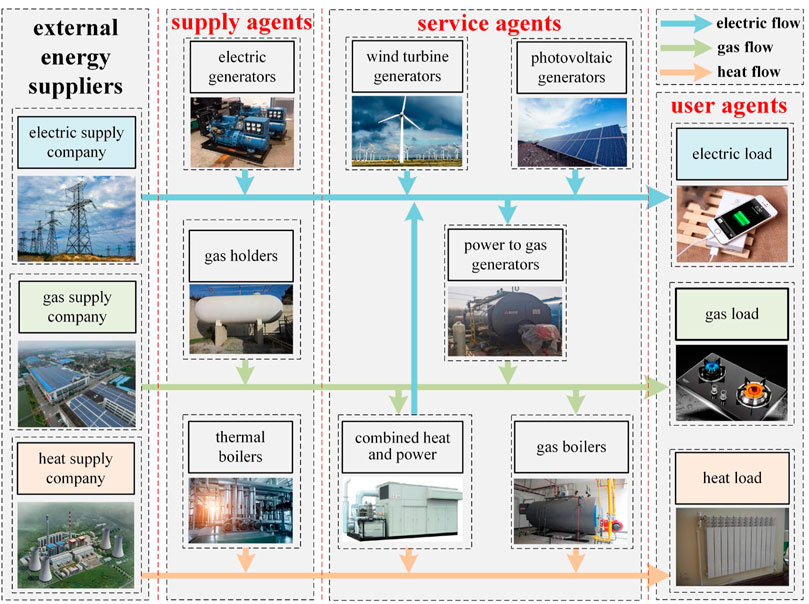
FIGURE 1. Regional energy internet.
There are three external energy suppliers, namely electric supply company, heat supply company and gas supply company. In the REI, there are supply agents, service agents and user agents. Supply agents have gas generators, thermal boilers and gas holders to supply this region. Service agents have wind turbine generators, photovoltaic generators, power to gas generators, combined heat and power generators and gas boilers. Service agents can use these devices to optimize regional operations. User agents have three kinds of load, there are electric load, heat load and gas load. In this model, service agents are responsible for optimizing area operation.
2.1.1 Energy Flow Constraints
1) Electric flow constraints can be expressed as follows.
Where
2) Heat flow constraints can be expressed as follows.
Where
3) Gas flow constraints can be expressed as follows.
Where
2.1.2 Device Constraints
1) Power to gas generators constraints can be expressed as follows.
Where
2) Combined heat and power generators constraints can be expressed as follows.
Where
3) Gas boiler constraints can be expressed as follows.
Where
4) Wind turbine generators constraints can be expressed as follows.
Where
5) Photovoltaic generators constraints can be expressed as follows.
Where
2.2 Main Work of This Paper
To solve the problems of high carbon emissions and insufficient enthusiasm of all agents in the REI, this paper proposes the improved tiered reward and punishment carbon trading model and the multi-agent schedule optimization method considering carbon trading. As shown in Figure 2, the carbon trading model rewards and punishes counterpart enterprises, which achieves the goal of reducing carbon emissions. The multi-agent game method can consider the subjectivity of different agents participating in energy conservation and emissions reduction, which achieves the goal of reducing carbon emissions and enhancing revenue. The connection between the two parts is as follows. The carbon trading model helps the multi-agent method control carbon emissions, and the multi-agent game method helps the carbon trading model mobilize the enthusiasm of different subjects to participate in energy conservation and emission reduction.
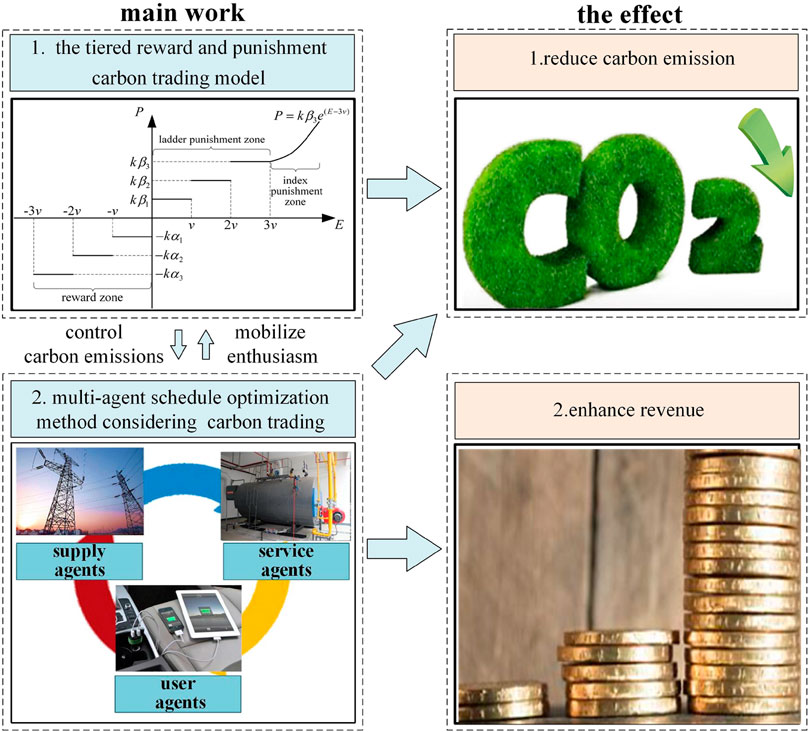
FIGURE 2. The main work of this paper and the effects.
3 The Tied Reward and Punishment Carbon Trading Model
The traditional carbon trading model often punishes and rewards carbon trading in a single-priced monopoly, which is not conducive to mobilizing the enthusiasm of all kinds of agents in the market to participate in energy conservation and emissions reduction. The traditional carbon trading model is shown in Figure 3.

FIGURE 3. Traditional carbon trading model.
This traditional model will enable some enterprises to arbitrage revenue from it. For example, if the revenue of one enterprise emitting a unit of carbon dioxide is greater than the benchmark price of carbon emissions per unit k, this model does nothing to limit the enterprise’s carbon emissions!
Therefore, to stimulate the enthusiasm of stakeholders in the energy market to participate in energy conservation and emissions reduction, the improved tiered reward and punishment carbon trading model is proposed in this paper, which is shown in Figure 4.
In Figure 4, the horizontal axis E is the relative carbon emission for the entire simulation period, which can be calculated by the formula (Zeng et al., 2019), and the vertical axis P is the carbon price per unit given by the government. In formula (Zeng et al., 2019), Er is the actual carbon emissions of the enterprise, Eg is the free carbon emissions of the enterprise. The reward and punishment carbon trading model include reward zone, ladder punishment zone and index punishment zone. The reward zone can reward enterprises with lower carbon emissions on a tiered basis. In the same way, the ladder punishment zone can punish enterprises with higher carbon emissions at different levels. And the index punishment zone can limit enterprises with extremely high carbon emissions.
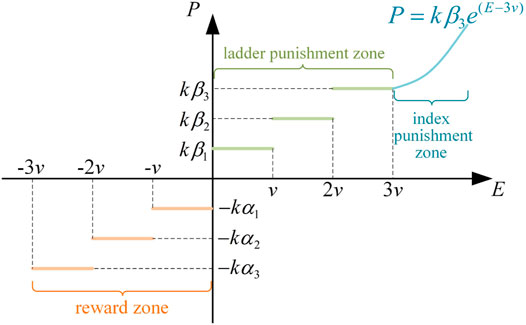
FIGURE 4. The proposed tiered reward and punishment carbon trading model.
Compared with the traditional carbon trading model, the improved tiered reward and punishment carbon trading model has the following advantages:
1) It can reward or punish enterprises with different carbon emissions at different levels, which can mobilize the enthusiasm of enterprises to participate in energy conservation and emissions reduction.
2) It can eliminate the possibility of some high-carbon emissions enterprises profiting from it.
3.1 Reward Zone
When an enterprise’s relative carbon emission E is less than zero, it means this enterprise’s actual carbon emissions Er under the free carbon emissions of the enterprise Eg. On this occasion, this enterprise should be rewarded. The reward amount should be determined by the enterprise’s relative carbon emission E. This paper divides the reward zone into three levels. The carbon price per unit P can be calculated as follows.
Where k is the benchmark price of carbon emissions per unit,
The cost of carbon emissions
In the reward zone, the carbon price per unit given by the government and the cost of carbon emissions is negative. That means this enterprise is rewarded for reducing carbon emissions.
3.2 Ladder Punishment Zone
When an enterprise’s relative carbon emission E is more than zero, it means this enterprise should be punished for its carbon emissions. If the enterprise’s carbon emissions are less than the set standard 3v in the meantime, its carbon price will fall into the ladder punishment zone. This paper divides the ladder punishment zone into three levels. The carbon price per unit P can be calculated as follows.
Where
The cost of carbon emissions
In the ladder punishment zone, the carbon price per unit presents a ladder distribution. That means this enterprise is punished for carbon emissions, and the price of the punishment varies with the amount of carbon emitted.
3.3 Index Punishment Zone
When an enterprise’s relative carbon emission E is more than 3v, it means that the enterprise’s carbon emissions seriously exceeded the standard. In this case, the punishment must be increased to ensure the environmental protection of the energy system. Therefore, this paper sets up an index punishment zone. In this zone, the carbon price per unit P can be calculated as follows.
The cost of carbon emissions
In the index punishment zone, the carbon price per unit presents exponential growth.
4 The Multi-Agent Schedule Optimization Method Considering Carbon Trading
There are many different types of agents in REI, and the general optimization of REI operation is not conducive to mobilizing the enthusiasm of all agents to participate in energy conservation and emissions reduction. According to the characteristics of different agents in REI, various agents are divided into supply agents, service agents and user agents. Then the objective function is set according to their actual interests, and an optimization scheduling method considering multi-agent carbon trading is proposed. The interests of each agent are affected by the policies of other agents. The game relationship of the three types of agents is shown in Figure 5.
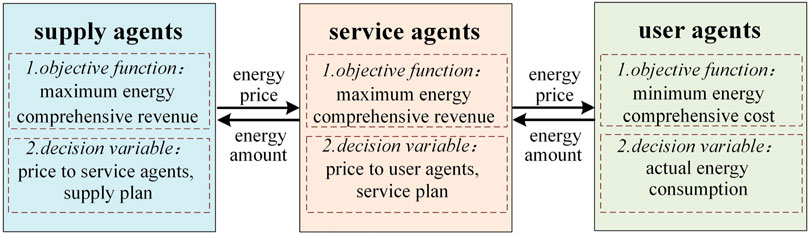
FIGURE 5. Multi-agent game relationship diagram.
4.1 Supply Agents
Supply agents refer to all market agents who profit by producing and selling energy. Their main feature is that they have energy production facilities. Their revenue is mainly influenced by the number of purchases by lower-level buyers and the cost of energy production. When such supply agents are optimized, their energy comprehensive revenue can be maximized by adjusting their price to service agents and their energy supply project. Supply agents’ objective function
Where
Where
Where
Where
Supply agents’ revenue is affected by various market factors. Supply agents can change their price to service agents
4.2 Service Agents
Service agents refer to all market agents who profit from energy conversion and dispatching. Their main feature is that they have power to gas, gas boiler and other energy conversion equipment. Their revenue is influenced by market conditions, equipment performance and other agents’ policies. When service agents are optimized, their energy comprehensive revenue can be maximized by adjusting their energy purchasing power, energy selling price and conversion strategy. Service agents’ objective function
Where
Where
Where
Where
Where
Service agents can change their price to user agents
4.3 User Agents
User agents refer to all market agents who benefit in other ways. They usually act as a user of energy rather than participating in energy production and transmission activities. In the process of energy optimization, the minimum energy purchase cost of the user agents is considered. User agents’ objective function
Where
Where
Where
Where
User agents can change their amount of energy buying power from service agents
4.4 Optimization Calculation Method
Multi-agent game is different from multi-objective optimization. It is not simply to pursue maximum comprehensive revenue. It is trying to find a stable operating point where no one can enhance his revenue by chance himself. This feature can be expected as follows.
Where
At Station
Then
Considering that the multi-agent game process of REI is complex, this paper divides the whole operation optimization process into the following two parts: the upper price game and the bottom device game. The algorithm can be expressed as follows.
To verify the superiority of the proposed method, this paper establishes an REI for simulation which includes supply, service and user agents. Supply agents possess electric generators, gas holders and thermal boilers. Service agents possess wind turbine generators, photovoltaic generators, combined heat and power generators, power to gas generators and gas boilers. User agents include electric, gas and heat load. The energy flow model and device model are shown in Section 2. This paper sets the simulation time as 24 h, and the time interval as 1 h. To ensure the rationality of the simulation results, the price needs to be limited. Supply agents’ price limit is shown in Table 1, and service agents’ price limit is shown in Table 2. At the same time, the efficiency should be set, unit service cost, and maximum output power constraints of the various device according to the situation of the region. Device parameters are shown in Table 3. Parameters in the carbon trading model are shown in Table 4. TABLE 1. Supply agents’ price limit. TABLE 2. Service agents’ price limit. TABLE 3. Device parameters. TABLE 4. Carbon trading scenes. The renewable energy forecast value and initial load value are shown in Figure 6. This paper sets that the output power of renewable energy in the REI cannot exceed its predicted value. At the same time, the demand response in this paper is in the form of an interruptible load, so the actual user load value cannot exceed the initial value. FIGURE 6. Renewable energy and load data. To fully explain that the proposed improved tiered reward and punishment carbon trading model and the proposed multi-agent game method in this paper are beneficial to the REI, this paper sets up a simulation scenario under the principle of control variables. In section 5.1, considering three kinds of energy games, only the carbon trading model for simulation is changed; in section 5.2, considering the proposed tiered reward and punishment carbon trading model, only the game energy types for simulation are changed. The other parameter settings of the two sets of scenes are the same. To verify the advantages of the proposed tiered reward and punishment carbon trading model, this paper sets up three scenes which are shown in Table 4 for comparison. In Table 4, there are 3 scenes to simulate. In scene 1, the carbon trading model is not considered, which means the revenue of the whole region will not be affected by carbon emissions; in scene 2, the traditional carbon trading model in Figure 3 is considered; in scene 3, the improved tiered reward and punishment carbon trading model in Figure 4 is considered. The simulation results are shown in Table 5. TABLE 5. Carbon trading results. The comparison of carbon emissions is shown in Figure 7. FIGURE 7. Comparison of carbon emissions. In Table 5 and Figure 7, the results indicate that: from scene 1 to scene 3, carbon emissions significantly decrease by about 2.2%, which illustrates the method proposed in this paper is useful to control carbon emissions. But the cost of carbon emissions rises, which makes the comprehensive revenue decrease. This is an accepted thing. Controlling carbon emissions will reduce revenue. To verify the advantages of the proposed multi-agent game method, this paper sets up 4 scenes which are shown in Table 6 for simulation. In Table 6, there are 4 scenes to simulate: in scene 1, supply agents, service agents and user agents only focus on immediate revenue, do not consider the impact of other market players; in scene 2, each agent only considers heat game; in scene 3, consider heat and gas game; in scene 4, consider electric, heat and gas game. TABLE 6. Game scenes. The simulation results are shown in Table 7. TABLE 7. Game results. The comprehensive revenue and carbon emissions are shown in Figure 8. FIGURE 8. Comparison results. In Table 7 and Figure 8, the results indicate that as more types of energy games are considered, the higher the energy sales revenue. That’s because when taking the energy game out of the equation, supply agents and service agents only consider immediate revenue. At this moment, these agents do not analyze market conditions for an inflated price, which makes the region’s energy sales revenue fall instead. When considering fewer types of energy games, the carbon emissions go up, this is because users do not consider the market game, blindly reducing the demand response, increasing the total energy consumption, thus making carbon emissions up. Compared with scene 1, in scene 4, carbon emissions significantly decrease by about 5.1%. More carbon emissions make the cost of carbon emissions rise, plus with the influence of energy sales revenue, both of them make comprehensive revenue decline. Multi-agent game results are shown in the Figure 9. FIGURE 9. Multi-agent results. In Figure 9, the changing user loads make supply agents’ and service agents’ prices change with time. Heat price is always very high (the upper limit is often reached), this is because the heat demand in this paper is large. For service agents, the revenue of increasing the price is higher than the losses of the comfort function. In contrast, natural gas demand in this REI is low, reducing the price to increase the comfort function brings more revenue. Device optimization results are shown in Figure 10. FIGURE 10. Device optimization results. In Figure 10, the results indicate that: WTG generators’ power and PV generators’ power are almost the same as predicted, this is because renewable energy is given priority in this paper. CHP generators are used when renewable energy cannot meet system requirements and there is a simultaneous thermoelectric demand. As for service agents, it is cheaper to supply heat through GB generators than buy it from supply agents. As opposed to this, P2G generators are not being used because it is inefficient. Demand response exists for all three energy sources at any one time, the demand response is affected by load type, energy price and renewable energy power. When the initial load is high, user agents need to bear higher energy costs, so they will increase demand response. The gas load at each time is low, that is, why gas demand response is low. To reduce REI’s carbon emissions and enhance the different agents’ revenue, this paper proposes a multi-agent schedule optimization method considering the improved tiered reward and punishment carbon trading model. The advantages of this method are as follows. 1) The proposed improved tiered reward and punishment carbon trading model can reward or punish enterprises at different levels to reduce carbon emissions. Considering the game, this paper only changes the carbon trading model for simulation, and the results show that compared with the traditional model, the proposed model can reduce carbon emissions by about 1.3% in the REI. 2) The proposed multi-agent schedule optimization method can stimulate the energy conservation and emissions reduction participation of each agent to reduce carbon emissions and enhance revenue. Considering the improved tiered reward and punishment carbon trading model, this paper only changes the game energy types for simulation, and the results show that compared with the non-game method, this method can reduce carbon emissions by about 5.1% and significantly enhance the revenue of the REI. Nevertheless, the different carbon emissions of the different devices are not considered in this paper. This will be the focus of future work.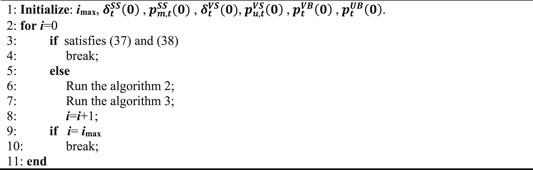
5 Simulation Result
5.1 Carbon Trading Scenes Analysis
5.2 Game Scenes Analysis
5.3 Game and Device Results Analysis
6 Conclusion
Data Availability Statement
The original contributions presented in the study are included in the article/Supplementary Material, further inquiries can be directed to the corresponding author.
Author Contributions
TL and QX constructed the model and method of this paper. HJ and YM collected data. XW, WL, and TP worked together to design scenes.
Funding
The paper is supported by the National Natural Science Foundation of China (U2066213) from the Chinese Government. The author QX is the Subject Investigator of this project and the author TP is the Project Investigator of this project.
Conflict of Interest
Authors XW and TP were employed by the company China Electric Power Research Institute.
The remaining authors declare that the research was conducted in the absence of any commercial or financial relationships that could be construed as a potential conflict of interest.
Publisher’s Note
All claims expressed in this article are solely those of the authors and do not necessarily represent those of their affiliated organizations, or those of the publisher, the editors and the reviewers. Any product that may be evaluated in this article, or claim that may be made by its manufacturer, is not guaranteed or endorsed by the publisher.
Reference
Bahrami, S., and Sheikhi, A. (2015). From Demand Response in Smart Grid toward Integrated Demand Response in Smart Energy Hub. IEEE Trans. Smart Grid 7 (2), 1. doi:10.1109/TSG.2015.2464374
Chen, S., Wen, H., Wu, J., Lei, W., Hou, W., Liu, W., et al. (2019). Internet of Things Based Smart Grids Supported by Intelligent Edge Computing. IEEE Access 7, 74089–74102. doi:10.1109/ACCESS.2019.2920488
Cui, Y., Deng, G., and Zhao, Y. (2021). Economic Dispatch of Power System with Wind Power Considering the Complementarity of Low-Carbon Characteristics of Source Side and Load Side. Proceeding CSEE 41 (14), 4799–4815. doi:10.13334/j.0258-8013.pcsee.202533
Cui, Y., Deng, G., and Zhao, Y. (2022). Multi-time Scale Source-Load Dispatch Method of Power System with Wind Power Considering Low-Carbon Characteristics of Carbon Capture Power Plant. Proceeding CSEE. doi:10.13334/j.0258-8013.pcsee.210697
Huang, Y., Ding, T., and Li, Y. (2021). Decarbonization Technologies and Inspirations for the Development of Novel Power Systems in the Context of Carbon Neutrality. Proceeding CSEE 41, 28–51. doi:10.13334/j.0258-8013.pcsee.211016
Kamruzzaman, M., Duan, J., Shi, D., and Benidris, M. (2021). A Deep Reinforcement Learning-Based Multi-Agent Framework to Enhance Power System Resilience Using Shunt Resources. IEEE Trans. Power Syst. 36 (6), 5525–5536. doi:10.1109/TPWRS.2021.3078446
Li, X., and Niu, S. (2021). Study on Multi-Layer Evaluation System of Source-Grid-Load under Carbon-Neutral Goal. Proceeding CSEE 41, 178–184. doi:10.13334/j.0258-8013.pcsee.211576
Li, Z., Chen, S., and Dong, W. (2021). Low Carbon Transition Pathway of Power Sector under Carbon Emission Constraints. Proceeding CSEE 41 (12), 3987–4000. doi:10.13334/j.0258-8013.pcsee.210671
Mohammadian, M., Aminifar, F., Amjady, N., and Shahidehpour, M. (2021). Data-driven Classifier for Extreme Outage Prediction Based on Bayes Decision Theory. IEEE Trans. Power Syst. 36 (6), 4906–4914. doi:10.1109/TPWRS.2021.3086031
Mohsenian-Rad, A.-H., Wong, V. W. S., Jatskevich, J., Schober, R., and Leon-Garcia, A. (2010). Autonomous Demand-Side Management Based on Game-Theoretic Energy Consumption Scheduling for the Future Smart Grid. IEEE Trans. Smart Grid 1 (6), 320–331. doi:10.1109/TSG.2010.2089069
Peng, N., Liang, R., Wang, G., Sun, P., Chen, C., and Hou, T. (2021). Edge Computing-Based Fault Location in Distribution Networks by Using Asynchronous Transient Amplitudes at Limited Nodes. IEEE Trans. Smart Grid 12 (1), 574–588. doi:10.1109/TSG.2020.3009005
Wang, S., Wang, X., and Wu, W. (2020). Cloud Computing and Local Chip-Based Dynamic Economic Dispatch for Microgrids. IEEE Trans. Smart Grid 11 (5), 3774–3784. doi:10.1109/TSG.2020.2983556
Xiao, Q., Li, T., and Jia, H. (2022). Research on Edge Cloud Collaboration Architecture and Optimization Strategy for Regional Energy Internet. Proceeding CSEE. doi:10.13334/j.0258-8013.pcsee.212931
Yu, M., and Hong, S. H. (2016). Supply-demand Balancing for Power Management in Smart Grid: A Stackelberg Game Approach. Appl. Energy 164 (15), 702–710. doi:10.1016/j.apenergy.2015.12.03910.1016/j.apenergy.2015.12.039
Yuan, G., Liu, H., and Yu, J. (2022). Combined Heat and Power Optimal Dispatching in Virtual Power Plant with Carbon Capture Cogeneration Unit. Proceeding CSEE. doi:10.2107/TM.20211104.2019.005
Zeng, P., Li, H., He, H., and Li, S. (2019). Dynamic Energy Management of a Microgrid Using Approximate Dynamic Programming and Deep Recurrent Neural Network Learning. IEEE Trans. Smart Grid 10 (4), 4435–4445. doi:10.1109/TSG.2018.2859821
Zhang, W., and Xu, Y. (2019). Distributed Optimal Control for Multiple Microgrids in a Distribution Network. IEEE Trans. Smart Grid 10 (4), 3765–3779. doi:10.1109/TSG.2018.2834921
Zhang, X., Liu, X., and Zhong, J. (2020). Integrated Energy System Planning Considering a Reward and Punishment Ladder-type Carbon Trading and Electric-Thermal Transfer Load Uncertainty. Proceeding CSEE 40 (9), 6132–6141. doi:10.13334/j.0258-8013.pcsee.191302
Zhang, X., Shahidehpour, M., Alabdulwahab, A., and Abusorrah, A. (2016). Hourly Electricity Demand Response in the Stochastic Day-Ahead Scheduling of Coordinated Electricity and Natural Gas Networks. IEEE Trans. Power Syst. 31 (1), 592–601. doi:10.1109/TPWRS.2015.2390632
Keywords: carbon trading, multi-agent game, regional energy internet, schedule optimization, reward and punishment mechanism
Citation: Li T, Xiao Q, Jia H, Mu Y, Wang X, Lu W and Pu T (2022) Multi-Agent Schedule Optimization Method for Regional Energy Internet Considering the Improved Tiered Reward and Punishment Carbon Trading Model. Front. Energy Res. 10:916996. doi: 10.3389/fenrg.2022.916996
Received: 10 April 2022; Accepted: 25 April 2022;
Published: 24 May 2022.
Edited by:
Qinran Hu, Southeast University, ChinaCopyright © 2022 Li, Xiao, Jia, Mu, Wang, Lu and Pu. This is an open-access article distributed under the terms of the Creative Commons Attribution License (CC BY). The use, distribution or reproduction in other forums is permitted, provided the original author(s) and the copyright owner(s) are credited and that the original publication in this journal is cited, in accordance with accepted academic practice. No use, distribution or reproduction is permitted which does not comply with these terms.
*Correspondence: Qian Xiao, eGlhb3FpYW5AdGp1LmVkdS5jbg==