 Shijun Shen
 Chaofan Wang
 Zhiqiang Qiu2
 Dawei Gong
94% of researchers rate our articles as excellent or good
Learn more about the work of our research integrity team to safeguard the quality of each article we publish.
Find out more
HYPOTHESIS AND THEORY article
Front. Energy Res., 01 June 2022
Sec. Smart Grids
Volume 10 - 2022 | https://doi.org/10.3389/fenrg.2022.915121
This article is part of the Research TopicAdvanced Cooperative Control and Optimization Strategies for Integrated Energy SystemsView all 17 articles
An autonomous underwater vehicle (AUV) can only carry limited energy for improved flexibility, but this brings the problem of working endurance. The acquisition of environmental energy by an underwater robot is a positive way to supplement energy and increase endurance. However, the instability and difference in power output capacity of different environmental energies will lead to low utilization of environmental energy. In this study, a multi-energy acquisition model is established to manage the AUV’s energy, which includes a heart rate sampling system, a mixed-energy circuit topology, and a maximum power output algorithm of environmental energy based on power trajectory tracking. The simulating results show that the power output control strategy can effectively improve the multi-energy acquisition and utilization efficiency of underwater vehicles, which has a positive significance and could improve endurance time.
In modern society, the application of robots is becoming increasingly extensive, and they play more and more important roles in land, sky, sea, underground, and other occasions. Scholars from all over the world have conducted in-depth research on robot technology.
Underwater robots include manned submersible (HOV), autonomous underwater vehicles (AUV), remotely operated underwater vehicles (ROV), hybrid robots, etc. (Feng and Li, 2013), which are important tools for underwater resource exploration, underwater environment observation, and underwater scientific research. An autonomous underwater vehicle without cable (AUV) has better flexibility, a longer voyage, intelligent autonomous navigation, and other characteristics compared with a wired underwater remote robot, but the endurance time disadvantage is also obvious (Wynn et al., 2014). The endurance, load, voyage, and speed of the AUV are all affected by the energy supply (Feng et al., 2011). All behaviors of robots are based on power supply, but there are few research studies on this aspect (Sun, 2013; Yu, 2015). As the structure and function of AUVs have become increasingly complex, the problem of power matching and power driving has become an important bottleneck, restricting the development of robot technology.
The energy system of an AUV is presently being developed toward the goal of compact structure, small size, low weight, high energy density, and long endurance (Fang and Li, 2012). To date, AUV energy is roughly divided into traditional energy and new energy. Traditional energy is obtained from one of the various chemical batteries (lead-acid battery, lithium-ion battery, silver–zinc battery, lithium polymer battery, etc.) as the sole power of an AUV, but the non-renewable battery energy greatly limits the activity range of the AUV, and the operation to recycle the AUV to charge the battery is certainly complex (Ren et al., 2017). Although conventional batteries still play a dominant role in AUV energy systems, environmental energy is being developed as a complementary energy source for AUVs.
In recent years, many scholars have begun to explore the possibility of application in the field of new energy and propose the scheme of environmental power generation on an AUV. Solar energy, thermoelectric energy, and wave energy are used as energy sources to support the long-term operation requirements of the AUV (Webb et al., 2001). Using renewable energy in an underwater environment such as the AUV’s power can reduce or eliminate the cost of regular battery recharging, further freeing the AUV from the tether and allowing it to navigate autonomously.
For example, in January 1998, the Office of Naval Research of the United States produced the underwater solar robot engineering sample, the solar-powered autonomous underwater vehicle (SAUV) (Figure 1) and tested it in Vladivostok (Ageev et al., 2002). Eco Marine Power of Japan started the Aquarius USV study in 2011 and tested it in 2015. Aquarius USV is designed as a trimaran, with solar panels connected across each hull. The USV is 5 m long and 8 m wide and can reach a speed of 6 kn (Eco Marine Power, 2014).
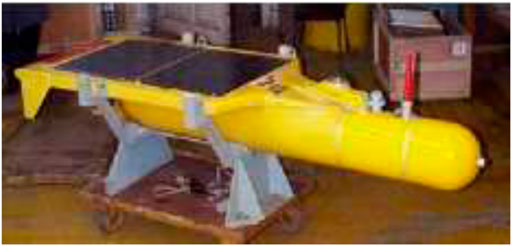
FIGURE 1. Engineering prototype of the SAUV.
The British company AutoNaut launched the wave-assisted surface unmanned boat AutoNaut USV in 2012 (Auto Naut, 2016). Solar panels in series on the surface of the robot can provide electricity of 125 W, and it can also be equipped with methanol fuel cells of 25 W to increase the endurance. The USV is propelled by thrusters with a speed of 1 kn ∼ 2 kn and a maximum of 3 kn (National Oceanography Center, 2016). Researchers at the University of Pisa in Italy developed the wave energy recovery system module, shown in Figure 2. The module consists of two wings that can be mounted on an underwater glider. The wing ends are connected to the module by movable joints, and the internal joint mechanism of the module is connected to the generator. It was tested in the Tyrrhenian Sea in 2016, and it was found that the wave energy recovery system module can continuously generate power (Fenucci et al., 2016). Other applications, such as wind energy and thermoelectric energy, have also been extensively studied on underwater robots (Elkaim, 2006; Elkaim and Boyce Lee, 2007; Ma et al., 2016; Yang et al., 2016).
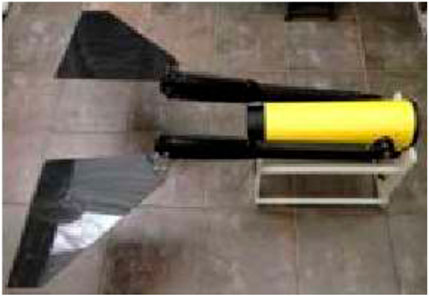
FIGURE 2. Wave energy recovery system module.
In terms of energy management, most researchers are focusing on the energy distribution strategy of batteries (Bao and Zhang, 2016; Xie, 2018; Zhang and Li, 2018; Rui et al., 2020; Zhang et al., 2020). But, improving the mixed utilization efficiency of batteries and environmental energy will become the research and development focus of AUV technology in the future (Wynn et al., 2014). Wang et al. (2019); Rui et al. (2020); and Wang et al. (2021)studied SOC balancing speed and state of the battery based on improved droop control to solve the problem of battery state prediction under charge. Chen et al. (2021) adopted the load power following strategy in hybrid electric vehicles to achieve the goals of battery conservation and increased its working range. However, most of the research studies on energy management focus on battery charge and discharge management, and there are few research studies on how to improve the utilization efficiency of multi-environment mixed energy.
Taking the underwater robot as a platform and aiming at multi-environment energy acquisition and utilization, this study proposes an efficient energy acquisition circuit topology, an energy-saving and efficient heart rate sampling system, and a maximum power output control algorithm based on mixed-energy power trajectory tracking. The mathematical model is built and simulated by MATLAB. The simulation results show that the circuit topology combined with the algorithm can effectively improve the environmental hybrid energy utilization and underwater navigation time of the AUV.
Considering the environment of the underwater robot, this study chose to collect mixed-energy sources, including wave energy, thermoelectric energy, and solar energy.
The battery is still the main energy source of the AUV. The charging and discharging state of the battery is switched according to the load power and the output power of the mixed energy of the AUV. It is assumed that the load power is PL and the mixed energy output power is Pm. When PL > Pm, the battery discharges, and when PL < Pm, the battery accepts the mixed energy for charging.
According to the design scheme in this study, the energy acquisition and management framework of the underwater robot is shown in Figure 3.
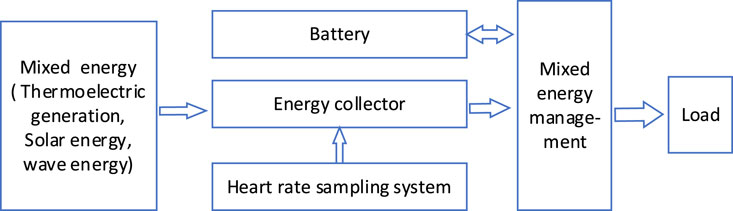
FIGURE 3. Block diagram of hybrid energy acquisition and management of the AUV.
Among them, we will configure a supercapacitor for each energy module to store energy. The energy collector is a collection and execution module of mixed energy. The heart rate sampling system collects the output voltage and power of mixed energy and provides data support for the maximum power output algorithm based on power trajectory tracking. Mixed energy management is the core of system management, which internally stores the power curve data of mixed energy, controls the collection sequence of mixed energy, controls the output voltage of DC–DC, and controls the switch of battery charge and discharge.
To verify the effectiveness of the system, this study will establish all the mixed-energy models, establish the energy acquisition circuit topology, and use MATLAB to simulate and analyze.
There is a transverse current in the electrode surface layer of the photovoltaic cell, so a resistor
Here,
q is the electron charge constant (1.6
U is the load terminal voltage (V);
I is the working current of load (A);
A is the constant factor of the diode (A = 1 when the positive bias voltage is large, A = 2 when the positive bias voltage is low);
K is the Boltzmann constant (1.38×
T is the degree K ; and
On the basis of Equation 1-1, the formula is simplified to obtain a practical engineering mathematical model (Dey and Qin, 2009). In photovoltaic cells, the resistance value of parallel resistance
where
In addition, the relationship between current and voltage is also analyzed under the conditions of a maximum power point and open circuit:
(1) When the system is at the maximum power point,
(2) When the system is at an open circuit,
where
Based on the aforementioned analysis of the mathematical model of photovoltaic cells, Equation (1-1) can be simplified into Equation (1-5).
Under normal temperature
The I–V characteristic curve of photovoltaic cells is closely related to the irradiation intensity and external temperature. Formula (1-5) describes the characteristic curve under standard irradiation intensity
According to the
In the aforementioned equations,
Based on the aforementioned analysis, this study established a solar power generation model in Simulink and the following conditions are set according to the actual situation.
(1) Select the Dx-60 (STP060-12/Sb) photovoltaic cells from Sun Tech-Power, whose main parameters are
Here,
(2) Set T = 35°,
(3) To reflect the fluctuation of photovoltaic power generation, this study particularly sets the light intensity to change according to a sinusoidal curve. According to the actual situation, the light intensity of 0–3 m underwater is set as follows:
The U-t curve and P-t curve are obtained after simulation, as shown in Figure 4 and Figure 5.
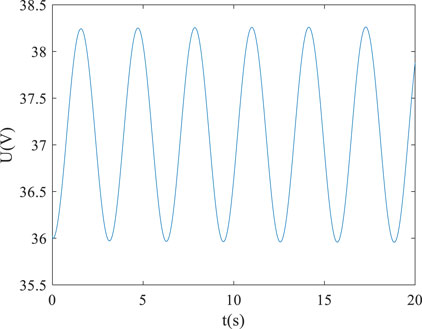
FIGURE 4. U-t curve of the photovoltaic cell.
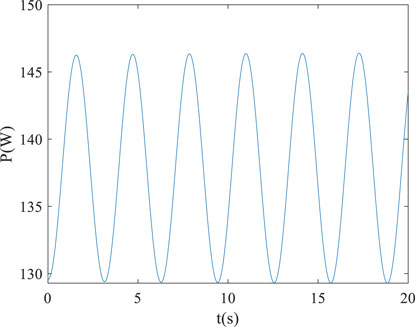
FIGURE 5. P-t curve of the photovoltaic cell.
The thermoelectric effect is known as the Seebeck effect. A circuit comprising different materials X and Y will produce a current in the circuit when the temperature of the contact is varying, which is called the Seebeck effect (Chen et al., 2000; Xiao et al., 2011; Venkata Rao and Patel, 2013).
Suppose that joints A and B are maintained at different temperatures, there will be a potential difference between the open position of conductor X, called the Seebeck voltage. Its value is
where
When the temperature difference
The unit of the Seebeck coefficient is
The thermoelectric generation module comprises semiconductor thermoelectric generation units in series and parallel. The main parameters describing the performance of a semiconductor thermoelectric generator include thermoelectric conversion efficiency, output power, and so on. Therefore, to study the performance parameters of the whole power generation module, we can start with the analysis of the temperature difference power generation unit. The following is a specific analysis of the temperature difference power generation unit from the perspective of energy balance. It is assumed that the sides of both n-type and P-type galvanic arms are adiabatic, that is, there is no heat exchange between these sides and the environment.
According to the Seebeck effect described previously, the Seebeck voltage generated in the circuit when the temperature difference exists at both ends of the semiconductor element is as follows:
It can be seen that this voltage is applied to the internal resistance
The current in the loop is expressed as
Therefore, the output power of the thermoelectric generator can be obtained as follows:
When the load resistance
In this study, the AUV is assumed to be used in shallow water. The source of the temperature difference is the internal temperature and external water temperature of the AUV.
To reflect the fluctuation of the thermoelectric generator, the temperature of the hot side is kept unchanged, and the temperature of the cold side is especially set to change according to the sine curve. The input conditions of the thermoelectric module are set as
(1)
(2) The temperature of the cold side is set according to the following formula:
Based on the aforementioned analysis of the mathematical model of the thermoelectric generator, the U-t and P-t curves of the thermoelectric generator are simulated in Simulink as shown in Figure 6 and Figure 7.
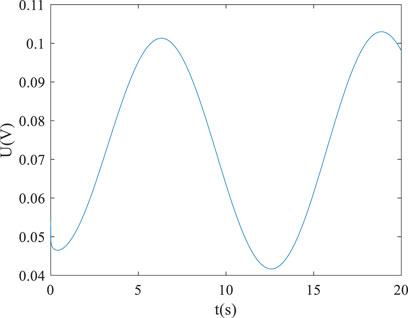
FIGURE 6. U-t curve of the thermoelectric generator.
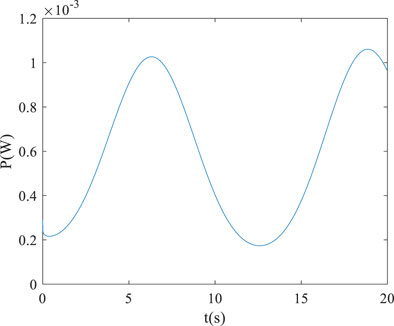
FIGURE 7. P-t curve of the thermoelectric generator.
Wave energy refers to the kinetic and potential energy of waves formed on the surface of the water. In practice, the energy can be obtained by using the oscillating and swaying motion generated by the robot under the action of waves (Luo et al., 2013; Sun, 2015).
Cylindrical floats absorb maximum wave energy, but there is a complex restriction relationship between the float and the parameters of a linear motor; therefore, the conversion efficiency of the system can be maximized only by optimizing the parameters of the whole device. The main advantage of the floating type is its convenience in construction. It has strong adaptability to the change in the tide level. Because of the superficiality of waves, to absorb wave energy, the device should be as close to the water as possible, while the floating type can meet this requirement well. Wave fluctuation is mainly manifested by longitudinal reciprocating motion. The longitudinal reciprocating movement of the water surface makes the buoy in the wave subject to longitudinal buoyancy that changes with the surface of the water so that the float vibrates up and down and drives the motor to generate electricity. At the same time, the motor also gives the buoy a force that hinders its movement. The amount of buoyancy on a float depends on its shape and size. Many factors affect the wave form, but so far, no mathematical model can accurately simulate the wave form. To facilitate calculation, this study uses sine waves to approximate the wave. When the linear motor is rated to work, the buoy vibrates up and down, so the resultant force on the buoy can be expressed as
where
The resultant force on the buoy has been obtained through the parameters of the motor and float. The steady-state operation analysis of the device can be obtained as follows:
where
It can be seen that the displacement of the buoy and the angular velocity of the wave have the same sine change, and the amplitude is calculated as follows:
In a steady-state operation, the velocity of the buoy is
The linear speed of the buoy is directly proportional to the stator of the linear motor, and since there is no transmission device, it can be considered that the speed of the two is the same, so the electromagnetic power of the linear motor is
where
Set the rated wave to be sinusoidal simple harmonic with constant wave length
Depending on the possible reality of the environment in which the AUV is working, this study set the wave power generation input parameters as
(1)
where
(2) It is assumed that the wave is simple harmonic, and then Z is the harmonic equation of the displacement of a particle on the wave surface.
where wave amplitude A = 0.6, ω is the angular frequency, and wavelength λ = 0.8. Because of the structural particularity of the wave energy acquisition module, its initial output voltage is AC, so we take the voltage after rectification as a reference. The wave energy rectification method is full-wave rectification.
Based on the aforementioned wave power generation model and setting conditions, the U-t and P-t curves are obtained by using Simulink as shown in Figure 8 and Figure 9.
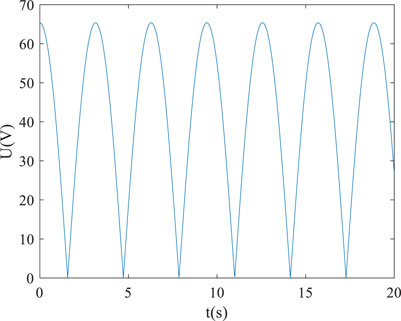
FIGURE 8. U-t curve of wave energy generation.
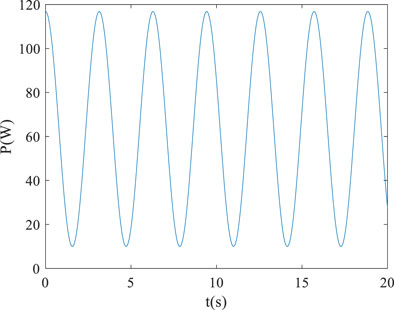
FIGURE 9. P-t curve of wave energy generation.
Environmental energy is characterized by instability and weakness. When an energy module is in an unfriendly environment, it is likely that the module will not be output. If the port voltage of each energy module is collected in real time without judgment, the additional system power consumption will be increased.
Therefore, according to the characteristics of environmental energy, this study designed a heart rate sampling system driven by an environmental energy module. The sampling sequence obtained by the system can be approximated to a nonuniform sampling sequence, which is analyzed by combining the theory of nonuniform sampling and restored by the nonuniform sampling reconstruction method.
To realize the signal sampling detection, the sampling frequency of uniform sampling is twice that of the sampled signal, that is, the low-frequency signal is sampled with high frequency. In real life, all kinds of signals include noise and high-frequency harmonic components. If only uniform sampling is used to sample such signals, a spectrum aliasing phenomenon is highly likely to occur.
Compared with uniform sampling, the most prominent advantage of nonuniform sampling is that the randomness of sampling points can realize the irregular arrangement of the aliasing signals to all frequency values so that the frequency values higher than half or even higher than the sampling frequency can be sampled, breaking the limit of the Shannon sampling theorem. Nonuniform sampling not only has the characteristics of random point sampling uniformity of anti-aliasing but also has the piecewise uniform quality.
The heart rate sampling system based on environmental energy collection is shown in Figure 10. As the controller of the system, the energy collector also needs to control the heart rate sampling system, while the sampling system is controlled by the output voltage of the environmental energy module.
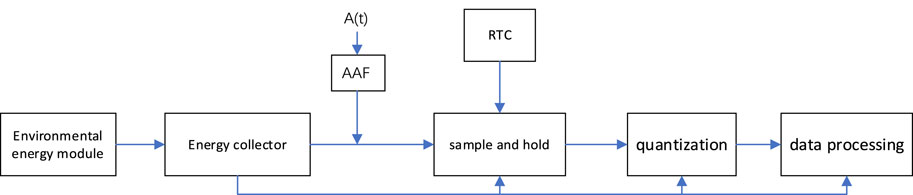
FIGURE 10. Structural diagram of the heart rate sampling system.
A(t) is the sampled signal. The discontinuous energy generated by the environmental energy drives the sampling device to perform the sampling work; at the same time, the sampling sequence is thus obtained. The discontinuous energy replaces the continuous energy supply in the existing traditional sampling system to finish the original signal’s sampling.
The RTC is used to record the time of the sampling site and its primary responsibility is to provide an accurate time baseline.
Because of the instability of environmental energy, the sampling system is prone to power failure. Therefore, a low-power power failure storage system “sample and hold” is designed in this study.
Because of the instability and the functional difference of different environmental energies, after collecting the environmental energy, it needs to use a DC–DC boost (or step-down) and stabilize the voltage value at the value required by the load. There are basically two types of mixed-energy management circuit topologies, single-energy with single-voltage converter circuit topology (Figure 11A) and multi-energy with single-voltage converter circuit topology (Figure 11B).
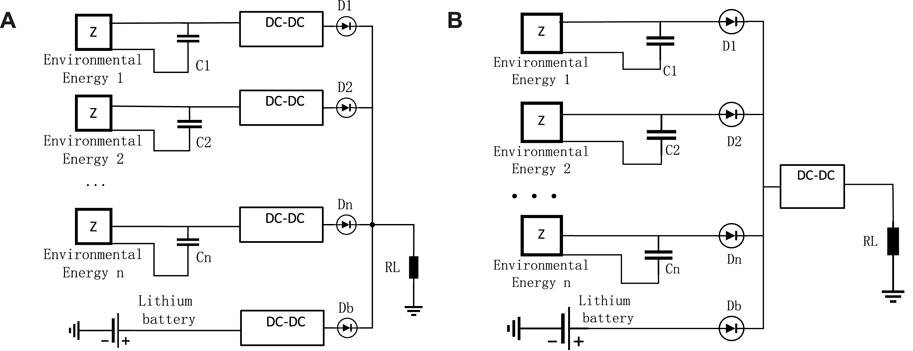
FIGURE 11. Traditional multi-energy management circuit topology: (A) Single-module single DC–DC circuit topology and (B) Multi-module single DC–DC circuit topology.
As there are multiple DC–DC modules, there will be more voltage conversion losses and higher costs in the circuit topologies shown in Figure 11A. In Figure 11B, there is only one DC–DC, with relatively low cost and energy loss, but only one energy module is discharging at a time. That is to say, only the environmental energy module with the highest port voltage can output electric energy. This passive energy release prevents the lower-voltage energy module from discharging, which may result in environmental energy never being released, thus deteriorating the environmental energy that has been collected with great effort.
It can be seen from the aforementioned analysis that the circuit topology shown in Figure 11B consumes less energy. Therefore, this study will optimize the circuit topology based on what is shown in Figure 11B. To make each channel of environmental energy be an active discharge, this study adds a controllable switch for each environmental energy module. To ensure that the power of the current discharging energy module is the maximum, this study designs the maximum output power algorithm based on power trajectory tracking. Combined with the heart rate sampling system, the improved circuit topology is shown in Figure 12.
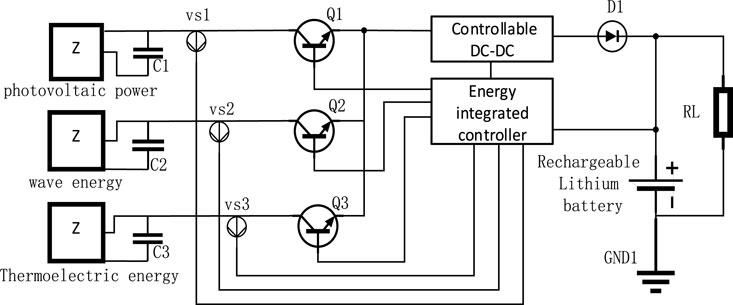
FIGURE 12. Energy management circuit topology
C1, C2, and C3 are ultra-capacitors; VS.1, VS.2, and VS.3 are voltage sensors of the heart rate sampling system; Q1, Q2, and Q3 are three controllable triodes; and D1 is a single guided diode.
There is only one DC–DC module in this circuit topology, and all energy sources (except batteries) use the same DC–DC module, which can effectively reduce the loss of environmental energy in the conversion process. However, the problem caused by this topology is that energy sources with different port voltages cannot output their energy at the same time. Only one kind of energy can be output at a time, and other energies are temporarily stored by the ultra-capacitors.
There is one DC–DC module and three diodes in Figure 11B. One DC–DC module, one diode, and three controlled triodes are shown in Figure 12. Let us say that in two diagrams, we use the same type of DC–DC module and diode, so the second circuit has three more triodes and two fewer diodes than the first circuit.
It is supposed that the controlled triode we use is a kind of MOSFET whose internal resistance is 10 mΩ, and the diode is a common rectifying diode whose conduction voltage drop is 0.7 v. It is supposed that when the circuit current is 10 A, the power loss on the diode is 10*0.7 = 7 W, and the power loss of MOSFET is 10*10*0.01 = 1 W. The power loss of a total of three MOSFETs is 3 W, while the power loss of two diodes is 14 W. That means the power loss of the circuit in Figure 12 is 11 W less than that of the circuit in Figure 11 (b).
During the operation of this circuit, two (or more) energies may complete storing and need to be discharged to the load or the battery. According to previous studies, the order of energy release is generally determined according to the current voltage of the energy module, that is, the one with the highest voltage is the first to discharge. However, because of the randomness of environmental energy and the functional difference between different energy modules, the power released by the energy module with a high voltage value is not necessarily the maximum (the discharge current needs to be considered).
Different environmental conditions, different working principles, and different output power capacities will cause different energy acquisition modules to have different power output under the same (open road) output voltage. Therefore, when the environment energy is not connected to the load, we cannot determine its power output ability by the open-circuit voltage value.
It is assumed that the voltage and discharging power per unit time of two energy modules are V1 and V2 and P1 and P2, respectively. Even V1 > V2, but P2 > P1 may occur. In view of this situation, to effectively improve energy utilization, the maximum power control strategy based on power trajectory tracking is proposed in this study.
The maximum power control strategy based on power trajectory tracking is to control the discharge sequence of the energy module in a sufficiently small period to ensure the environmental energy discharge with the maximum power output capacity at the moment. That means the strategy is used to ensure the maximum energy obtained by the load at the moment.
Based on this, the flow diagram of this energy management system is designed as shown in Figure 13.
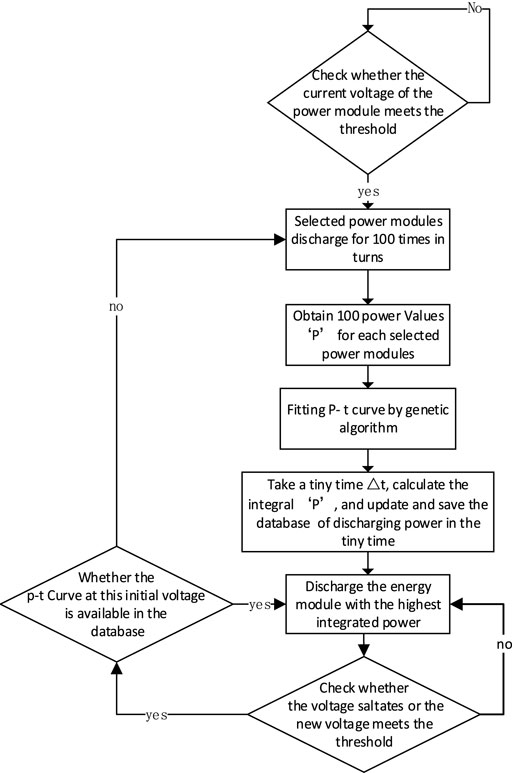
FIGURE 13. Flow diagram of the maximum power control strategy based on power trajectory tracking.
To effectively improve the efficiency of the DC–DC module, this study sets a voltage threshold, and only the energy module that meets the threshold is allowed to output electric energy.
In the process of simulation, it is found that solar energy and wave energy are basically at the same power level, while thermoelectric energy is far less than the other two kinds of energies. Thermoelectric energy will, therefore, be stored in an ultra-capacitor for a long time until its voltage reaches a threshold. The power-release time depends on whether the release power of the thermoelectric energy is the maximum during this period (compared with other environmental energy modules).
To ensure that the energy module with the highest power discharges at any time, we must know the discharge capacity of all energy modules. Therefore, we need to measure the discharge power of all energy modules in different environments, synthesize the power curve and save them, and form a large database of power curves at last.
In a real system, how to define different environments is an issue to consider. After studying enough environmental energy collection modules, it is found that the port voltage of the energy module has a certain proportional relationship with the external environment. Therefore, the control strategy in this study stipulates that those different environmental energies are determined by different energy module port voltages.
Therefore, the aforementioned description can be summarized as follows: we need to measure the discharge power of all energy modules under different initial voltages, form and save power curves under different initial voltages, and form a large database of power curves under different initial port voltages.
The procedure of power tracking of all power modules that meet the voltage threshold is as follows.
1. The port voltage of all energy modules is measured by the heart rate sampling system, and the energy modules meeting the voltage threshold for a little period are opened in turn to obtain 100 power points of different energy modules.
2. The measured power points fit into P-t curves using the genetic algorithm.
3. A small unit time is selected and the power integral value in unit time is calculated according to this curve. This power integral value is saved, and a large database of power integral values in unit time is formed under different energy modules and different voltage values.
Next, the power module with the maximum power integral value at the current time to discharge to the load is chosen. During the discharge process, the voltage of each energy module has to be checked for a voltage mutation and whether the terminal voltage of the new energy module meets the voltage threshold. If not, the previous discharge sequence is performed. If yes, the power curve of the energy module is checked at the current voltage and stored in the power curve database. If not, it is necessary to collect the power values of 100 energy modules that meet the requirements again and fit them into P-t curves, integrate them again, and save and update the large database. However, if the data exist in the database, the energy module that is to be discharged at the next moment can be determined directly according to the integral value of the power per unit time saved in the big data.
To better explain the big data of the power curve of multi-energy modules, we assume that there are now two types of energy modules, E1 and E2. At the initial moment, the voltage of E1 is V1, and after discharging for a short period of time, different power values under different voltages are obtained, denoted as
Using the genetic algorithm to fit 100 power points which are under the voltage V1, V2 ... Vn into a power curve, denoted as
In total, 100 power points of E2 were obtained, fitted into the power curve, and saved in the same way.
The little period is taken
The power integral large database saves the power integral values of different energy modules in a micro-period under certain environmental conditions. Any change in the output power of an energy module due to environmental changes is measured again and saved. That is, the database can self-update, self-preserve, and self-learn according to the measurement system and the learning results to determine the discharge sequence of energy modules. The aforementioned process shows that the longer the system runs, the larger its database will be, but the more efficient its execution will be.
The database does not use the original discharge power curve of the energy module (which can be obtained from the factory manual of the energy acquisition module) but uses the power curve synthesized by the real-time measuring system as a reference, which effectively avoids the error between the original power curve and the actual power curve caused by the decrease of the hardware working efficiency.
One of the biggest features of the maximum power output algorithm based on power trajectory tracking is adaptability. Combined with data acquisition and saving, the algorithm can adapt to different (environmental energy collection) hardware systems and automatically adjust the voltage threshold and the controlled triode through the output power of the system.
To sum up, the system can always maintain the maximum power output, effectively improve the utilization of environmental mixed energy, and improve the endurance of wearable devices.
To verify the effectiveness of the algorithm, a mixed environmental energy collection and management system model was established in Simulink, as shown in Figure 14.
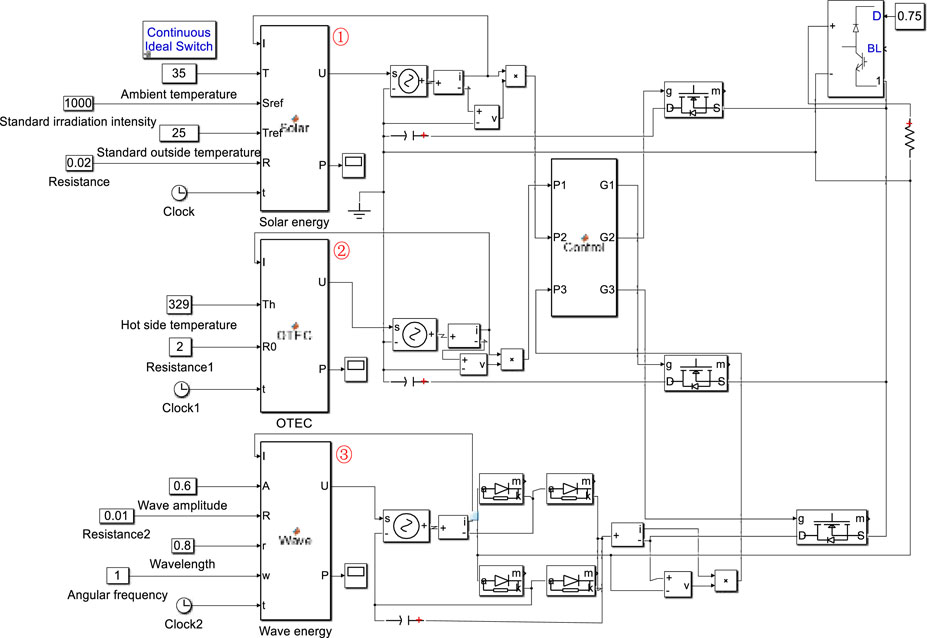
FIGURE 14. Mixed environmental energy collection and the management system model.
Modules ①, ②, ③ are the solar power generation, wave power generation, and thermoelectric power generation, respectively.
To reflect the circuit topology of the energy acquisition and the energy efficiency of the maximum power algorithm, this study builds a model in Simulink according to the circuit topology in Figure 11B and adds exactly the same energy module as shown in Figure 14 with the same input conditions.
After the two model simulations, the power curve of the system is shown in Figure 15.
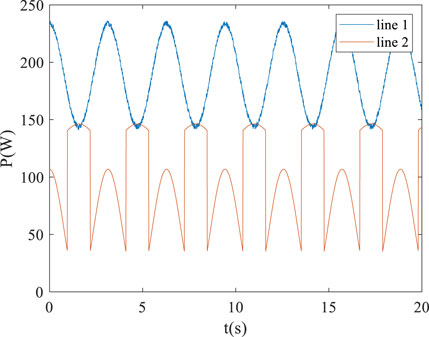
FIGURE 15. Simulated cure of the maximum power control strategy based on power trajectory tracking.
Line 1 is the simulation result of the corresponding model shown in Figure 14, and line 2 is the simulation result of the corresponding model shown in Figure 11B. It can be seen from line 2 that the passive circuit topology only outputs the energy with the highest voltage value at the current time. Because the solar and wave energies set in the simulation model are relatively high, the ultra-capacitor with a certain capacity cannot store too much energy for a long time, resulting in a serious waste of energy with a low current voltage. It can be seen from line 1 that the active circuit topology combined with the maximum power algorithm can ensure the maximum power output at the current moment and the supercapacitor can repeatedly store and discharge energy in a short time to maximize the discharge of the collected environmental energy.
As we know, the smaller the time Δt in the system, the better the system control effect will be. However, calculating the integral under an extremely small Δt will occupy many computing resources and increase the energy consumption of the system. Therefore, Δt = 0.1 ms is adopted in this study.
This study designed an active and controllable environmental energy acquisition circuit topology that establishes a heart rate sampling system, and innovatively designs a maximum output power algorithm based on power trajectory tracking. According to the application environment of an AUV, solar energy, wave energy, and temperature difference energy were selected as the environmental energy sources of the AUV. The mathematical models of these three energies were analyzed, established, and simulated in MATLAB and Simulink. Finally, passive (Figure 11 (b)) and active (Figure 14) circuit models were established in Simulink, and identical input configurations were set for the two circuit models. The simulation results show that compared with the passive environmental energy acquisition mode, the active and controllable environmental energy acquisition circuit combined with the maximum power algorithm can effectively avoid the waste of environmental energy, improve the utilization of environmental energy, and improve the endurance of the underwater robot.
The original contributions presented in the study are included in the article/Supplementary Material; further inquiries can be directed to the corresponding author.
SS completed the active and controllable circuit topology design, maximum power algorithm design, and wrote the manuscript. CW completed the establishment and simulation of all the models. ZQ completed research on underwater robots that use environmental energy. ZK completed the mathematical analysis of environmental energy in the manuscript. DG completed the structure design, algorithm and circuit correctness analysis, and simulation data analysis of the whole manuscript.
This work was supported by the National Natural Science Foundation of China (Nos. 61803285 and 62001332) and the National Defense Pre-Research Foundation of China (No. H04W201018).
The authors declare that the research was conducted in the absence of any commercial or financial relationships that could be construed as a potential conflict of interest.
All claims expressed in this article are solely those of the authors and do not necessarily represent those of their affiliated organizations, or those of the publisher, the editors, and the reviewers. Any product that may be evaluated in this article, or claim that may be made by its manufacturer, is not guaranteed or endorsed by the publisher.
Ageev, M. D., Blidberg, D. R., Jalbert, J., Melchin, C. J., and Troop, D. P. (2002). “Results of the Eval-Uation and Testing of the Solar Powered AUV and its Subsys-Tems,” in Autonomous Underwater Vehicles, 2002. Proceedings of the 2002 Workshop on, February 2002 (Piscataway, USA: IEEE), 137–145. doi:10.1109/AUV.2002.1177216
Auto Naut (2016). Autonaut in Chichester Marina [EB/OL]. AvaliableAt: http://www.autonautusv.com/gallery/autonaut-chichester-marina.
Bao, Z. K., and Zhang, H. F. (2016). Optimal Local Control Strategy for Disease Transmission over Two-Dimensional Kleinberg Networks[J]. J. Univ. Electron. Sci. Technol. China 45 (3), 475–480. doi:10.3969/j.issn.1001-0548.2016.02.028
Chen, J., Lin, B., Wang, H., and Lin, G. (2000). Optimal Design of a Multi-Couple Thermoelectric Generator. Semicond. Sci. Technol. 15 (2), 184–188. doi:10.1088/0268-1242/15/2/318
Chen, W., Li, J., and Qi, L. (2021). Power Following Control Strategy for SOC Dynamic Adjustment of Fuel Cell Compact Vehicle [J]. J. Southwest Jiaot. Univ. 56 (1), 197–205. doi:10.3969/j.issn.0258-2724.20190552
Dey, B., and Qin, C. (2009). Mathematical Model and Simulation Analysis of Photovoltaic Module Electrical Characteristics. Semicond. Optoelectron. 30 (1), 47–50. doi:10.16818/j.issn1001-5868.2009.01.011
Eco Marine Power (2014). Aquarius Unmanned Surface Vessel [EB/OL]. AvaliableAt: http://www.ecomarinepower.com/en/aquarius-usv.
Elkaim, G. H., and Boyce Lee, C. O. (2007). “Experimental Validation of GPS-Based Control of an Unmanned Wing-Sailed Catamaran[C],” in ION GNSS 20th International Meeting of the Satellite Division, Fort Worth Convention Center, USA, September 25 - 28, 2007 (North MiamiBeach, USA: Curran Associates Inc.), 1950–1956.
Elkaim, G. H. (2006). The Atlantis Project: A GPS-Guided Wing-Sailed Autonomous Catamaran. Navigation 53 (4), 237–247. doi:10.1002/j.2161-4296.2006.tb00386.x
Fang, H., and Li, Z. (2012). Review of Energy System Technology for Autonomous Underwater Vehicle [J]. J. Electr. Power Syst. Automation. doi:10.19635/j.cnki.csu-epsa.000965
Feng, X. S., and Li, Y. P. (2013). Thirty Years Evolution of SIA’s Unmanned Marine Vehicles[J]. China Sci. Bull. 58 (s2), 2–7. doi:10.1360/972013-1120
Feng, X., Li, Y., and Xu, H. (2011). The Next Generation of Unmanned Marine Vehicles Dedicated to the 50 Anniversary of the Human World Record Diving 10912 M. Robot 33 (1), 113–118. doi:10.3724/sp.j.1218.2011.00113
Fenucci, D., Caffaz, A., Costanzi, R., Fontanesi, E., Manzari, V., Sani, L., et al. (2016). “WAVE: A Wave En-Ergy Recovery Module for Long Endurance Gliders and AUVs[C],” in OCEANS 2016 MTS/IEEE Monterey, Monterey, CA, USA, 19-23 Sept. 2016 (Piscataway, USA: IEEE). doi:10.1109/OCEANS.2016.7761136
Luo, J., Yang, Y., and Dong, H. T. (2013). Energy and Harvesting Technology in Underwater Environment[J]. Mine Warf. Ship Self Def. 21 (2), 29–33. doi:10.1109/EIT.2012.6220721
Ma, Z., Wang, Y., Wang, S., and Yang, Y. (2016). Ocean Thermal Energy Harvesting with Phase Change Material for Underwater Glider. Appl. Energy 178, 557–566. doi:10.1016/j.apenergy.2016.06.078
National Oceanography Center (2016). Autonomous Surface Vehicles [EB/OL]. Avaliable at: http://noc.ac.uk/facilities/marine-autonomous-robotic-systems/asv.
Ren, L., Lin, S., Qing, Z., Fei, D., and Liu, X. J. (2017). Application Status and Development Trend of Power Battery for AUV[J]. Chin. J. Power Sources 41 (6), 952–955. doi:10.3969/j.issn.1002-087X.2017.06.040
Rui, W., Qiuye, S., Pinjia, Z., Yonghao, G., Dehao, Q., and Peng, W. (2020). Reduced-Order Transfer Function Model of the Droop-Controlled Inverter via Jordan Continued-Fraction Expansion. IEEE Trans. Energy Convers. 35 (3), 1585–1595. doi:10.1109/tec.2020.2980033
Sun, Z. F. (2015). Development Status of Marine Energy Utilization Technology at Home and Abroad[J]. Ship Build. China 56 (S2), 519–526. doi:10.1155/2013/941781
Venkata Rao, R., and Patel, V. (2013). Multi-objective Optimization of Two Stage Thermoelectric Cooler Using a Modified Teaching-Learning-Based Optimization Algorithm. Eng. Appl. Artif. Intell. 26 (1), 430–445. doi:10.1016/j.engappai.2012.02.016
Wang, R., Sun, Q., Hu, W., Li, Y., Ma, D., and Wang, P. (2021). SoC-Based Droop Coefficients Stability Region Analysis of the Battery for Stand-Alone Supply Systems with Constant Power Loads. IEEE Trans. Power Electron. 36 (7), 7866–7879. doi:10.1109/tpel.2021.3049241
Wang, R., Sun, Q., Ma, D., and Liu, Z. (2019). The Small-Signal Stability Analysis of the Droop-Controlled Converter in Electromagnetic Timescale. IEEE Trans. Sustain. Energy 10 (3), 1459–1469. doi:10.1109/tste.2019.2894633
Webb, D. C., Simonetti, P. J., and Jones, C. P. (2001). SLOCUM: an Underwater Glider Propelled by Environmental Energy:an Underwater Glider Propelled by Environmental Energy[J]. IEEE J. Ocean. Eng. 26 (4), 447–452. doi:10.1109/48.972077
Wynn, R. B., Huvenne, V. A. I., Le Bas, T. P., Murton, B. J., Connelly, D. P., Brtt, B. J., et al. (2014). Autonomous Underwater Vehicles (AUVs): Their Past, Present and Future Contributions to the Advancement of Marine Geoscience[J]. Mar. Geol. 352, 451–468. doi:10.1016/j.margeo.2014.03.012
Xiao, X., Meng, X., Le, D. D., and Takarada, T. (2011). Two-stage Steam Gasification of Waste Biomass in Fluidized Bed at Low Temperature: Parametric Investigations and Performance Optimization. Bioresour. Technol. 102 (2), 1975–1981. doi:10.1016/j.biortech.2010.09.016
Xie, R. (2018). Research on Rule-Based Control Strategy for Extended Range Electric Vehicle [D]. Beijing: Beijing University of Technology.
Yang, Y., Wang, Y., Ma, Z., and Wang, S. (2016). A Thermal Engine for Underwater Glider Driven by Ocean Thermal Energy. Appl. Therm. Eng. 99, 455–464. doi:10.1016/j.applthermaleng.2016.01.038
Yu, T. (2015). Research on Contactless Power Transmission of Autonomous Underwater Vehicle[D]. Harbin: Harbin Engineering University.
Zhang, B. D., Guo, S., Zhang, X., Xue, C., and Teng, L. (2020). Adaptive Smoothing Power Following Control Strategy Based on an Optimal Efficiency Map for a Hybrid Electric Tracked Vehicle[J]. Energies 13 (8), 1–25. doi:10.3390/en13081893
Keywords: underwater robot, unstable multi-energy, integrated energy management, power trajectory tracking, maximum power output
Citation: Shen S, Wang C, Qiu Z, Ke Z and Gong D (2022) Multi-Energy Acquisition Modeling and Control Strategy of Underwater Vehicles . Front. Energy Res. 10:915121. doi: 10.3389/fenrg.2022.915121
Received: 07 April 2022; Accepted: 20 April 2022;
Published: 01 June 2022.
Edited by:
Rui Wang, Northeastern University, ChinaReviewed by:
Shenquan Wang, Changchun University of Technology, ChinaCopyright © 2022 Shen, Wang, Qiu, Ke and Gong. This is an open-access article distributed under the terms of the Creative Commons Attribution License (CC BY). The use, distribution or reproduction in other forums is permitted, provided the original author(s) and the copyright owner(s) are credited and that the original publication in this journal is cited, in accordance with accepted academic practice. No use, distribution or reproduction is permitted which does not comply with these terms.
*Correspondence: Dawei Gong, cHpoemh4QDEyNi5jb20=
Disclaimer: All claims expressed in this article are solely those of the authors and do not necessarily represent those of their affiliated organizations, or those of the publisher, the editors and the reviewers. Any product that may be evaluated in this article or claim that may be made by its manufacturer is not guaranteed or endorsed by the publisher.
Research integrity at Frontiers
Learn more about the work of our research integrity team to safeguard the quality of each article we publish.