Abstract
A 1/3 scaled-down mock-up reactor of ACP100 was used to simulate the flow field in the prototype reactor and to carry out the experiment of core inlet flow distribution. In the mock-up reactor, the major flow path of the reactor is linearly scaled except for the core region which is replaced by 57 dummy fuel assemblies. In addition, the experiment measures core inlet flow rates by a specially designed turbine installed in each dummy fuel assembly. In the experiment, both four-loop balanced and unbalanced operating conditions are tested. The experimental results show that the flow in the major flow path of the mock-up reactor has entered the self-modeling zone and the flow field characteristics are the same as the prototype. The core inlet flow rates of different tests show similar distributions, which all meet the hydraulic performance requirements. Moreover, the effect of impeller rotation on the flow field of the core inlet has also been studied. The study indicates that the flow distribution is almost unaffected by the swirl flow.
1 Introduction
Nuclear energy is a clean energy source which plays an important role in achieving carbon neutrality goals. However, the promotion of traditional nuclear power plants faces many problems, such as large initial investment, long construction period, and high requirements on sitting conditions, all of which restrict the development of nuclear power. Modular small reactor (SMR) is a good solution to change this situation. SMR is a type of reactor with a single-stack electric power of less than 300 MW, which adopts new technologies like modular design, modular manufacturing, and rapid on-site assembly, thus making the reactor have a shorter construction period, better economy, and application flexibility. Furthermore, the nuclear steam supply system of SMR uses an integrated arrangement, which greatly simplifies the reactor coolant system, and can achieve higher security than the third generation of reactors.
ACP100 is a kind of SMR designed by the China National Nuclear Corporation independently. It eliminates primary loop piping by connecting steam generators and reactor coolant pumps directly to the reactor pressure vessel. The innovative design makes the internal flow field of ACP100 much different from traditional reactors. According to regulations, all the newly developed reactors are required to pass tests to verify the reliability of their safety designs. As an important factor affecting the operation of the reactor, the distribution of coolant flow at the core inlet is a significant content of verification in the design stage. Due to its importance, researchers in various countries have carried out relevant studies.
The United States was the first to carry out experiments on the hydraulic characteristics of nuclear reactors. In 1964, Hetsroni (Hestroni, 1964) carried out simulation experiments to verify the flow distribution of the reactor coolant in the Connecticut Yankee Nuclear Power Plant. Based on similarity theory, he proposed four principal parameters including geometry, relative roughness, Reynolds number, and Euler number as similarity numbers in model design. In addition, a hydraulic model with a ratio of 1:7.5 was designed and constructed representing hydraulics of the prototype reactor. Specifically, the model used 157 dummy fuel assemblies whose resistance was consistent with the prototype. The flow rate of each dummy fuel assembly was measured by an orifice flowmeter. Its experimental results show that the maximum flow distribution factor (ratio of the flow rate in one fuel assembly to the average internal flow rate of all the fuel assemblies) of the core inlet flow is 1.27 and the minimum is 0.80.
In 2006, Hensch Fabien (Hensch, 2006) from European Union set up the JULIETTE experimental facility to carry out hydraulic simulation experiments of the EPR reactor. JULIETTE was a scaled model of the four-loop reactor, consisting of four inlet pipes, a downcomer, a lower chamber with flow distribution device, an upper chamber, and the core. In the model, the flow rate was measured by a venturi arranged at the inlet of each dummy fuel assembly to investigate the flow distribution at the core inlet. Experiments showed a trend of higher flow in the middle area and lower flow in the peripheral area under rated conditions. The flow distribution factors were 0.838–1.087, and the maximum factor deviation of adjacent components was 18%. In the experiment, the effect of swirl flow at the reactor inlet and the number of operating loops were also in view. The results indicated that neither swirl flow nor the number of loop operations had obvious implications on flow distribution.
In 2012, an experimental study of System-integrated Modular Advanced Reactor (SMART) for core flow and distribution was conducted by Kim (Kim, 2012) from the Korea Atomic Energy Research Institute. A 1/5 scaled-down reactor model was constructed and the core region was replaced by 57 dummy fuel assemblies. A special venturi meter was mounted at the entrance of each dummy fuel assembly to measure the inlet flow rate. Experimental data was obtained under a 4-pump balanced condition. It was found that flow distribution factors varied from 0.952 to 1.240, and five of all dummy fuel assemblies exceeded 1.100.
In 2014, a reactor hydraulic simulation test of CAP1400 was conducted by Fang (Fang and Wang, 2014) with a 1/6 scaled-down reactor model. Fuel assemblies were replaced by 193 2 × 2 rod bundles simplified models with similar longitudinal and lateral resistance characteristics. A specially designed turbine flowmeter was mounted at the entrance of the dummy fuel assembly to measure the inlet flow rate. Experiments examined the hydraulic characteristics of the reactor coolant flow under four-pump balanced and unbalanced conditions and evaluated the influence of the flow equalizing plate. The experimental results showed that the flow equalizing plate could effectively improve the uniformity of the core inlet flow. In addition, due to the rectification of the flow equalizing plate, unbalanced flow conditions had little effect on the flow distribution characteristics.
Moreover, experimental investigations and numerical simulations have also been carried out in this field. In 2007, an open source CFD code Saturne was used to carry out the transient calculation of the flow field for EDF’s four-loop PWR by Yvan Fournier (Fournier et al., 2007). The calculation results showed that there was a large-scale flow pulsation phenomenon in the flow field of the lower chamber. When the core was heated, the coolant flow rate inside the fuel assembly was severely affected, but the flow rate at the inlet of the lower plate remained basically unchanged.
In 2013, a commercial CFD code Fluent 12.0 was adopted to compute turbulence flow in the SMART reactor by Bae (Bae et al., 2013). The influence of the turbulent model, Reynolds number, and inflow condition on flow distribution was discussed in detail. It was found the maximum flow rate difference of fuel assemblies was less than 2.3%.
In 2017, another three-dimensional numerical simulation concerned with the flow field of the Qinshan Phase II Nuclear Power Plant was conducted by Chen (Chen et al., 2017) with CFX code. In the rated operating condition, the maximum deviation of the flow distribution factor between the calculated value and the experimental value was 9.8%.
Although the numerical simulation has been conducted to verify the hydraulic characteristics of various nuclear reactor types, it still could not replace experiments. Limited by the lack of computer performance, the internal structures of the reactor, especially the core region, is always being simplified, which affects the accuracy of the calculation. The scaling model experiment remains the most important testing method.
In this article, a hydraulic experimental investigation is conducted to obtain flow distribution characteristics of the ACP100 reactor under different operating conditions. The influence of flow axial rotation (swirl) and unbalanced flow conditions on flow distribution at the core inlet are also analyzed. Experimental data will be used for reactor design.
2 Experimental Facility
2.1 Similarity Theory
To recur the physical phenomena of the prototype in a mock-up reactor, the scaled-down model should be designed based on similarity theory. All the conditions of geometric similarity, flow similarity, and motion similarity between the mock-up and the prototype must be satisfied. Also, the typical similarity parameters must be the same on both sides. According to the similarity theory of fluid mechanics, the main parameters that affect the flow distribution are the flow velocity u, the density of water ρ, the structural length L, the equivalent diameter DH, the roughness Δ, the viscosity coefficient of water μ and flow pressure drop ΔP. Keeping all the variables corresponding to scale is difficult. So the Buckingham theory is adopted here and 4 important dimensionless groups are obtained consequently, which are geometry number , relative roughness number , Reynolds number , and Euler number .
The geometrical similarity is the premise of kinematic similarity and dynamic similarity. The geometry number is mainly concerned with geometrical similarity, which means the mock-up reactor should be the same as the prototype with a constant scale factor anywhere. The determination of the scale factor needs to balance many requirements. On one hand, a large-scale factor model will be difficult to be manufactured and it requires more test facilities such as the main pump and pipes. On the other hand, a small-scale factor model is difficult for assemblage and it will also amplify the boundary layer effect and result in a different regime. Considering the dimension of the prototype, the capacity of the test rig, and cost of fabrication, a 1/3 scale factor is selected in the experiment. The geometry of the mock-up reactor will be introduced in the following sections.
Relative roughness number is important in the flow path where a large frictional pressure drop occurs. However, it can be found that pressure drops in the main flow paths of the mock-up reactor are caused by form resistance instead of frictional resistance except in the downcomer and core region. Downcomer is a large flow path, and in a large flow path relative, roughness can be ignored because it has a minor influence on the flow field. In addition, the same Euler number is adopted in the simulation of the core region, and under the premise of geometric similarity, the requirements of the flow field simulation can still be met when the surface roughness of the mock-up reactor is relaxed to the same as the prototype reactor. So the relative roughness number is strictly satisfied in the experiment.
Reynolds number is also an important parameter in hydraulic experiments. According to the similarity theory, Reynolds numbers in the model and the prototype reactor should be equal, but it is very difficult to achieve. However, it is found that if the Reynolds number is large enough, it will have little influence on the flow field and Euler number in complex construction. The flow state and velocity distribution will no longer change with the change of the Reynolds number and the resistance factor (Euler number) converges to a constant value. In hydraulics, this state is called entering the second self-modeling region. Then the similar conditions for the flow inside the model and the prototype reactor could be collated as geometrical similarity and flow entering the self-mode region. In a mock-up reactor, although the hydraulic diameter DH is small and the temperature is low compared with the prototype, the Reynolds number is still large enough to reach the self-mode state. So Reynolds number could not be satisfied strictly and the Euler number is automatically achieved if the flow field is independent of the Reynolds number.
To sum up, in the hydraulic experiment concerns with flow distribution, geometry number must be satisfied, Reynolds number can be neglected if it is large enough, and Euler number is satisfied automatically. The scaling ratios of the key parameters and dimensionless numbers in the mock-up reactor are shown in Table 1.
TABLE 1
| Parameter and Dimensionless Number | ACP100 | Scaling Ratio | Model |
|---|---|---|---|
| Temperature [°C] | 303 | – | 20 |
| Pressure [MPa] | 15 | – | 1 |
| Length ratio | 1 | L | 1/3 |
| equivalent diameter ratio | 1 | L | 1/3 |
| roughness ratio | 1 | L | 1 |
| Velocity ratio | 1 | u | 1 |
| Density ratio | 1 | ρ | 1.39 |
| Viscosity ratio | 1 | μ | 11.49 |
| Re ratio | 1 | ρu 2 L/μ | 1/24.80 |
| ΔP ratio | 1 | ρu 2 | 1.39 |
| Eu ratio | 1 | 1 | 1 |
Scaling ratio of the mock-up reactor.
The italic values are the dimension of the parameters.
2.2 Geometrical Model
The mock-up reactor of ACP100 simulates all the main structures of the prototype reactor, including reactor pressure vessel (internal form), flow distributor, lower core plate, core barrel, 57 fuel assemblies, upper core plate, upper internals, primary sides of 16 steam generators, and some support structures. For the structures in the front and rear end of the core have a significant effect on the flow field at the core inlet, the models there, such as flow distributor, lower core plate, and upper core plate, are strictly scaled down to 1/3 size. Upstream of the core are two flow distribution structures, the flow distributor, and the lower core baffle. The flow distributor, as the primary distribution structure, is in the shape of an ellipsoid head with a large number of holes symmetrically opened on it, and the lower core baffle also has a number of holes corresponding to each fuel assembly for secondary flow distribution. The flow distributor is directly and concentrically attached to the lower core baffle with screws. It is too difficult to simulate all the internal components, so rational simplification is necessary. For example, the prototype reactor core is a complex region consisting of 57 open lattice fuel assemblies composed of 17 × 17 fuel rods. In the mock-up reactor, the core is simplified with 57 dummy Fuel assemblies. Some guide tubes and control rods located downstream from the core are totally ignored, which have little influence on flow distribution. The elliptical head of the reactor pressure vessel is also replaced by a flat head for the space can be considered as a stagnant water area, and it should be specially explained that all the bypass flow measured by a separate bypass flow test is not taken into consideration in the experiment.
The flow characteristics in reactor nozzles also need to be concerned. In the integrated reactor, the pump is mounted directly on the vessel. However, finding a suitable small pump installed at the same site in a mock-up reactor and providing a similar flow rate is difficult. Therefore, a casing pipe is used as the inlet and outlet of the mock-up reactor, with the inlet in the center and the outlet around, to achieve the same flow rate and flow direction as the prototype. Above the casing pipe, a removable swirl generator is located to simulate the rotation caused by the pump. For the pump is too close to the reactor nozzle, the rotation of the impeller leads to significant swirling flow and it may have influence on the reactor core flow field. So it is necessary to study the effect of swirling flow. In the experiment, the swirl generator achieves the required swirl intensity by setting the inclination angle of the diversion plates.
The mock-up reactor and all internal components are all made of stainless steel. Figure 1 and Figure 2 show the schematic diagram of the mock-up reactor, and Figure 3 shows the schematic diagram of the swirl generator.
FIGURE 1
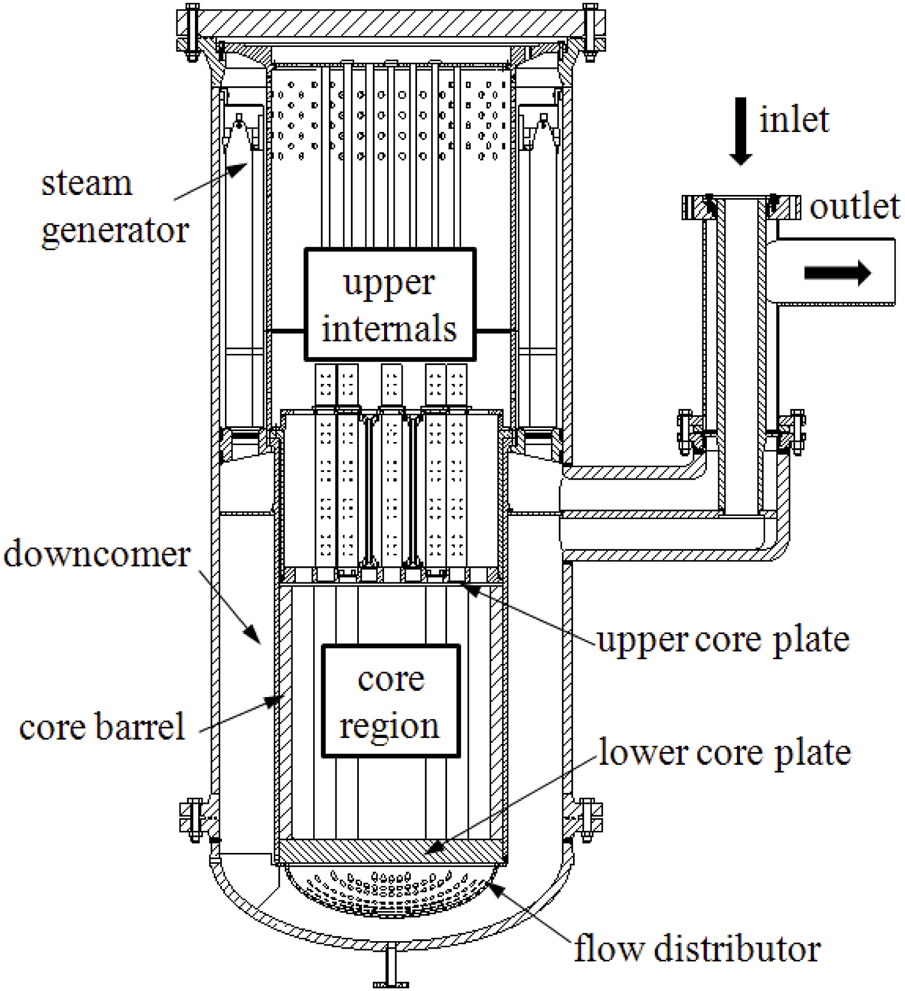
schematic diagram of mock-up reactor (cross-section view).
FIGURE 2
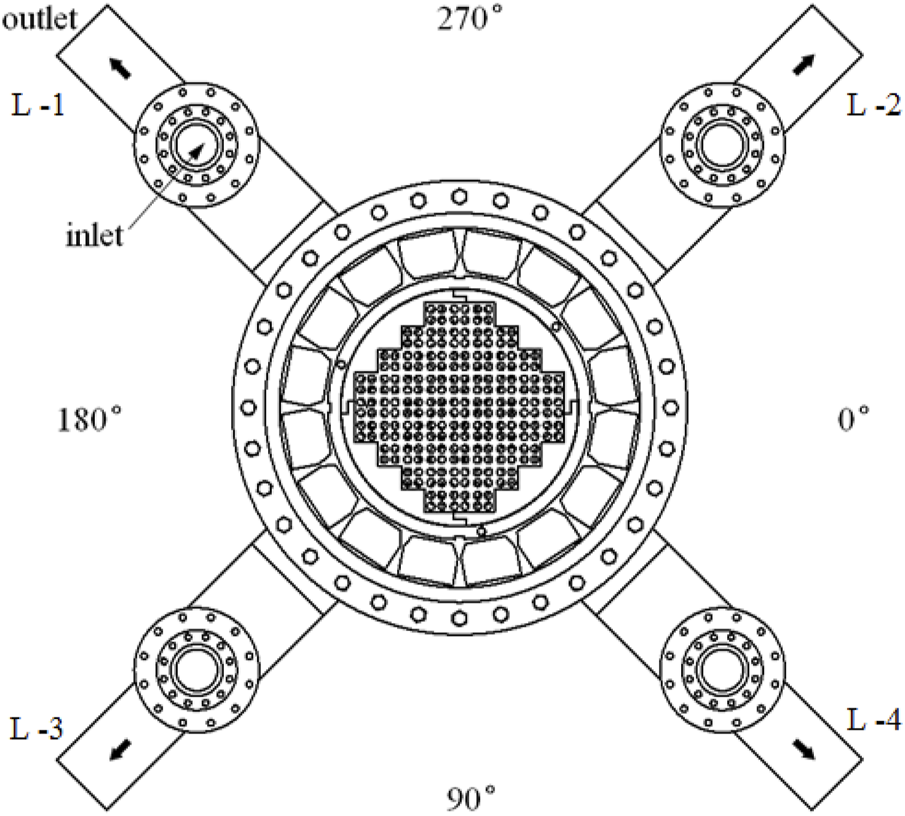
schematic diagram of mock-up reactor (top view).
FIGURE 3
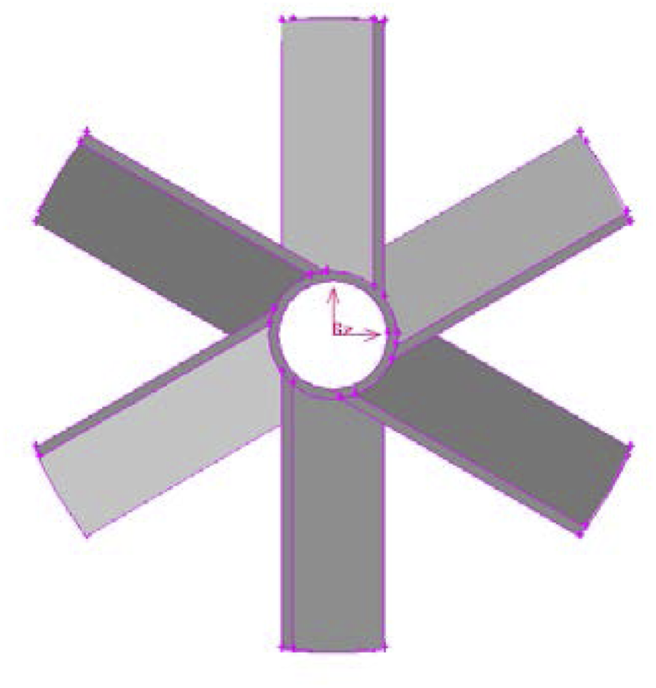
schematic diagram of swirl generator.
In the experiment, water enters the mock-up reactor from four symmetrical inlets and flows downward in the downcomer. The flow distributor with numerous small holes in the lower plenum will break a large vortex and make flow uniform. Then the water flows through the lower core plate and enters 57 dummy Fuel assemblies. The flow distribution concerned in the experiment occurs here. Then the water flows through the upper core plate, upper internals, and 16 steam generators. Finally, water leaves the mock-up reactor from four outlets. The main flow path in the model is the same as the prototype.
2.3 Design of Dummy Fuel Assembly
Design of dummy fuel assembly is very important in experiments, which has a great influence on flow distribution. The ACP100 fuel assembly is mainly composed of top nozzles, bottom nozzles, 17 × 17 fuel rods, and different kinds of grids. For the scaled-down experimental model, from the perspective of processing and economy, the simulation of the fuel assembly can no longer be scaled down to achieve complete geometric similarity with the prototype. So fuel assembly must be simplified based on certain similarity theories with a small number of rods and a large rod diameter. A 2 × 2 open lattice dummy fuel assembly is adopted in the experiment, which has the same longitudinal resistance coefficient as a prototype. It should be mentioned that both resistance magnitude and distribution should be simulated, especially the inlet resistance characteristic of the fuel assembly, which is crucial for flow distribution. The lateral resistance characteristic of rods is also taken into consideration by the empirical formula recommended by Khan (Khan, 1972). With the same longitudinal and lateral resistance, external diameter and pitch diameter of dummy fuel rods can be determined. The diagrams of fuel assembly and dummy fuel assembly are shown in Figure 4 and Figure 5.
FIGURE 4
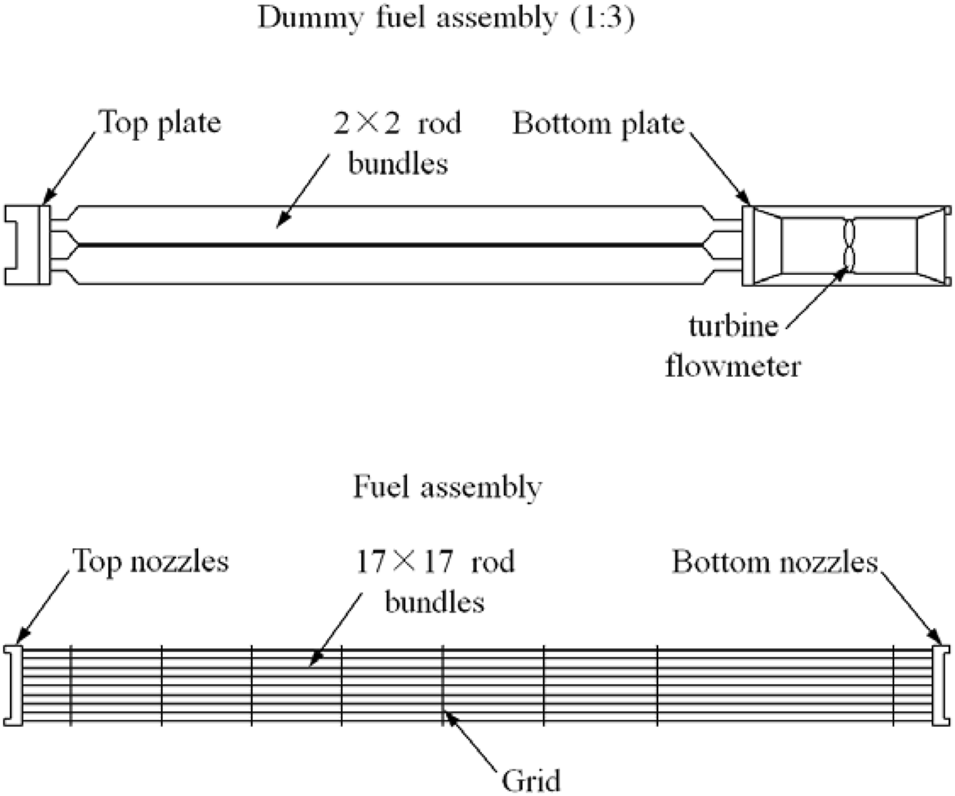
Comparison diagram of dummy fuel assembly and prototype.
FIGURE 5
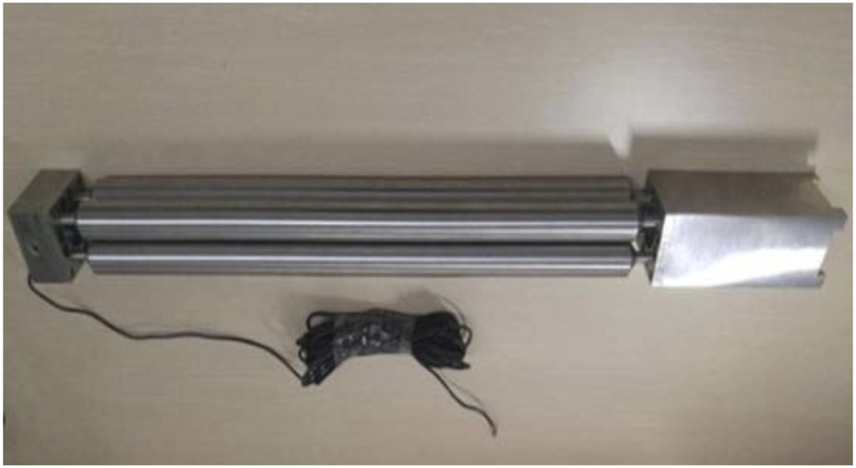
Photograph of dummy fuel assembly.
The dummy fuel assembly is not only a resistance model, but also a flow measuring device. A specially designed turbine flowmeter is mounted at the entrance of each dummy fuel assembly to measure inlet flow rate. The measuring range of each flowmeter is from 5 m3/h to 30 m3/h with an accuracy of ±1%.
It should be stressed that due to manufacture and rigging errors, not only longitudinal resistance but also discharge coefficient of each dummy fuel assembly and turbine flowmeter is different from each other, so a hydraulic calibration must be carried out before the experiment. The orifice diameter of top nozzles can be sized so that the longitudinal resistance of dummy fuel assembly and prototype could be matched well. It should be mentioned here that the longitudinal resistance of fuel assembly will decrease with the increase of the Reynolds number. It will be difficult to make dummy fuel assembly that has the same resistance characteristic as the prototype due to geometrical difference. So a constant longitudinal resistance value is selected during the calibration process, which means the longitudinal resistance of fuel assembly under normal operation is chosen as reference and a deviation of ±2% is acceptable. Moreover, the discharge coefficient of each turbine flowmeter will be recorded to calculate the flow rate in the integral experiment and the accuracy of all flowmeters must meet the requirements.
2.4 Test Facility
The flow distribution experiment of ACP100 is carried out at the Nuclear Power Institute of China. A test facility with 4 loops is designed and constructed especially for this experiment. The test loop is mainly composed of 2 main pumps, 2 pressurizers, 2 heat exchangers 8 control valves, and a mock-up reactor. Each pump extends two branches connecting two entrances of the mock-up reactor. Flow rate per loop is controlled by adjusting the rotation frequency of the main pump and valve opening. When the experiment begins, de-ionized water will be transported from the water tank to the test loop. Then main pump will operate with a small flow rate until the air is totally discharged. Rotation frequency of the main pump will increase slowly until the operating condition is achieved. The pressurizer will decrease oscillation of flow rate during this process. If water temperature is high enough, the heat exchanger will work and inlet temperature of the mock-up reactor will be maintained at a constant value.
A schematic diagram of the test facility is shown in Figure 6, and the design parameters are shown in Table 2.
FIGURE 6
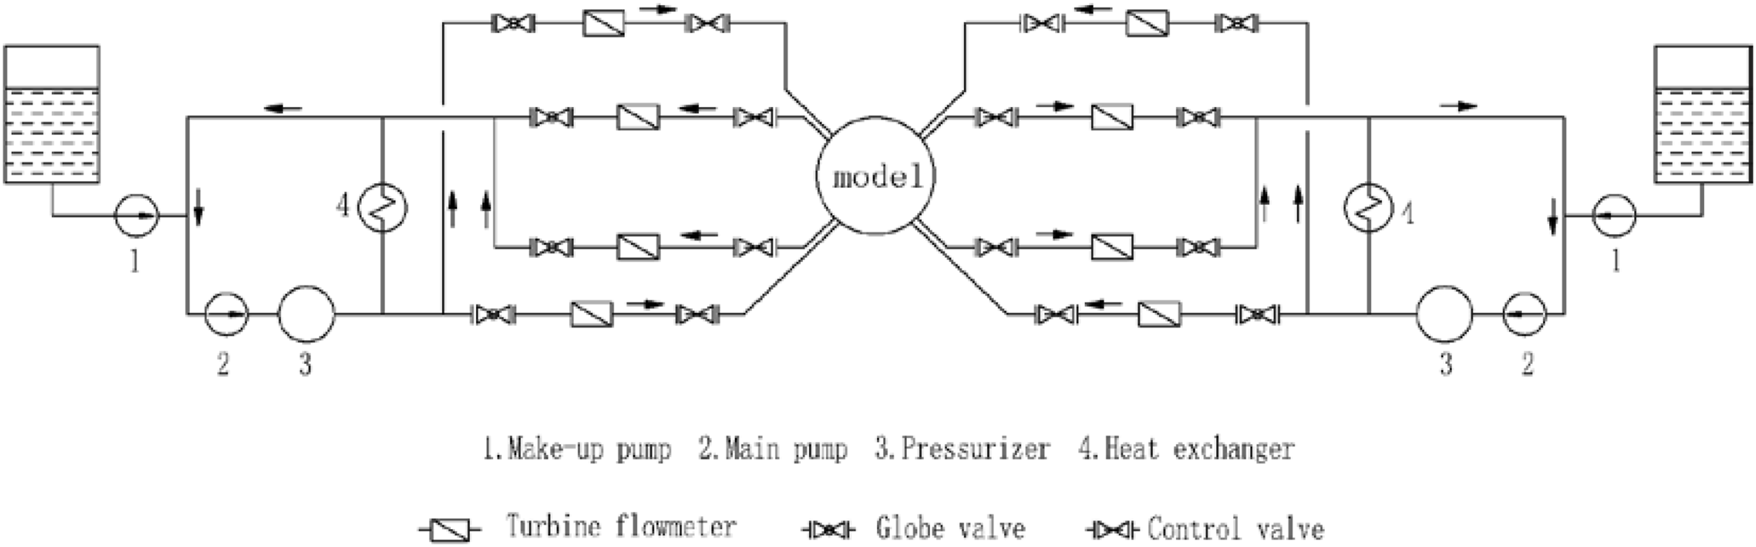
schematic diagram of test loop.
TABLE 2
| Design Parameter | Value |
|---|---|
| Design pressure | 1.6 MPa |
| Operation pressure | 1.2 MPa |
| Design temperature | 100°C |
| Operation temperature | 80°C |
| Normal mass flow rate of single pump | 800 m3/h |
| Pump head | 119 m |
Design parameters of test facility.
2.5 Measurement and Uncertainty
The parameters measured in the experiment include flow rate, fluid temperature, and system pressure. The flow rate and fluid temperature in each loop are measured by turbine flowmeters and thermocouples located at the entrance of the mock-up reactor. System pressure is monitored by a pressure transmitter and located at the entrance of the mock-up reactor too. Flow rate in each dummy fuel assembly is measured by specially designed turbine flowmeters with a total number of 57. All the instruments in the experiment are calibrated in advance. The uncertainty and measuring range are shown in Table 3.
TABLE 3
| Measurement | Measuring Range | Uncertainty (%) |
|---|---|---|
| Turbine flowmeter (loop) | 90–500 m3/h | 0.5 |
| Turbine flowmeter (dummy fuel assembly) | 5–30 m3/h | 1 |
| Thermocouple | 0–100°C | 0.5 |
| Pressure transmitter | 0–1.6Mpa | 0.5 |
Measuring range and uncertainty.
3 Experimental Results and Discussion
3.1 Experiment Data Processing
Flow rate in each dummy fuel assembly could be obtained in an experiment by a specially designed turbine flowmeter. However, it is cumbersome to evaluate the uniformity of the flow field and to distinguish the lowest flow dummy fuel assembly by comparing the measurements directly. Therefore, we introduce a dimensionless flow distribution factor to assist data processing and evaluation. The flow distribution factor is the ratio of the flow rate in each dummy fuel assembly (Qi) to the average internal flow rate of all the 57 dummy fuel assemblies (Qave). It can be obtained by the following equations:
3.2 Experiment Results
3.2.1 Balanced Condition Tests
The flow distribution in a mock-up reactor is measured under four-loop balanced operation conditions. Table 4 shows the flow rate requirements for the balanced flow conditions. Figure 7 and Figure 8 show the results under the standard condition, low flow condition, and high flow condition.
TABLE 4
| Ratio to Reactor Inlet Velocity | L-1 (%) | L-2 (%) | L-3 (%) | L-4 (%) | Rea |
|---|---|---|---|---|---|
| Standard | 100 | 100 | 100 | 100 | 1.34×10⁶ |
| Low flow | 60 | 60 | 60 | 60 | 7.54×10⁵ |
| High Flow | 120 | 120 | 120 | 120 | 1.64×10⁶ |
Test requirements and balanced conditions for the inlet flow.
The inlet of mock-up reactor is selected as reference cross section to calculate reference velocity.
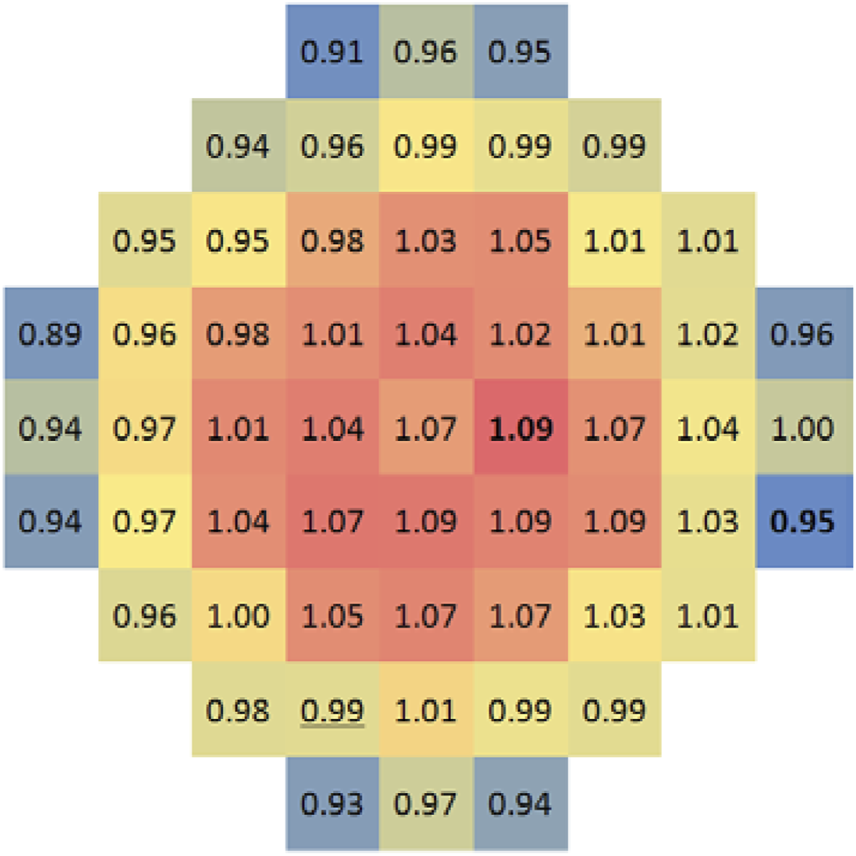
FIGURE 7
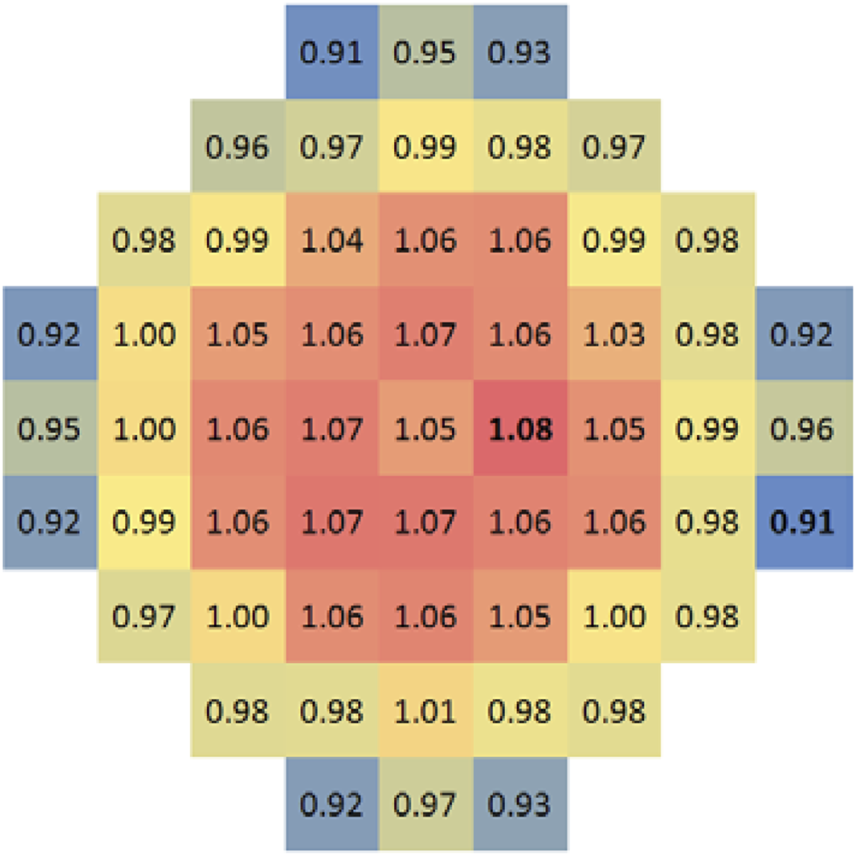
Flow distribution map under standard condition.
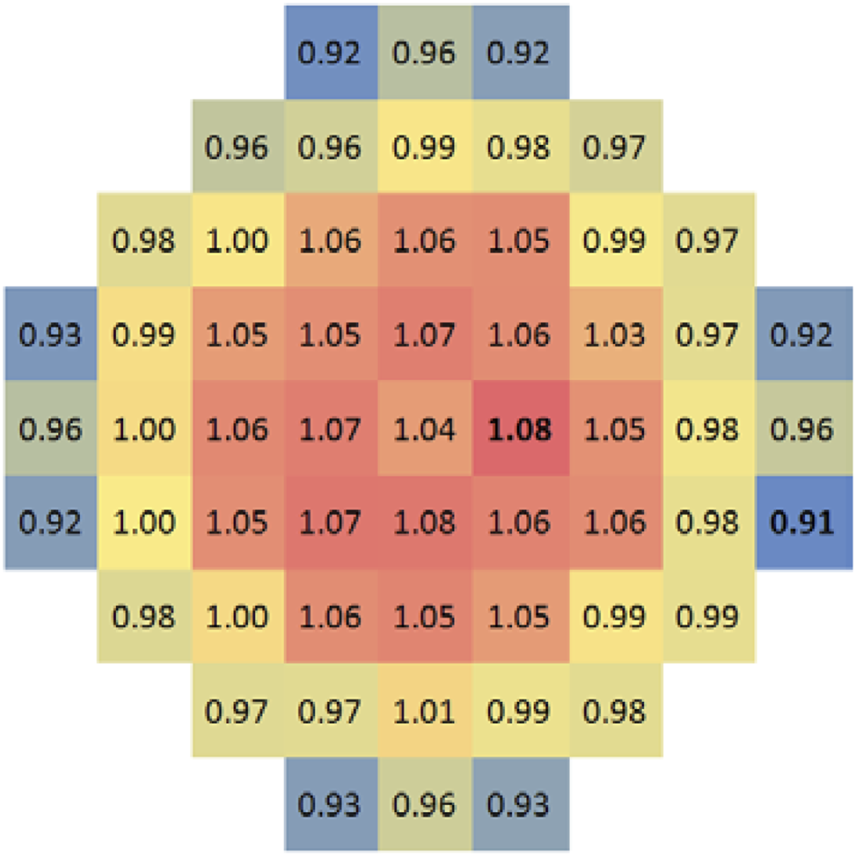
FIGURE 8
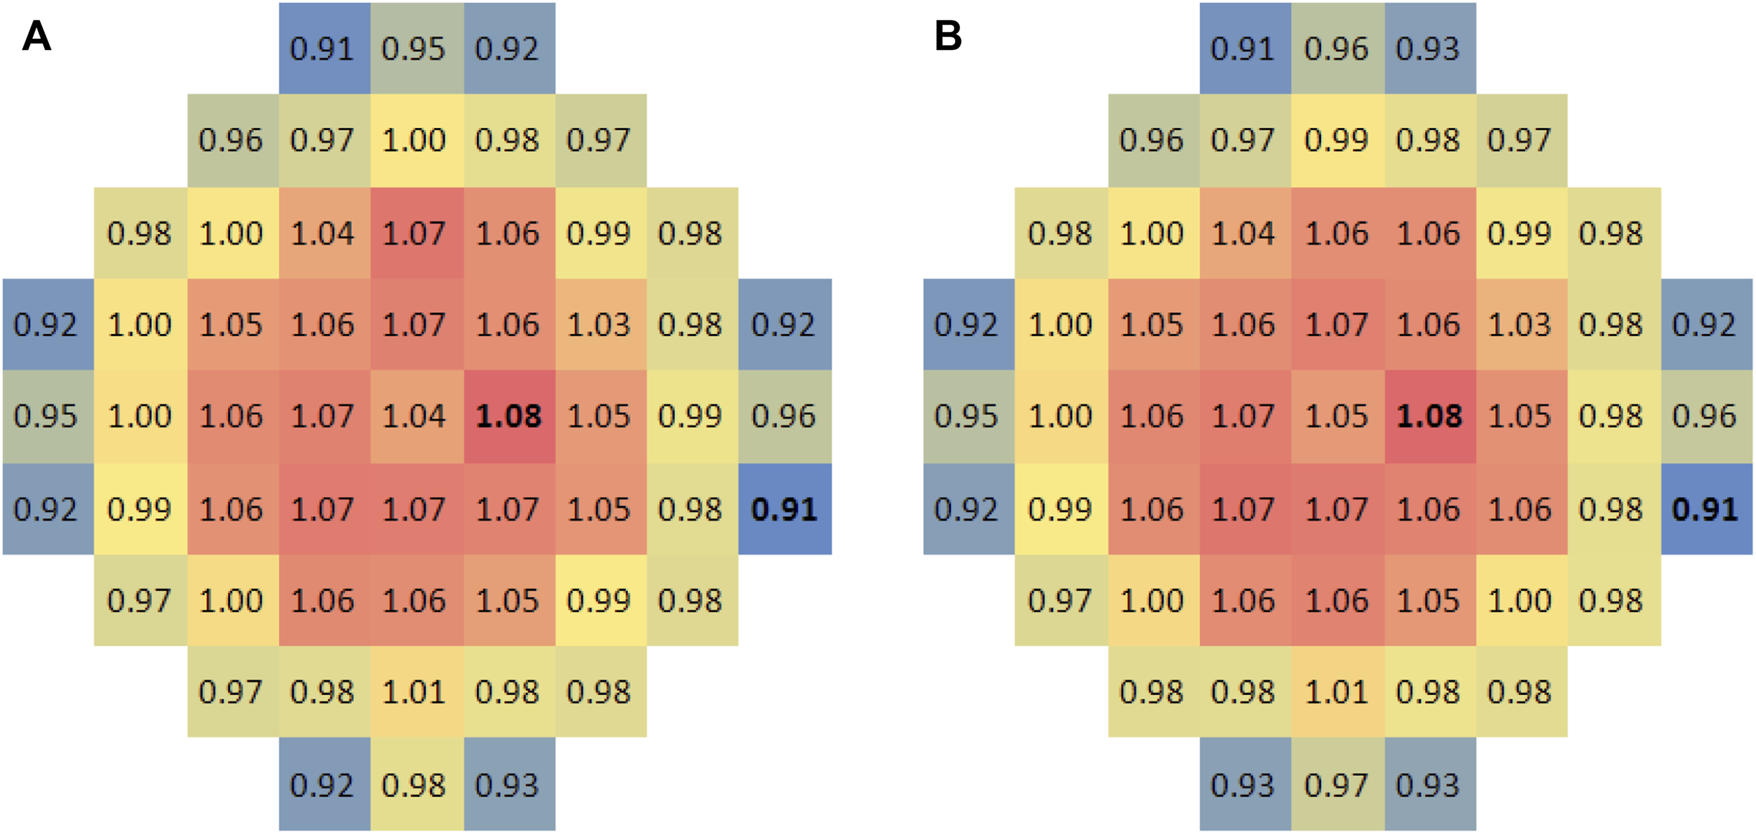
Flow distribution factor map under non-rated condition: (A) 60% velocity; (B) 120% velocity.
The flow distribution factor map obtained under standard operating conditions shows that the largest internal flow of fuel assembly appears in the middle area of the core, and the distribution trend appears to be reducing from the center of the core to the periphery layer by layer. The flow rates in fuel assemblies close to the core baffle are low, and the lowest flow rate appears in the eight corners of the core baffle. However, the flow distribution at the core inlet is still homogeneous, and all the distribution factors are in the range of 0.91–1.08. Deviation within 10%, the flow distribution is homogeneous enough to meet design requirements. In addition, the flow distribution result shows obvious symmetry. Flow distribution characteristics are mainly affected by the hydro-dynamically driven convection and the structure of flow channels. The structural design of the ACP100 reactor, especially the lower chamber, has a distinct symmetry, and its four inlet nozzles are also symmetrically located at 90°. In the premise of sufficient symmetry of the structure, the uniform flow rates of the reactor inlets would create symmetrical flow characteristics at the core inlet.
In order to do further research on the effect of flow velocity on flow distribution, balanced condition experimental tests are carried out again under the 60% and 120% rated flow velocity of the prototype reactor. According to self-modular theory, in a complex structure such as a reactor, where the Reynolds number is large enough, the flow regime and flow velocity distribution will no longer change. The experimental results also show well agreement with each other. It means the Reynolds number is large enough that the flow velocity has little influence on the flow distribution in the experiment. Therefore, it is safe to say that the experiments yield reliable results with good repeatability.
3.2.2 Unbalance Condition Tests
Unbalance conditions may occur in accidents when the main pump stops or the steam line breaks. In the experiment, two unbalance conditions as listed in Table 5, shutting down one loop (one-shut) and increasing the flow rate by 5% of a loop (5% offset), are selected for the simulation analysis of the two accidents. The results are shown in Figure 9 and Figure 10.
TABLE 5
| Ratio to Reactor Inlet Velocity | L-1 (%) | L-2 (%) | L-3 (%) | L-4 (%) |
|---|---|---|---|---|
| One-shut | 0 | 120 | 120 | 120 |
| 5% offset | 104 | 99 | 99 | 99 |
Test requirements and conditions for unbalance inlet flow.
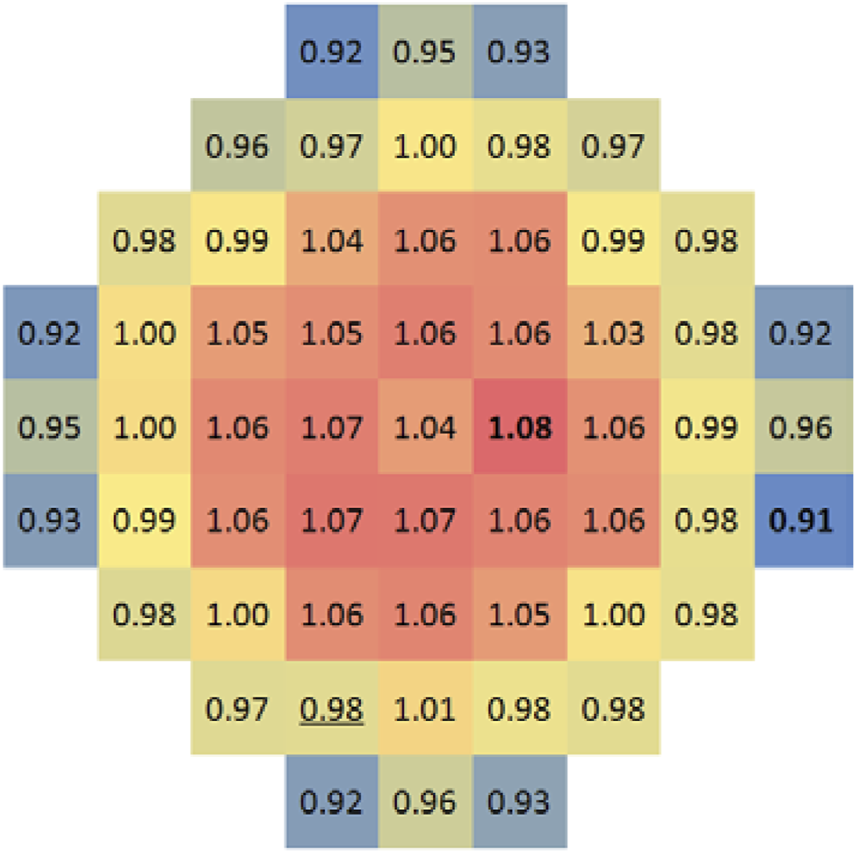
FIGURE 9
Flow distribution map under one-shut condition.
FIGURE 10
Flow distribution map with a loop flow rate 5% higher.
Figure 9 shows that a low flow rate area appears on the closed loop side under one-shut conditions. In the test, water flow of L-1 is lost, and the flow there is whole supplemented by the other three loops, mainly relying on the lateral flow in the downcomer and the diversion effect of the flow distributor in the lower chamber. So it is undoubtedly to create a low flow area. Nevertheless, the minimum flow distribution factor still can reach 0.89, and the flow distribution factor in the low flow area is not much different from other parts, which verifies the good diversion effect of the flow distributor.
Figure 10 indicates that a 5% offset does not have a significant impact on flow distribution. It means that sufficient coolant inventory and stormy convection are enough to accommodate small flow deviations.
3.2.3 Twisted Condition Tests
The main pump of ACP100 is closer to the reactor core than in commercial reactors, and it makes the swirl of the coolant stronger. For the swirl that may have an impact on flow distribution, we adopt four removable swirl generators located at each inlet of the mock-up reactor to simulate the flow regime and measure the flow rate distribution under twisted conditions. Comparing the flow distribution data under swirl conditions showed in Figure 11 with the aforementioned four-loop balanced experimental data, the result shows that the flow distribution characteristics do not change significantly. The variation corresponding to each fuel assembly is negligible, and the minimum and maximum flow distribution factors are both the same. This means the swirl is mitigated when passing through the downcomer and flow distributor due to the large hydraulic resistance and flow mixing at the lower plenum.
FIGURE 11
Flow distribution map under twisted condition.
4 Conclusion
The objective of this study is to evaluate whether the structural design of ACP100 meets hydraulic performance requirements. We investigate flow distribution characteristics in a scaled-down mock-up reactor which has the same flow field characteristics as the prototype. Under four-loop balanced operating conditions, three different velocity tests are independently performed. The core inlet flow rates show uniform distributions with even the same maximum and minimum distribution factor. It means the flow in the major flow path of the mock-up reactor has entered the self-modeling zone and the flow distribution is the same as the prototype, and with a result of all the distribution factors in the range of 0.91–1.08, the experiment indicates the flow distribution at the core inlet is homogeneous. Unbalanced condition test results show that the reactor structures are good enough to accommodate flow deviations. In further research, the swirl produced by the pump is also proved of having little impact on flow distribution. Through different operating condition tests, we conclude that the core flow rate distribution of ACP100 has well uniformity.
Statements
Data availability statement
The original contributions presented in the study are included in the article/supplementary material, and further inquiries can be directed to the corresponding author.
Author contributions
LD, WZ, XY, and JX contributed to conception and design of the study. LD conducted the data analysis and wrote the main body of the article. LJ, and DJ wrote sections of the manuscript. All authors contributed to manuscript revision, read, and approved the submitted version.
Funding
This work was financially supported by the Sichuan Province Youth Science and Technology Innovation Team Foundation (approved number: 2019JDTD0018).
Conflict of interest
The authors declare that the research was conducted in the absence of any commercial or financial relationships that could be construed as a potential conflict of interest.
Publisher’s note
All claims expressed in this article are solely those of the authors and do not necessarily represent those of their affiliated organizations, or those of the publisher, the editors, and the reviewers. Any product that may be evaluated in this article, or claim that may be made by its manufacturer, is not guaranteed or endorsed by the publisher.
References
1
Bae Y. Kim Y. I. Park C. T. (2013). CFD Analysis of Flow Distribution at the Core Inlet of SMART. Nucl. Eng. Des.258, 19–25. 10.1016/j.nucengdes.2013.02.003
2
Chen R. Tian M. Chen S. Tian W. Su G. H. Qiu S. (2017). Three Dimensional Thermal Hydraulic Characteristic Analysis of Reactor Core Based on Porous Media Method. Ann. Nucl. Energy104, 178–190. 10.1016/j.anucene.2017.02.020
3
Fang Y. Wang S. (2014). CAP1400 Reactor Flow Distribution Test Report [R]. Chengdu, China: Nuclear Power Institute of China.
4
Fournier Y. Vurpillot C. Béchaud C. (2007). Evaluation of Fluid Flow in the Lower Core of a PWR with Code_Saturne. Nucl. Eng. Des.237, 1729–1744. 10.1016/j.nucengdes.2007.02.025
5
Hensch F. (2006). JULIETTE Tests Interpretation Flow Rate Distribution and Characterization of the Head Losses and Pressure Fields. Areva: Design Report NFPSDDC.
6
Hestroni G. (1964). Hydraulic Tests of the San-Onofre Reactor Model[R]. Pittsburgh, United States: Westinghouse Electric Corporation.
7
Khan E. U. (1972). Analytical Investigation and Design of a Model Hydro-Dynamically Simulating a Prototype PWR Core. Nucl. Technol.16 (3), 479–496. 10.13182/nt72-a31217
8
Kim K. M. (2012). “Hydraulic Characteristics of SMART Reactor for a Nominal Condition,” in 9th International Conference on Heat Transfer, Fluid Mechanics and Thermodynamics, Malta, 16-18 July 2012 (Malta: HEFAT).
Summary
Keywords
core inlet flow distribution, ACP100, experimental research, four-loop balanced, unbalanced operating condition, swirl flow
Citation
Ding L, Jiang L, Jiang D, Zhuo W, Yan X and Xu J (2022) Experimental Research of Flow Distribution at Reactor Core Inlet of ACP100. Front. Energy Res. 10:914541. doi: 10.3389/fenrg.2022.914541
Received
07 April 2022
Accepted
03 May 2022
Published
09 June 2022
Volume
10 - 2022
Edited by
Luteng Zhang, Chongqing University, China
Reviewed by
Zhaoming Meng, Harbin Engineering University, China
Yan Xiang, Royal Institute of Technology, Sweden
Updates
Copyright
© 2022 Ding, Jiang, Jiang, Zhuo, Yan and Xu.
This is an open-access article distributed under the terms of the Creative Commons Attribution License (CC BY). The use, distribution or reproduction in other forums is permitted, provided the original author(s) and the copyright owner(s) are credited and that the original publication in this journal is cited, in accordance with accepted academic practice. No use, distribution or reproduction is permitted which does not comply with these terms.
*Correspondence: Lei Ding, ding2012014@126.com
This article was submitted to Nuclear Energy, a section of the journal Frontiers in Energy Research
Disclaimer
All claims expressed in this article are solely those of the authors and do not necessarily represent those of their affiliated organizations, or those of the publisher, the editors and the reviewers. Any product that may be evaluated in this article or claim that may be made by its manufacturer is not guaranteed or endorsed by the publisher.