 Ramesh B. Darla
 Chitra Annamalai
- School of Electrical Engineering, Vellore Institute of Technology, Vellore, India
Utility applications demand highly reliable power converters to match market quality needs. The classical reliability prediction methods do not account for the sudden transients involved with the power converter. This work envisages a new reliability prediction procedure for LLC converter which accounts for the input transients’ impact on the failure rate. Experiments are conducted to collect the actual stress values at input transient and fault conditions, which aids to predict the failure rate with more accuracy. The reliability prediction has been performed using the collected experimental data from the component level to the system level at different mission profiles with transient operating conditions. The impact of various faults and transients on the converter failure rate prediction has been clearly projected from the quantitative analysis presented in this paper. To have a clear picture, the effect of reliability with respect to other stress factors like temperature stress, environmental stress, electrical voltage, current, and power stress on failure rates are also compiled and tabulated. Failure rate and Mean Time Between Failures (MTBF) have been calculated for an LLC converter using the experimental data. The proposed reliability model can be used in the design phase to have an optimal design, planning, and operation of a power electronic converter in the field. This enables to reach out power converters with better reliability profile to cater the industrial needs for real time applications. From the results, it is evident that the reliability prediction is more realistic when the input transients are considered using the experimental data.
1 Introduction
The usage of power electronics is increasing for various applications, both industrial and domestic. Power electronic converters are widely used for electric vehicles, renewable energy, variable speed drives (Falck et al., 2018), and telecom/data canters (Darla and Chitra, 2021a). The expectations of converter products are increasing interims of product quality, efficiency, and reliability. The reliable operation of converters (Peyghami et al., 2019; Peyghami et al., 2020) is critical for modern design and the development of power electronic converter products (Liserre et al., 2014; Falck et al., 2018). The reliability of power supplies used to power up the information communication and technology (ICT) equipment used in telecom and networking is more important as ICT equipment is more critical in servers, routers, and switches.
The reliability of a product/component defines the probability of working on the product/component without failing for specified conditions for a specified period (SR-332, 2016; Falck et al., 2017). The specified conditions are like environmental factors such as temperature, humidity, and other mechanical factors. (Liserre et al., 2014; Falck et al., 2017). Figure 1 shows the common expected environmental, transient, and installation conditions where the product gets exposed after installation. These factors will make the components more stressed and increase the probability of failure. Research on the reliability of power electronics has begun over the last several decades. Various methods of reliability study metrics are defined and presented in (Hoyland and Rausand, 1994; Denson, 1998; Wikstrom et al., 2000; Hayes and Hayes, 2001; Wang et al., 2013). Reliability prediction methods are three types in general: empirical (standard-based), physics of failure (PoF), and life testing. Each method of prediction will have its advantages and disadvantages described in (Liserre et al., 2014; Denson, 1998; MIL-217, 1992; FIDES, 2010; Ma et al., 2016).
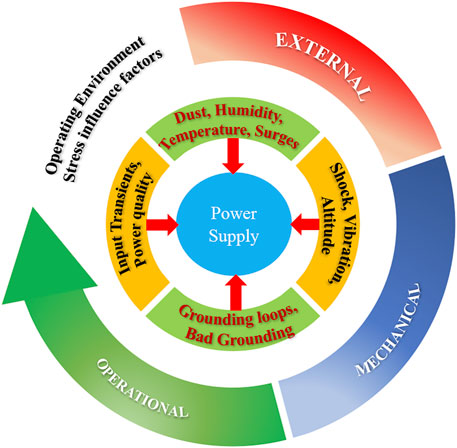
FIGURE 1. Expected transients, environment and installation conditions for a product to operate in the field.
The physics of Failure (PoF) technique (Foucher et al., 2002; Liserre et al., 2014; Ma et al., 2016) focuses on the component failure modes and applies data on the failure model physics. The component used within the product can have different failure mechanisms (Foucher et al., 2002; Peyghami et al., 2020). The rate of failure of the component is the total amount of the failure rates. The failure mode is due to humidity, temperature, voltage, other component-related characteristics, etc. The product’s failure rate is the sum of all component failure rates presented in the product (Foucher et al., 2002). Each model parameter must be calculated based on the design or operating specification. POF method is accurate, but it requires component material, process, and design data while predicting the failure rate (Liserre et al., 2014). Furthermore, this method is complicated (Liserre et al., 2014) and costly. This reliability method, limited to the component level as a system-level prediction, is difficult (Liserre et al., 2014; MIL-217, 1992).
The empirical method of reliability prediction (SR-332, 2016; MIL-HDBK-217F, 1995; Alam and Alam, 2016) is used for many years because it is easy to use with many component models available. It provides good approximations because the prediction of failure is based on historical failure data (Obeidat and Shuttleworth, 2015; Peyghami et al., 2020). Component level and product level prediction are possible as the product failure rate would be the total amount of all component failure rates. The stress factors that cause the components’ failures are also considered in this method to predict the failure mode. The stress factors are temperature, voltage, current, power, and environment (SR-332, 2016). These stress factors can be determined by using the formulae based on the actual stress on the device. Empirical methods are useful to predict failures at all stages of the product’s life cycle (SR-332, 2016).
Table 1 (MIL-217, 1992; National Research Council, 2015) shows the comparison of various reliability prediction methods. Military handbook MIL-HDB-217 (MIL-HDBK-217F, 1995) is a commonly used method to predict reliability based on empirical data (Peyghami et al., 2020). This empirical method relies on models generated by the statistical curve fitting of past failure data. The failure data comes from the field, manufacturers, and in-house testing (Peyghami et al., 2020; MIL-217, 1992). MIL-HDB-217F is the latest standard which is released in 1991 with two revisions in 1992 and 1995. MIL-HDB-217F describes two reliability prediction methods, namely part count (Black Box) and Part stress method (Foucher et al., 2002; MIL-HDBK-217F, 1995). The part count method uses component operating conditions such as electrical stresses, thermal stresses, and environmental stresses. Part stress method is more realistic by considering application stresses along with component stresses.
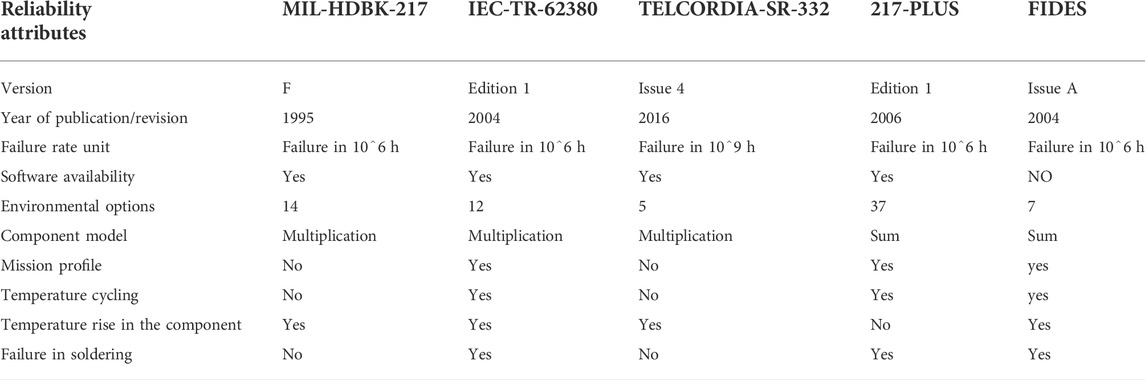
TABLE 1. Qualitative and quantitative comparison of reliability methods.
Telcordia SR–332 (Darla and Chitra, 2021a; SR-332, 2016) standards have been released by Bell core/Telcordia due to some dissatisfaction (Peyghami et al., 2020) with MIL-HDBK for AT and T telecommunication commercial products. SR–332 standards for reliability predictions are widely used for ICT equipment in telecom and networking applications. SR-332 is a successor of MIL-HDBK, it has some deficiencies to estimate the reliability prediction. The primary disadvantage is that the predicted failure rate is unrealistic when all the factors are either low or high. As described in Table 1, the Telcordia standard predicts the failure rate as per actual stress. However, it is not possible to predict the failure rate for mission profiles.
A new failure prediction method is developed in 1998, to predict the failure with actual test data by considering mission profiles. The 217P (David Nicholls and (RIAC), 2007) standard has more mission profiles to apply to predict the failure rate. This paper describes the reliability prediction of an LLC converter at normal and abnormal conditions by using the 217Plus methodology to predict the failure rate at two different mission profile conditions. The advantages of the 217Plus methodology (David Nicholls and (RIAC), 2007) are listed below when compared with traditional methods.
• The failure rate prediction approach of 217Plus is the combination of multiplicative and additive models.
• The 217Plus failure rate calculations are based on cycling and nonoperating failure rates and operating failure rates.
• Reliability prediction of 217Plus is the failures per calendar million hours
• 217Plus uses the appropriate stress or component characteristic to accelerate each failure rate.
• 217Plus considers different base failure rates for each generic class of failure mechanism. These process factors are determined by a qualitative assessment of process criteria with weighting factors applied.
Figure 2 (Darla and Chitra, 2021b) shows the comparison of the different reliability prediction methods along with their advantages and disadvantages. The best approach is chosen based on the application and availability of data. In this paper, 217Plus data is used to predict the failure rate at different transient conditions.
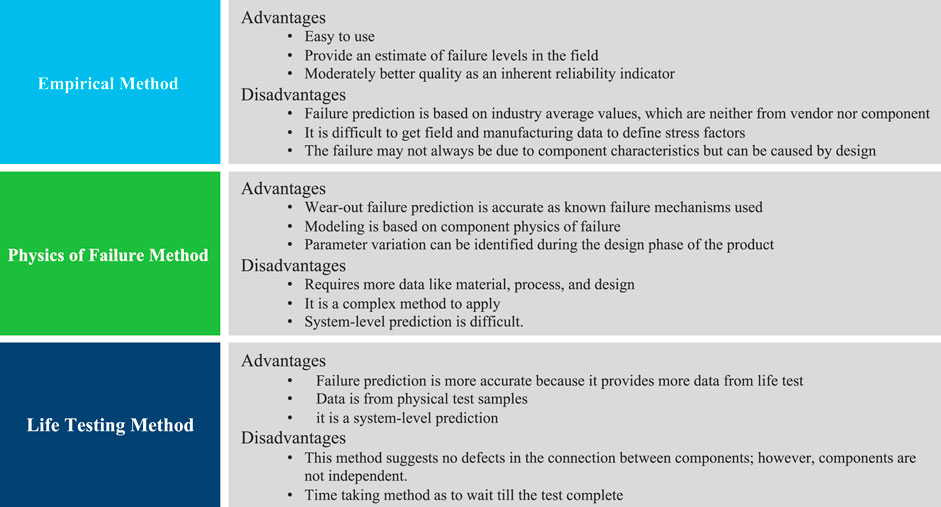
FIGURE 2. Advantages and disadvantages of failure prediction methods.
Section 2 describes failure and LLC converter failure modes. Section 3 describes failure rate prediction with Telcordia SR-332 and RIAC 217Plus conventional failure life prediction. Section 4 provides the component-level failure rate prediction and section 5 provides experimental verification of the proposed method of LLC converter level failure prediction. Section 6 gives the conclusion.
2 Failure analysis of LLC converter
LLC converter is a DC-to-DC converter used for stepping up or down the input voltages. LLC converter is used as a stepping-down converter for ICT equipment. An intermediate bus converter (IBC) is placed to convert 48 VDC to 12 VDC, LLC converter widely used as IBC. LLC has various advantages to use as specified in (nakakohara et al., 2015). It is essential to understand the problems associated with the converter to achieve more reliability. The reliability of the converter depends on various factors as specified in Figure 1. The reliability of the converter is a function of time during its useful existence in the field. The following sections will explain the failures and reliability of the LLC converter.
2.1 Failure rate
The rate of failure of the product/system can be specified as its liability for failure after some time t. Figure 3 shows the standard time-function failure rate curve known as the bathtub curve (European Power Supply Manufacturers Association, 2004). The bathtub curve’s shape shows that every product’s life cycle has three periods: early life period, useful life period, and wear-out period (European Power Supply Manufacturers Association, 2004; Peyghami et al., 2019). The same can be expressed as early life failures or infant mortality failures, steady-state failures, and wear-out failures. The failures which are generally due to the aging of the product or component derating are called wear-out failures (Peyghami et al., 2021).
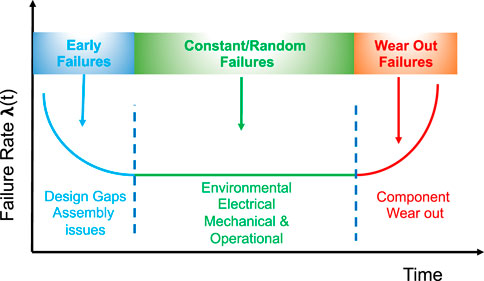
FIGURE 3. Bathtub failure curve.
Early failures or infant mortality failures are due to design and process gaps (European Power Supply Manufacturers Association, 2004; Ma et al., 2016). As the product starts to survive throughout the initial period, the failure rate stabilizes at a steady failure rate. The constant failure or steady-state failure rate is a random failure that happens during the useful life before it reaches wear-out failures (European Power Supply Manufacturers Association, 2004). Therefore, it is essential to carry out a reliability prediction analysis in the useful lifetime.
Rate of failure λ(t) is associated with the reliability function R(t) by (European Power Supply Manufacturers Association, 2004)
Where
Eq. 2 can be further simplified by assuming the failure rates are independent of time for the components and systems. Hence
The rate of failure is then predicted from the average number of failures per unit time represented as failures in time rate (FITs)
2.2 LLC converter failure modes
The LLC converter failure reasons (Choi et al., 2009; Ferreira Costa and Liserre, 2018) can be classified as primary and secondary factors, as shown in Figure 4. The primary factors are generally due to production issues, application issues, and environmental issues. Internal sources are secondary failures as it is the effect of primary sources. Sometimes the secondary (internal) failure becomes the primary failure due to the device characteristics and its parameters listed. Figure 4 shows the cause and effect diagram to identify the failures, and each parameter’s contribution to the converter failure rate and its reliability.
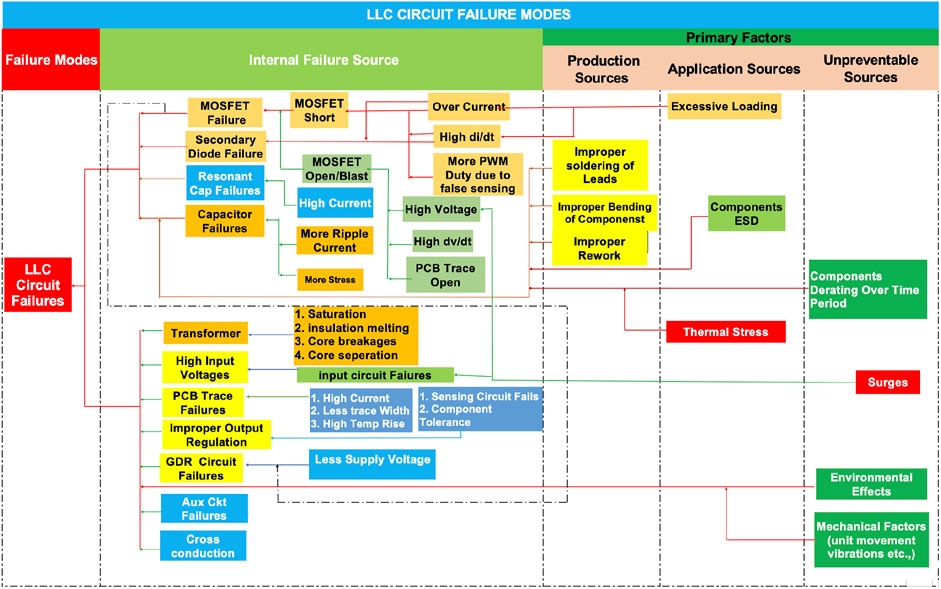
FIGURE 4. LLC converter failure modes.
3 Failure rate prediction
As described in section 2, the product experiences failures at various stages of its life cycle. The failure rate is different at each stage concerning the lifetime of the product. Early life failure is mainly due to design gaps and processes that occur, and it is minimized by rectifying these issues (European Power Supply Manufacturers Association, 2004). Wear-out failure is due to component aging. Usually, aging will not occur during its service life, which may be around 20 years (SR-332, 2016). Because of this reason, wear-out failures are not considered in this paper. Steady-state failures or constant product failures are isolated failures that occur due to some unknown factors like abnormal environment and abnormal operating conditions (Foucher et al., 2002; Foucher et al., 2002; European Power Supply Manufacturers Association, 2004; Liserre et al., 2014). The constant failure rate prediction is considered in this paper by considering the worst-case device/unit operating conditions and components’ stresses to predict product reliability.
3.1 Factors affecting failure rates
Product reliability is mainly based on component reliability and production quality. It is necessary to understand the key parameters which affect the reliability of a component. The critical stress factors are categorized mainly into thermal stress, electrical stress, and environmental stress (Peyghami et al., 2020; SR-332, 2016; Falck et al., 2017; Peyghami et al., 2021), as shown in Figure 5. Thermal stress on the device basically depends on the ambient temperature and the operating temperature. When there is a change in operating temperature, the device temperature also changes. It is directly proportional to each other. Environmental stress plays an essential role in the failure of the device. It is required to operate the device within the specified range.
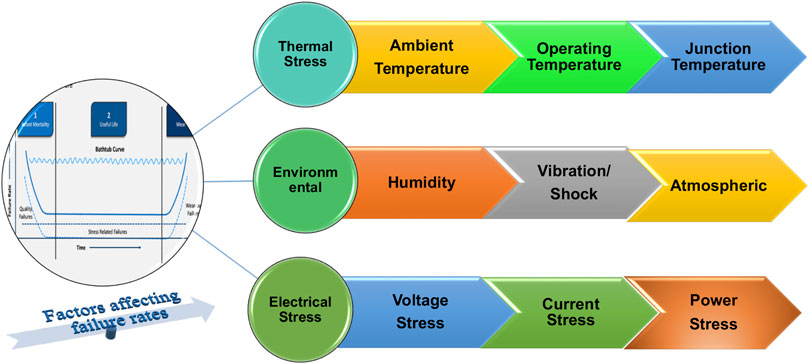
FIGURE 5. Environmental factors which lead to component failures.
In the same way, vibration and shock factors affect the component’s reliability (SR-332, 2016). Another important stress factor is electrical stress which includes the operating voltage and current. When the device is operated with higher values than the specification for a period more than the predefined time, it leads to electrical overstress (EOS) failures (Wang et al., 2012; Peyghami et al., 2020). When the product is designed to operate for an application, it is the designer’s responsibility to consider all the stress factors to maintain its reliability.
Each component will have all the stresses, which are shown (Figure 5) when it is used for a particular operation. There will be some threshold values for each type of stress—the stress factor changes based on the type and the condition to which the system is exposed. The component stress level is often used to predict the component failure rate (Wang et al., 2012).
3.2 Telcordia part count/stress method
The black box method of reliability prediction is preferred when the laboratory test data or field failure data is not available. This technique is straightforward to calculate the mean and standard deviation of the component level steady-state failure rate. The standard deviation is used to calculate the component’s failure rate when the upper confidence level (UCL) of the failure rate requires calculation (SR-332, 2016). From Eqs. 3, 6, it is noted that the reliability prediction can be calculated once the failure rate is known. Prediction of the steady-state failure rate for a component is based on each type of component’s generic failure rate given in the handbook. This standard value is further adjusted with quality, environmental, electrical, and temperature stress factors to get a component’s complete failure rate. Because each component is subjected to various stress while operating as a product. So, the constant failure rate
And the standard deviation of the failure rate is
Where,
3.3 Reliability information analysis centre handbook 217Plus stress part count/stress method
The RIAC handbook 217Plus has been developed and published by the Reliability Information Analysis Centre (RIAC). The 217Plus methodology is different when compared with MIL-HDBK-217 and Telcordia SR-332. The 217Plus considers different failure rates for each class of failure mechanism. A qualitative assessment of the process can determine the process factors to apply the weighting factors. The system reliability model is defined below:
And the component reliability model is defined as below
The RIAS 217Plus overcomes the significant drawbacks by eliminating the inherent multiplicative failure models. In addition, eliminate built-in model biases, introduce component and system-level reliability growth to sustain model relevancy, and incorporate field and actual test data. (David Nicholls and (RIAC), 2007). Figure 6 shows the flow of reliability prediction.
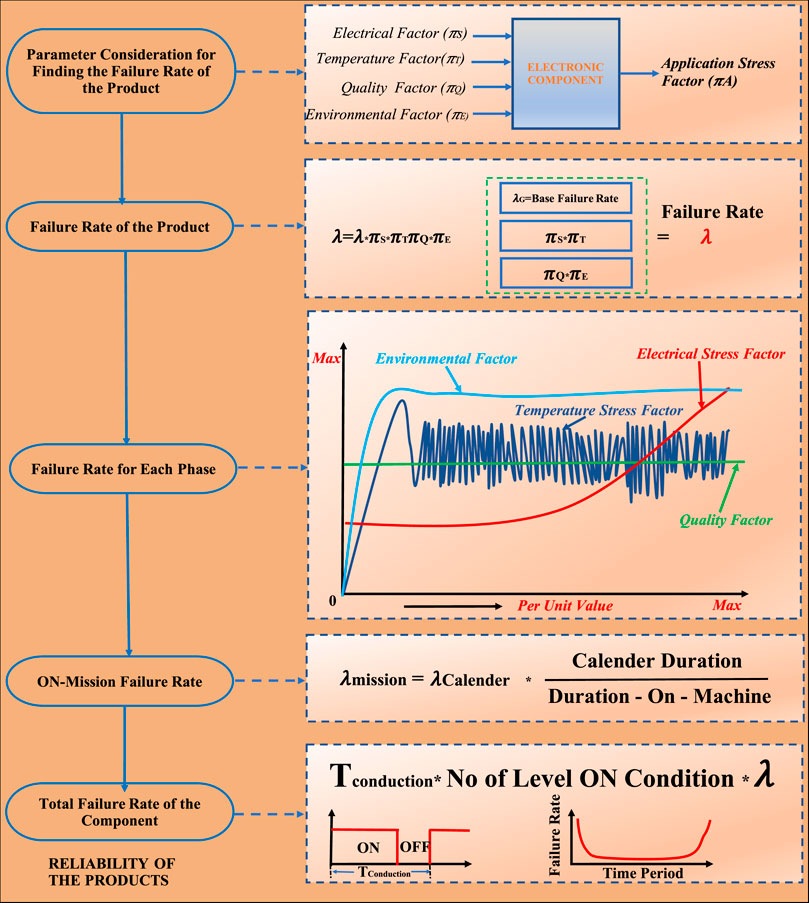
FIGURE 6. Failure rate calculation flow.
4 Component level failure rate prediction
Three primary methods have been applied to estimate the steady-state failure rate and the reliability of electronic parts. The part count method is a straightforward and easy technique to predict the failure rate and reliability while designing the product. This section describes the calculation of the failure rate and the reliability of electronic components by considering different stress factors discussed in section 3. The reliability and failure prediction for an LLC converter with critical components like MOSFET (metal oxide field effect transistor), Diodes, Capacitors, and magnetics have been presented in this work.
4.1 Component failure rate prediction
The component failure rate changes through its life cycles, and it follows Figure 3. The component failure rate can be predicted using various methods. The Telcordia SR-332 is widely employed for reliability and failure rate prediction for electronic telecommunication products. Eqs. 7, 8 can be used to determine the failure rates. Eqs. 5, 6 shows that each component’s failure rate varies based on the type of component’s generic failure rate, followed by temperature, electrical, environmental, and quality stress factors (SR-332, 2016).
Telcordia SR-332 recommends a generic failure rate for each device and other stress factors based on its stress curves (SR-332, 2016). Electrical stress and temperature stress values must be calculated based on the component stress involved in the actual application. The general formula for finding temperature stress and electrical stress is followed as (SR-332, 2016)
Where,
Ea is the activation energy, k is the Boltzmann constant, T1 is operating temperature, and T0 is reference temperature (40°C).
Where P1 is applied voltage stress, P0 is the default voltage stress (50%) of the component, and m is the stress parameter value based on the stress curves of the components. Other stress factors that are mentioned have a direct reference value. The quality factor has reference values ranging from 0 to 6 based on the quality level defined. The quality level can be defined based on application, component characteristics, component qualification, and component quality data from the component manufacturers (SR-332, 2016). Quality level II (=1) is considered here for all component failure rate calculations.
Similarly, the environment factor also has the ready values to be used based on the environmental conditions. Location can be ground or airborne, fixed or mobile, and operating environment controlled or uncontrolled (SR-332, 2016). Ground as a fixed and controlled environment is considered here with its stress value as 1. Three components are considered to demonstrate the failure rate with respect to electrical and thermal stress, and the failure rate is plotted concerning thermal and electrical stress as shown in Figure 7 for the Electrolytic capacitor, MOSFET, and Diode. From Figure 7 it is observed that the failure rate increases as the thermal and electrical stress increases. But the effect of thermal stress is more than the electrical stress. Electrolytic capacitors have more failure rate due to temperature variations. The lifetime of the capacitors becomes half for every 10°C (SR-332, 2016) rise in temperature.
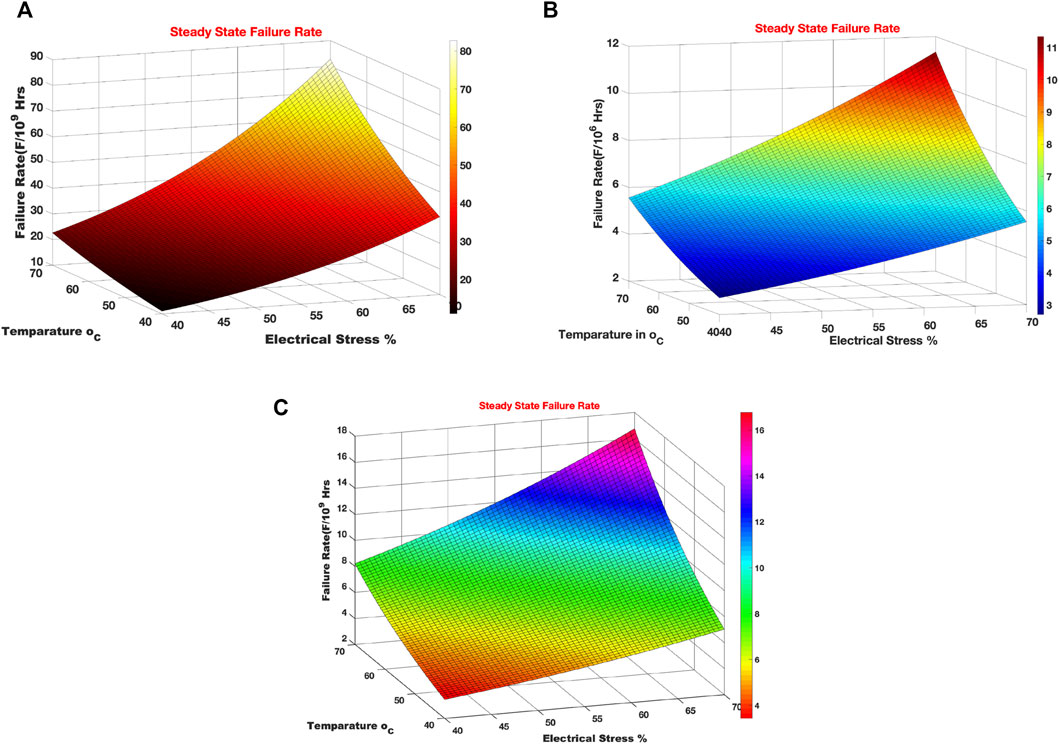
FIGURE 7. The component failure rate with respect to thermal and electrical stress (A) Electrolytic capacitor (B) MOSFET (C) Diode.
Operating switching frequency plays a vital role for semiconductors, magnetics, and electrolytic capacitors. The losses of semiconductors and magnetic devices vary with respect to the switching frequency. As the losses vary, the device’s operating temperature also varies. So the operating frequency affects the device reliability because the temperature is also changing. In the same way, the capacitor ripple current changes due to the frequency. The operating temperature of the electrolytic capacitor changes as there is a change in capacitor ripple current due to frequency. All electrolytic capacitor manufacturers give the ripple current calculation details and its internal temperature rise details to use for design and calculating lifetime. All operating factors are essential to consider while predicting the failure rate of a device or a system. It is necessary to consider all the parameters during the design stage as there is an opportunity to change the operating conditions to improve the reliability of a device or the system.
This study considers a few devices to predict failure rate based on the application and is discussed in the next section. For example, The MOSFET is a switching device. However, switching devices like transistors and IGBT are also used for various topologies. IGBT failure rate prediction is presented in (Alavi et al., 2016) for inverter applications. Each device’s physics and chrematistics are different, so the failure prediction rate is also different. As the generic device failure is different, the parameters under consideration also vary. Some common factors (Darla and Chitra, 2021b), like external and unavoidable factors, must be considered commonly between the type of components while evaluating the failure prediction. In ref (Darla and Chitra, 2021b), internal, external, and environmental factors are defined for the device or topology failures. It is essential to study the passive or active component parameters while conducting the reliability study.
5 Converter failure rate prediction
The LLC converter’s power circuit is taken as an example with all critical components and other associated functional circuit components, as shown in Figure 8. A 300W, 12 VDC LLC converter is taken as an example to calculate the failure rate. The LLC converter failure rate is the sum of all component failure rates presented in the circuit. MTBF can be calculated using Eq. 6 after finding the circuit failure rate. Stress factors, such as quality and environmental factors, are also used to calculate component failure rates.
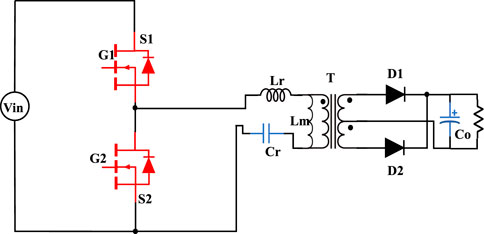
FIGURE 8. LLC resonant converter power circuit.
The converter is subjected to various operating conditions in the field over its lifetime. It has to function satisfactorily under all environmental conditions, input and load transients, overload, and fault conditions. Sometimes, the device’s stress increases beyond its rated values. It is essential to consider the device’s stress levels at different conditions to operate in a safe operating area.
Figure 9 shows the bench test setup of the IBC converter, the power module has DC input and DC output. The IBC power module is fixed on the development board with external filter capacitors at the output side. Table 2 shows the component list with part numbers used in the power module. Each component’s stresses are different when it operates in steady-state, transient, overload, and failure states. Maximum operating stress limits are generally defined during the product design stage by considering all worst-case conditions as per product specifications. ICT equipment power conversion devices follow IPC9592B (IPC-9592, 2008) standard component derating guidelines for all electronics and magnetics parts. Table 2 shows circuit-level components with their derating stress limits as per IPC9592 (IPC-9592, 2008). These derating values are compared to analyze the failure rate of the converter at different operating mission profiles.
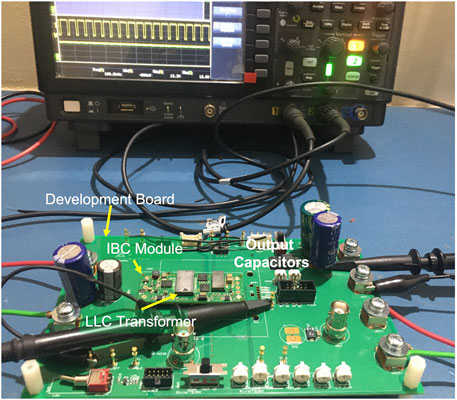
FIGURE 9. Bench test setup picture.
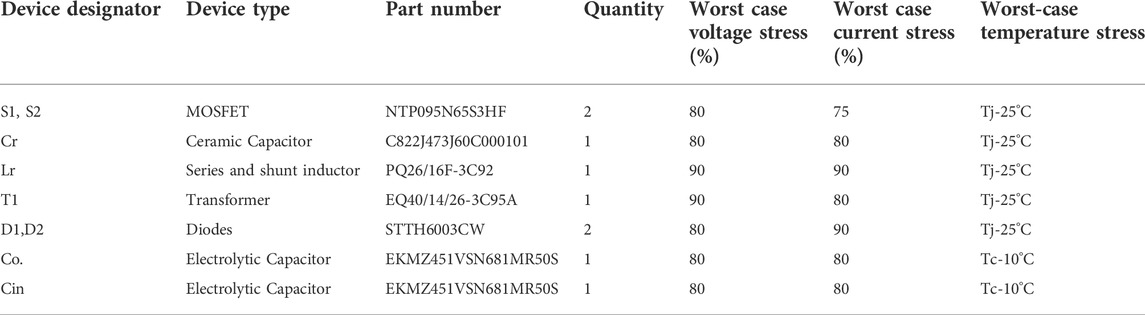
TABLE 2. Component list of LLC converter with worst-case component stress values (IPC-9592, 2008).
Each component’s stress value is defined as per its safe operating points. The safe operating junction temperature for semiconductor devices is 25°C margin whereas for electrolytic capacitors it is 10°C. These are worst-case scenarios to adopt while designing the margins for each device. The voltage stress of the components varies from 70% to 90%, depending on the type of the component (IPC-9592, 2008). It is reasonable to accept 95% transient voltage stress for some of the devices (IPC-9592, 2008).
5.1 Conventional failure rate prediction
The converter has to be exposed to various operating conditions in the field. Under this section, the LLC converter reliability is predicted under both mission profiles shown in Figure 10. Firstly, the LLC component failure rates are estimated based on the Telcordia approach and the 217Plus method. The environment is controlled and uncontrolled. The estimated failure rate of the converter and individual components are shown in Figures 11A,B for both locations. Each method of failure rate is different for each component. The component failure rate doubles when the environment is uncontrolled (outdoor) due to the environmental stress factor. The stress factor is a direct multiplier with the generic failure rate in the Telcordia prediction method. At the same time, the component failure is the same for a few components and slightly increased for a few parts in the 217Plus prediction method.
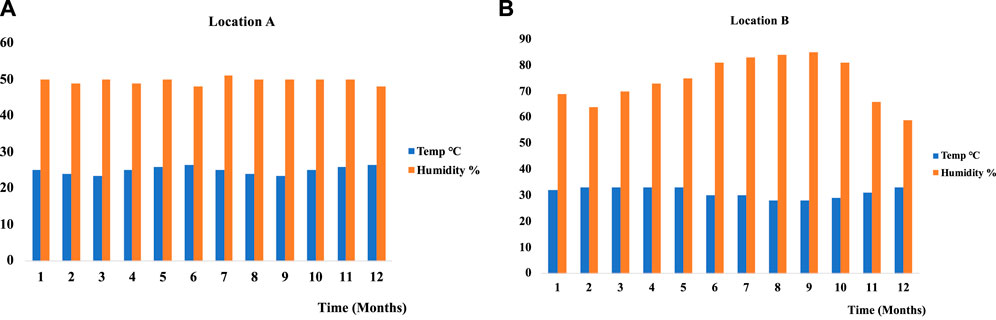
FIGURE 10. Annual temperature and humidity for (A) Location A, (B) Location (B).
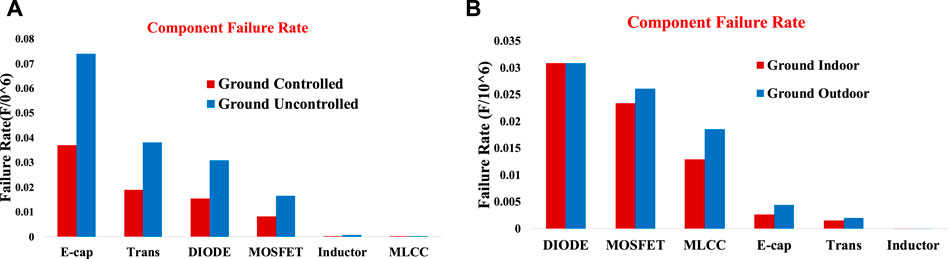
FIGURE 11. The component failure rate in different environments. (A) Telcordia SR-332, (B) 217Plus.
From Figure 11, it is observed that the semiconductor devices and the capacitor have the highest failure rate compared with other devices. The chances of component failures increase when the environment changes as devices’ thermal stress play a vital role in component reliability. Converter reliability decreases due to component failures. Component failure rate also depends on electrical stresses, which arise due to component derating, operating transients, and failure conditions. In Figure 11, 50% electrical stress is used to predict the failure rate for its useful lifetime.
Generally, the product will operate at various operating profiles in the field like extreme environmental changing conditions, input and output transient, and fault conditions. These conditions are not considered in the above analysis to predict the failure rate. These are important to consider to predict the failure and to make necessary protection in the design stage. Telcordia prediction method cannot be applied for mission profiles to predict failure, but 217Plus can predict failure at various operational mission profiles. The following section discusses the failure rate of components and converters at different input transients and environmental mission profiles.
5.2 Experimental verification of proposed transients failure mode prediction
The component failure rates are higher with mission profile B than mission profile A, as shown in Figure 12.
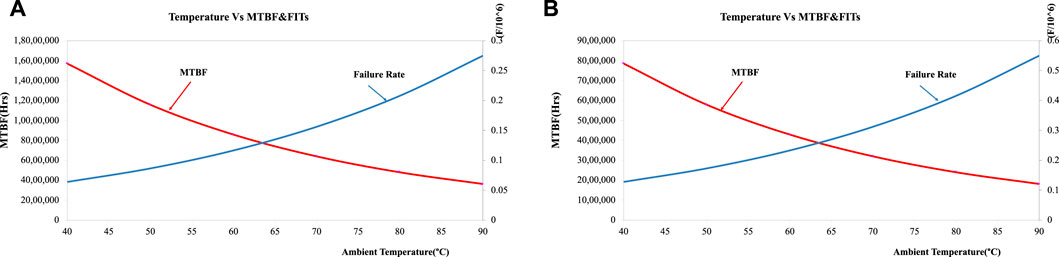
FIGURE 12. Failure rate and MTBF of LLC converter at (A) Ground, fixed, and controlled (B). Ground, Fixed, and uncontrolled.
Thereby, the component’s constant failure rate significantly depends on the operating conditions. Therefore, the component failure rate and the weakest links of the converter depend on operating conditions. Location, B mission profile, is considered to conduct experimental analysis to estimate the failure rate of the converter at the following conditions.
(1) Input voltage transients
(2) Input surges
5.2.1 Input voltage transients
Failure rate due to input surges is not feasible to estimate as it creates catastrophic failures. Failure rate prediction due to surges is not considered in this paper as it requires a more detailed analysis of surge voltage spikes and their time duration. When the converter is operated at location B there is a chance of getting higher and lower voltage due to input source surges and sags. When there is surge voltage in input voltage, LLC converter Cin, S1 and S2 exposes to these surges. Due to high surge voltages, the voltage stress of these devices increases, and the device derates. If the surge voltage is very high for more time duration, the devices lead to catastrophic failures, as shown (Figure 4). When there is a sag in input voltage, the thermal stress of the devices increases due to the current rise. This leads to device derating and the possibility of device failure.
These kinds of stresses occur in the field quite often, which may be from 10 to 20 percent of its total operating field time. These 10 to 20 percent cycles can be included while predicting the failure rate and environmental stress factors. The 217Plus standard is used to predict the failure rate. The input surge/sag is ±20% from minimum and maximum operating voltages. The voltage variation step is 1 V with power cycling of 20 s off time and 40 s on time. The power supply is operated in real-time with the test setup for minimum voltage to maximum voltage range, as shown in Figure 13.
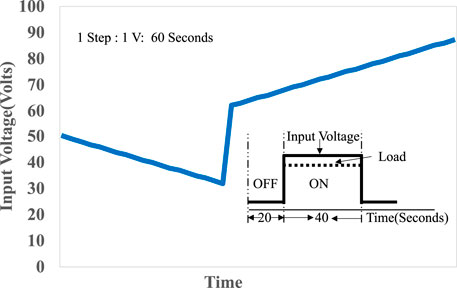
FIGURE 13. Input voltage transient profile.
The converter failure rate depends on each component’s failure rate. When the converter experiences the transient input profile, as in Figure 13, each component is stressed more. The failure rate of the converter is estimated by giving actual voltage and current stress values at the given profile. Table 3 shows the actual converter and component failure rate and its MTBF at location B with an input voltage transient profile as shown in Figure 13 from the experimental data.
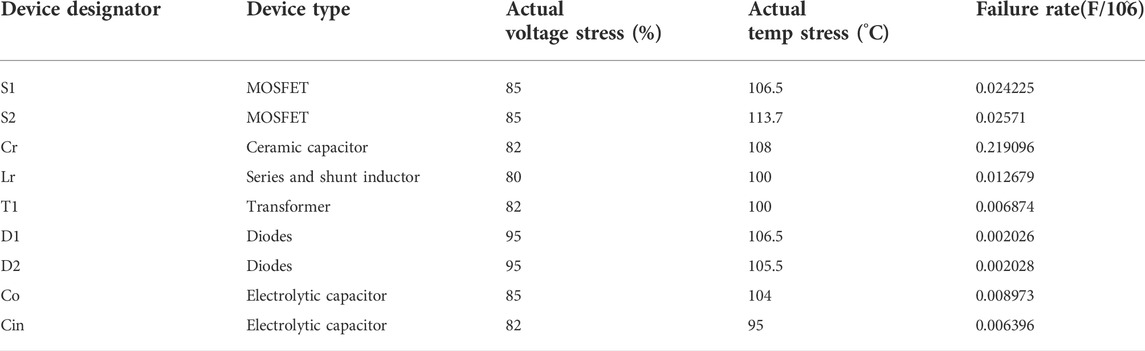
TABLE 3. Tested voltage and thermal stress of components and individual component level failure rate and MTTF.
Figure 14 shows the converter failure rate, MTBF, and reliability of the LLC converter, Figure 14A shows the failure rate and MTBF with respect to the operating temperature stress range. The failure rate and MTBF have higher values when compared to the Telcordia method Figure 11 because the actual test condition and the parameters are added to find the failure rate.
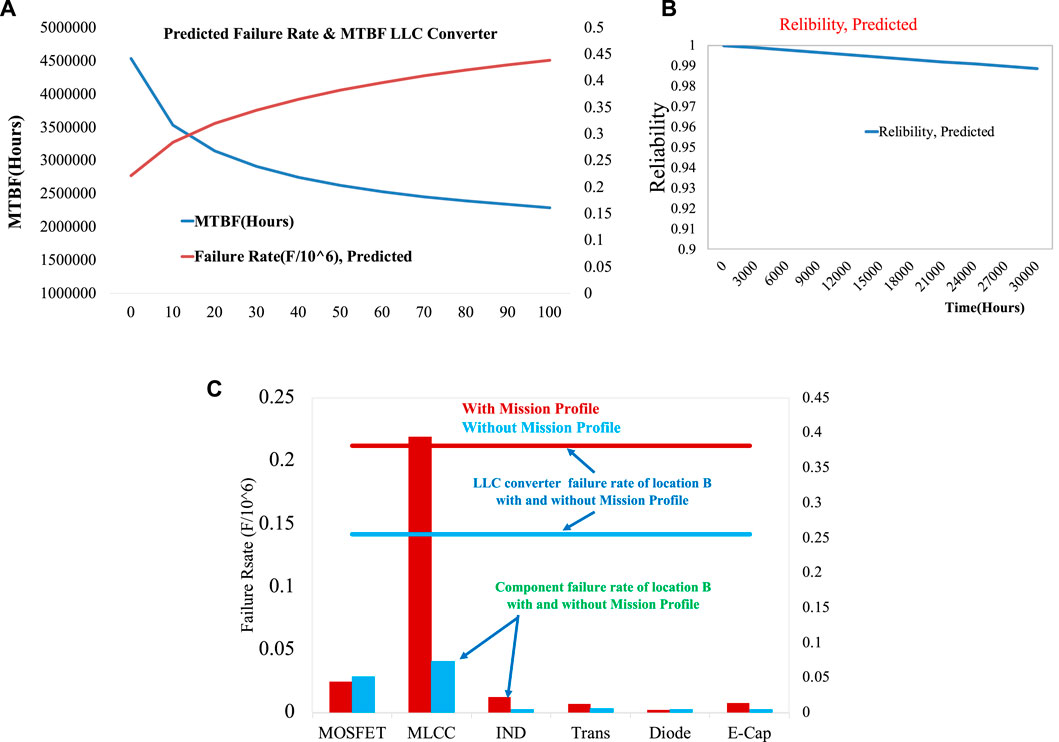
FIGURE 14. LLC converter reliability, failure rate with input voltage transients (A) MTBF vs. Failure rate (B) Reliability (C) Device vs. Converter failure rate.
Figure 14B shows the reliability of the LLC converter with respect to time, and it is observed that the reliability decreases over a period of time when it is operating in the field under specified conditions. Figure 14C shows the device failure rates and converter failure with and without mission profiles. The failure rate is increasing at location B (Figure 10) due to higher environmental stress and operating transients.
Failure rate, MTBF, and reliability analysis are summarised as shown in Figure 15. Calculations are summarised at 40°C to compare the data with different methods. The failure rate is less in controlled environments as both temperature and humidity are controlled. The failure rate data shows that in the uncontrolled environment, failure rate increases to two times of the value obtained in controlled mode. At the same time, 217Plus calculations show that the failure rate increased very little due to the method of calculation is summative, not a product. The failure rate is doubled in Telcordia Ground controlled environment to uncontrolled environment. This failure rate is lesser when it is compared with the 217Plus standard with actual test conditions. The failure rate of the LLC converter is 0.3645 with an MTBF of 2,743 k h by considering the uncontrolled environment (location B) and input transients. This method of analysis gives more accurate values when compared to other listed methods (Figure 15).
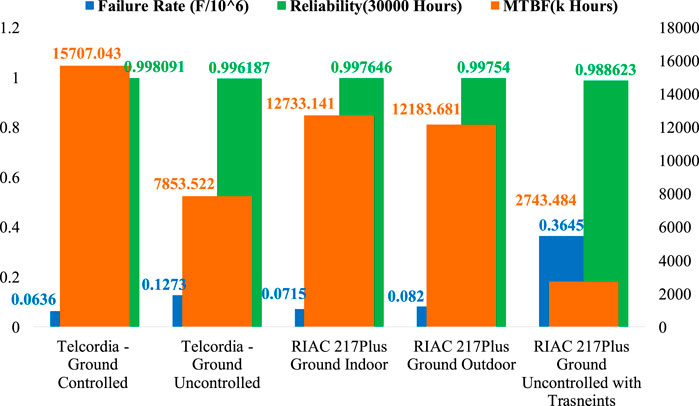
FIGURE 15. Comparison of quality and reliability data.
In this study, an LLC converter is chosen to estimate the failure rate by considering transient conditions. The 217Plus method of prediction is best suited for this application as it gives the flexibility to use mission profiles and actual stress values. Table 4 shows some of the methods used to predict the failure rate for different power converter topologies.
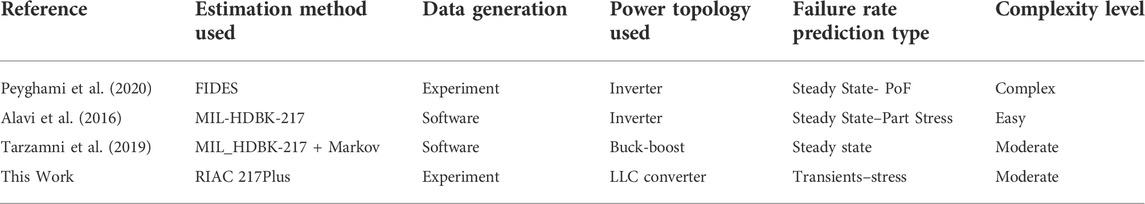
TABLE 4. Reliability prediction of power electronics converters by using different methods.
6 Conclusion
This paper presents an LLC converter failure rate prediction based on steady-state and actual transient test models using the 217Plus handbook method. This model includes both electrical and thermal simulation, making it capable of obtaining failure rate information for a given transient test profile. The device’s electrical stress and thermal stresses are measured from the test to use for prediction. The transient test model gives more insight to estimate the failure as it replicates the field conditions. 217Plus method is more flexible to estimate the reliability at the system-level by considering actual device stresses at different mission profiles.
The failure rate of the LLC converter is calculated for various stress factors and in controlled and uncontrolled environments. The LLC converter’s MTBF is estimated as 12,183,681 h when the converter operates at location B in steady-state conditions. In contrast, the converter MTBF is 2,743,484 h by considering transient conditions. The reduction in MTBF is due to increased component level stresses. As a result, the failure rate is also increased from 0.082 F/10^6 to 0.3645 F/10^6 with reliability of 0.98863. Repetitive transient test data is considered instead of considering only steady-state test data at this stage. Therefore, the failure rate of the LLC converter is more realistic by considering the field and actual test data with field operating conditions.
Data availability statement
The original contributions presented in the study are included in the article/supplementary material; further inquiries can be directed to the corresponding author.
Author contributions
RD and CA contributed to problem statement, conception and design of the study. RD performed the test, data analysis, CA enhanced the test methodology using Telcordia SR-332 and 217Plus. All authors contributed the manuscript, writing, review and revision of the submitted version.
Conflict of interest
The authors declare that the research was conducted in the absence of any commercial or financial relationships that could be construed as a potential conflict of interest.
Publisher’s note
All claims expressed in this article are solely those of the authors and do not necessarily represent those of their affiliated organizations, or those of the publisher, the editors and the reviewers. Any product that may be evaluated in this article, or claim that may be made by its manufacturer, is not guaranteed or endorsed by the publisher.
References
Alam, H. H. M. M., and Alam, M. M. (2016). “Reliability, maintainability, availability and failure rate analysis of IGBT triggering system designed for marine environment,” in 2016 13th International Bhurban Conference on Applied Sciences and Technology (IBCAST), Islamabad, Pakistan, 12-16 January 2016 (IEEE), 295–299. doi:10.1109/IBCAST.2016.7429893
Alavi, O., Hooshmand Viki, A., and Shamlou, S. (2016). A comparative reliability study of three fundamental multilevel inverters using two different approaches. Electronics 5, 18. doi:10.3390/electronics5020018
Choi, W., Kim, S. D.-w., and Kim, D. (2009). “Analysis of MOSFET failure modes in LLC resonant converter,” in INTELEC 2009 - 31st International Telecommunications Energy Conference, Incheon, Korea (South), 18-22 October 2009 (IEEE). doi:10.1109/INTLEC.2009.5351877
Darla, R. B., and Chitra, A. (2021). A comprehensive review of distributed power system architecture for telecom and datacenter applications. Int. J. Power Electron. Drive Syst. 12 (2021), 1535–1555. doi:10.11591/ijpeds.v12.i3.pp1535-1555
Darla, R. B., and Chitra, A. (2021). “A blackbox failure rate prediction method for power electronic converters,” in 2021 IEEE Madras Section Conference (MASCON), Chennai, India, 27-28 August 2021 (IEEE), 1–6. doi:10.1109/MASCON51689.2021.956353
David Nicholls, (RIAC) (2007). New reliability prediction methodology incorporates field and test experience. J. IEST 50, 5–13. doi:10.17764/jiet.50.2.mt67r8g885347162
Denson, W. (1998). The history of reliability prediction. IEEE Trans. Rel. 47, SP321–SP328. doi:10.1109/24.740547
European Power Supply Manufacturers Association (2004). Guidelines to understanding reliability prediction. Report.
Falck, J., Andresen, M., and Liserre, M. (2017). “Active methods to improve reliability in power electronics,” in IECON 2017 - 43rd Annual Conference of the IEEE Industrial Electronics Society, Beijing, China, 29 October 2017-01 November 2017 (IEEE), 7923–7928. doi:10.1109/IECON.2017.8217389
Falck, J., Felgemacher, C., Rojko, A., Liserre, M., and Zacharias, P. (2018). Reliability of power electronic systems: An industry perspective. EEE Ind. Electron. Mag. 12 (2), 24–35. doi:10.1109/mie.2018.2825481
Ferreira Costa, L., and Liserre, M. (2018). Failure analysis of the dc-dc converter: A comprehensive survey of faults and solutions for improving reliability. IEEE Power Electron. Mag. 5 (4), 42–51. doi:10.1109/MPEL.2018.2874345
FIDES (2010). Guide 2009 edition: A reliability methodology for electronic systems. Available: www.fides-reliability.org.
Foucher, B., Boullié, J., Meslet, B., and Das, D. (2002). A review of reliability prediction methods for electronic devices. Microelectron. Reliab. 42 (8), 1155–1162. doi:10.1016/s0026-2714(02)00087-2
Hayes, J. J., and Hayes, J. (2001). Estimation of system reliability using a "non-constant failure rate" model. IEEE Trans. Rel. 50 (3), 286–288. doi:10.1109/24.974125
IPC-9592 (2008). Requirements for power conversion devices for the computer and telecommunication industries. AvaliableAt: https://interferencetechnology.com.
Liserre, H. M., Blaabjerg, F., de Place Rimmen, P., Jacobsen, J. B., Kvisgaard, T., and Landkildehus, J. (2014). Transitioning to physics-of-failure as a reliability driver in power electronics. IEEE J. Emerg. Sel. Top. Power Electron. 2 (1), 97–114. doi:10.1109/jestpe.2013.2290282
Ma, K., Blaabjerg, H. F., and Blaabjerg, F. (2016). New Approaches to Reliability Assessment: Using physics-of-failure for prediction and design in power electronics systems. IEEE Power Electron. Mag. 3 (4), 28–41. doi:10.1109/MPEL.2016.2615277
MIL-217 (1992). Bellcore/telcordia and other reliability prediction methods for electronic products. Reliasoft.
MIL-HDBK-217F (1995). Reliability prediction of electronic equipment, MIL-HDBK-2I7F N2. Philadelphia, PA: Department of Defense.
nakakohara, Y., Otake, H., Evans, T. M., Yoshida, T., Nakahara, M. K., and Nakahara, K. (2015). Three phase LLC series resonant DC/DC converter using SiC MOSFETs to realize high voltage and high frequency operation. IEEE Trans. Ind. Electron. 63 (4), 1. doi:10.1109/TIE.2015.2499721
National Research Council (2015). Reliability growth: Enhancing defense system reliability. Washington, DC: The National Academies Press.
Obeidat, F., and Shuttleworth, R. (2015). “Reliability prediction of PV inverters based on MIL-HDBK-217F N2,” in 2015 IEEE 42nd Photovoltaic Specialist Conference (PVSC), New Orleans, LA, 14-19 June 2015 (IEEE), 1–6. doi:10.1109/pvsc.2015.7356277
Peyghami, S., Blaabjerg, F., and Palensky, P. (2021). Incorporating power electronic converters reliability into modern power system reliability analysis. IEEE J. Emerg. Sel. Top. Power Electron. 9, 1668–1681. doi:10.1109/JESTPE.2020.2967216
Peyghami, S., Davari, P., Zhou, D., F-Firuzabad, M., and Blaabjerg, F. (2019). “Wear-out failure of a power electronic converter under inversion and rectification modes,” in 2019 IEEE Energy Conversion Congress and Exposition (ECCE), Baltimore, MD, USA, 29 September 2019 - 03 October 2019 (IEEE), 1598–1604. doi:10.1109/ecce.2019.8913144
Peyghami, S., Wang, Z., and Blaabjerg, F. (2020). A guideline for reliability prediction in power electronic converters. IEEE Trans. Power Electron. 35 (10), 10958–10968. doi:10.1109/TPEL.2020.2981933
SR-332 (2016). Reliability prediction procedure for electronic equipment, issue 4. Piscataway, NJ: Telcordia Technologies.
Tarzamni, H., Tahami, F., Fotuhi-Firuzabad, M., and Esmaeelnia, F. P. (2019). “Reliability analysis of buck-boost converter considering the effects of operational factors,” in 2019 10th International Power Electronics, Drive Systems and Technologies Conference (PEDSTC), Shiraz, Iran, 12-14 February 2019 (IEEE), 647–652. doi:10.1109/PEDSTC.2019.8697266
Wang, H., Blaabjerg, K. F., and Blaabjerg, F. (2012). “Design for reliability of power electronic systems,” in IECON 2012 - 38th Annual Conference on IEEE Industrial Electronics Society, Montreal, QC, Canada, 25-28 October 2012 (IEEE), 33–44. doi:10.1109/IECON.2012.6388833
Wang, H., Liserre, M., and Blaabjerg, F. (2013). Toward reliable power electronics: Challenges, design tools, and opportunities. EEE Ind. Electron. Mag. 7 (2), 17–26. doi:10.1109/mie.2013.2252958
Keywords: telecom power supply, input transients, failure rate prediction, reliability prediction, DC-DC converters, LLC converter reliability
Citation: Darla RB and Annamalai C (2022) A novel reliability prediction with input transients for an LLC converter. Front. Energy Res. 10:912710. doi: 10.3389/fenrg.2022.912710
Received: 30 August 2022; Accepted: 12 September 2022;
Published: 05 October 2022.
Edited by:
Xiangping Hu, Norwegian University of Science and Technology, NorwayReviewed by:
Mohamed Salem, Universiti Sains Malaysia (USM), MalaysiaNatarajan Prabaharan, SASTRA University, India
Copyright © 2022 Darla and Annamalai. This is an open-access article distributed under the terms of the Creative Commons Attribution License (CC BY). The use, distribution or reproduction in other forums is permitted, provided the original author(s) and the copyright owner(s) are credited and that the original publication in this journal is cited, in accordance with accepted academic practice. No use, distribution or reproduction is permitted which does not comply with these terms.
*Correspondence: Chitra Annamalai, Y2hpdHJhQHZpdC5hYy5pbg==