 Ali Elrashidi
 Enrico Traversa
 Basma Elzein
94% of researchers rate our articles as excellent or good
Learn more about the work of our research integrity team to safeguard the quality of each article we publish.
Find out more
ORIGINAL RESEARCH article
Front. Energy Res., 13 October 2022
Sec. Carbon Capture, Utilization and Storage
Volume 10 - 2022 | https://doi.org/10.3389/fenrg.2022.909950
The carbon dioxide highly sensitive ultra-thin optical sensor using plasmonic nanoparticles distributed uniformly on the nanowall honeycomb structure with a footprint in the millimeter range is presented in this work. The zinc oxide (ZnO) honeycomb nanowall structure is grown by the pulsed laser deposition (PLD) method. Moreover, the performance of the fabricated structure as a gas nanosensor is simulated using the finite difference time domain (FDTD) method in the visible and near-infrared regions. A graphene layer is mounted on the top of the nanowall, and then, plasmonic nanoparticles are distributed on the nanowall sides. Furthermore, the effect of gas concentration on the pressure and consequently on the dielectric constant of the gas are also illustrated in this article. Red-shift in the absorption has been noticed with different refractive indices and intensity sensitivities. The obtained refractive index sensitivity of the proposed nano optical sensor is 874 nm/RIU, and the intensity sensitivity is 5,174 RIU−1 with the figure of merit of 12.5 and quality factor (Q-factor) of 281 at a carbon dioxide (CO2) concentration of 5,500 ppm. Finally, the absorbed power of the incident light is calculated using different polarization angles, from 10° to 80° with a step10°.
Sensing the concentration of carbon dioxide (CO2) gas in the atmosphere is very important in many applications, including petrochemical industry (Vogler and Sigrist, 2006), monitoring of combustion control (Mulrooney et al., 2007), indoor air quality control (Kwon et al., 2009), aquaculture (Pfeiffer et al., 2011), agriculture (Chaudhary et al., 2011), food processing (Neethirajan et al., 2009), and medical care (Folke et al., 2003). The main source of CO2 is mostly from human activities through industries and vehicles (O’veill et al., 2010). The daily average level of CO2 is increased to be around 421 ppm, where the maximum safe level is 5,000 ppm (Gheorghe et al., 2021). Moreover, many symptoms can be noticed above the aforementioned level such as headaches, fatigue, sleepiness and being stagnant, anxiety, poor concentration, lung ventilation problems, and increased heart rate (Gheorghe et al., 2021). Due to these critical health problems, many CO2 sensing technologies are available, which are classified into two majors: nondispersive infrared (NDIR) optical and chemical sensors (McDonagh et al., 2008).
Chemical sensors use a polymer layer to sense CO2 based on the pH change during the reaction (Chen et al., 2014). The main drawbacks are poor selectivity and short- and long-term sensor drift, which need periodic calibration to maintain long-term stability (Liu et al., 2012).
Due to its high detection specificity, simplicity, and reliability, optical sensors using infrared (IR) absorption are the main and most efficient sensors used for the detection and identification of hazardous and greenhouse gases (Dinh et al., 2016; Chen et al., 2014). Moreover, IR sensors have a fast response, long lifetime, minimal drift, and can be used in real time without disturbing the target system (Gheorghe et al., 2021). IR optical sensors operate in the near-infrared (NIR), 0.8–2.5 µm, and infrared, 2.5–10 μm, bands (Wang et al., 2017). On the other hand, the main challenge of such sensors is the absorption interference caused by water vapor as the optical detection of CO2 occurs in the presence of humidity (Mitra, 2018). Hence, optical filters can be used to eliminate interference, but the absorption is reduced due to the refractive index property of the used filters (Dinh et al., 2016).
Recently, localized surface plasmon resonance (LSPR) has drawn substantial research attention as it is believed to be one of the most practical techniques to sense gases for its high compatibility and sensitivity (Zhao et al., 2019; Semwal and Gupta, 2019; Elrashidi, 2020a). Moreover, zinc oxide, ZnO, is widely used in gas sensors due to its unique properties and its high performance, such as high electron communication, nontoxicity, good chemical and thermal stability, and high isoelectric point which allows a substance with a low isoelectric point to attach to its surface and immobilize them to their biological activity after the binding process which is not the case when using gold material (Baruah et al., 2019; Zhao et al., 2012; Shiryaev et al., 2014; Elrashidi, 2020b).
Being an n-type material, ZnO is known to have high oxygen vacancies. Considering that the CO2 gas-sensing process relies on the oxygen vacancy principle makes ZnO the best material to be used which also allows the gas-sensing behavior to be controlled by the reduction of ZnO.
Under conventional conditions, ZnO has the wurtzite structure which has a hexagonal unit cell. The structure of ZnO is described as a number of alternating planes composed of tetrahedrally (Wang, 2009) coordinated O2- and Zn2+ ions, stacked alternatively along the c-axis. Fabrication methods can impact the energy surfaces and their polarization and might affect their properties (Batzill and Diebold, 2005).
When CO2 comes in contact with ZnO, a surface interaction may occur through oxidation/reduction, electron charge transfer, adsorption, or chemical reaction (Korotcenkov, 2007). The chemical interaction of CO2 and ZnO causes a change in electrical properties.
Furthermore, the plasmonic metasurface is used as a perfect absorber and highly sensitive refractive index sensor (Zhang et al., 2021; Cheng et al., 2021a). In Sb, the metasurface is also used as a high refractive index temperature sensor in the gigahertz band, 1,043.3 GHz/RIU, (Cheng et al., 2021b; Cheng et al., 2020a). In addition, a graphene layer is used to enhance the absorption of metamaterials in the gigahertz range (Cheng et al., 2020b; Chen et al., 2020). Also, photoconductive silicon metamaterial is used to enhance the absorption band, in the gigahertz band (Cheng et al., 2021c; Fermani and Fermani, 2020).
Some related works have been conducted recently to introduce a highly sensitive CO2 sensor using the SPR technique and ZnO layer as illustrated as follows.
Herminjard et al. (2009) introduced the first surface plasmon resonance (SPR) CO2 sensor in the mid-IR region, which is based on the Kretschmann model (Kretschmann and Raether, 2014). The proposed structure used a glass prism of CaF2 and two layers from Ti and Au, and the sensor sensitivity was 10−5 RIU−1.
An optical toxic gas sensor using SPR such as cyanogen, ethanol, propane, nitrogen oxide, and phosgene was introduced by Amoosoltani et al. (2019). The proposed sensor was simulated by the FDTD method using different materials to obtain a full width at half maximum and Q-factor of 4.2 nm and 214.28, respectively, and a maximum sensitivity >270 nm/RIU and merit of figure >30.
Farmani (2019) introduced a 3D plasmonic nanosensor in the near-infrared region using FDTD with high sensitivity, 700 nm/RIU, and the figure of merit of 1,090 for 0.15 change in the refractive index of the dielectric layer.
A modified hemiprism of the Kretschmann gas sensor configuration was manufactured using a gold (Au) layer (Nuryadi et al., 2015). A cylindrical-shaped ZnO layer was used on the top Au layer to maintain CO2 circulation on the ZnO surface.
An integrated hybrid surface plasmon biosensor was designed and optimized by Gorman and Haxha (2014). The given design produced a sensitivity of 3 µm/RIU and a resolution of 3.34 × 10⁻⁶ RIU for a refractive index between 1.33 and 1.34.
Two sensors were introduced by Mi et al. (2016): one to detect the CO2 and the other to determine the concentration in the range of 0–500 ppm with a sensitivity of 6 × 10⁻⁹ RIU/ppm (Mi et al., 2016).
Pérez-Ocón et al. (2021) introduced a highly sensitive SPR CO2 sensor, which senses the concentration in air and any type of environment with a resolution of 5.15 × 10⁻⁵ RIU and sensitivity of 19.4 RIU−1 for 400 ppm (Pérez-Ocón et al., 2021).
In this work, a unit cell of high-quality ZnO nanowall honeycomb structure was grown using the PLD method that has been patented by El zein et al. (2013). Then, the simulation of the proposed structure was studied using the finite difference time domain method (FDTD). The Lumerical simulation tool was used to calculate the absorption from the visible to near-infrared region, 0.4–2.5 µm. Then FWHM, refractive index sensitivity, intensity sensitivity, FOM, and Q-factor were also calculated. Finally, the absorption of the broadband absorber was simulated at different polarization angles of the incident light. In this work, an ultra-sensitive refractive index optical sensor using the ZnO nanowall honeycomb nanostructure is used to sense the concentration of CO2 in ppm in the visible and near-infrared optical regions. The change in the CO2 temperature and pressure on the refractive index is also studied.
The basic idea of optical gas CO2 sensors is that the refractive index of CO2 is changing according to the gas concentration in contact with the sensing medium. Consequently, we can sense optical waves by direct/indirect monitoring of the refractive index changes of the used sensing material with the change in the gas concentration. A change in the CO2 concentration will be indirectly measured by observing the shift of the LSPR wavelength of the used plasmonic material. Plasmonic particle’s shape, size, and dielectric function of the used nanoparticles, in addition to the dielectric constant of the surrounding medium, determine the position of the maximum spectrum of the refracted wave (Tharwat et al., 2017).
The maximum value of the reflected wave located at wavelength λmax can be calculated using Eq. 1 (Elrashidi, 2016).
where P is structural periodicity,
where
The main sensor parameter is the sensor sensitivity, Sn, which is defined as a ratio between the shifting in the resonance wavelength,
where RIU is the refractive index unit (Chung et al., 2011). Furthermore, the figure of merit (FOM) which is considered the main parameter of the sensor can be defined as the ratio between the refractive index sensitivity, Sλn, and
Finally, the quality factor (Q-factor) also can be calculated using Eq. 4, as follows (Lan et al., 2020):
To calculate all these parameters, the Lumerical finite difference time domain, FDTD, a software package, is used to reflect the electromagnetic wave from the proposed structure by solving Maxwell’s equations. Then,
The CO2 concentration (C) in parts per million (ppm) is highly dependent on the gas pressure (kPa) and temperature (Celsius) which can be calculated using Eq. 6 (Singh and Malarvili, 2019).
where P is the gas pressure in (kPa), T is the temperature in (0C), and
The introduced ZnO nanowall structure consists of a periodic structure honeycomb nanowall grown on the silica substrate which is grown on the top of the aluminum layer (Al layer). The Al layer is used as a metal back reflector to reflect the transmitted light back to the sensor for more absorption, where silica is a base substrate of the proposed sensor. Au nanoparticles, spherical in shape, are distributed on the nanowall to enhance the sensitivity of the CO2 sensor. The periodicity in both x and y coordinates and in the z direction is the perfectly matched layer, PML, as a boundary condition. A plane wave source with the bloch/period signal and wavelength bandwidth from 400 nm to 2,500 nm is used in the simulation. The operating wavelength is in visible and near-infrared regions. The Lumerical FDTD is an electromagnetic wave solver which is used to measure absorbed waves by the proposed structure. The proposed structure is illustrated in Figure 1.
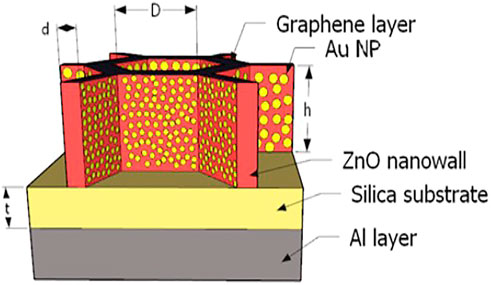
FIGURE 1. Schematic diagram of the proposed nanowall CO2 sensor.
The silica is used as a substrate with thickness, t, and h is the ZnO nanowall height, which is considered 470 nm, to be consistent with the experimental data. The nanowall thickness is s and is equal to 50 nm; however, the honeycomb edge is 70 nm in length.
The refractive index of silicon is a function of the wavelength and follows Aspnes and Studna (1983), and the refractive index of the ZnO thin film is following the proposal (Aguilar et al., 2019). On the other hand, the refractive index of the plasmonic NPs using the Drude–Lorentz model is summarized using Eq. 2. The plasma, resonance, and damping frequencies for k values are given in Table 1 (Elrashidi and Tharwat, 2021).
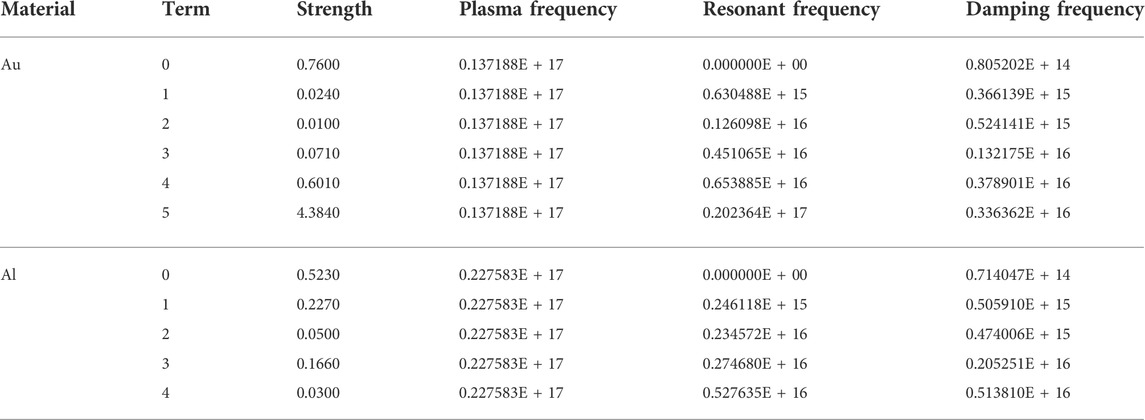
TABLE 1. Plasmonic parameters used for the metallic nanoparticles.
In this section, we will introduce the experimental fabrication process and then the simulation method analysis.
A thin layer of the ZnO nanowall network with a honeycomb structure has been grown on Si substrates. The ZnO textured layer is highly crystalline (c-direction), grown by PLD at 10 mTorr oxygen pressure and a substrate temperature of 600°C. Many parameters influence the nanostructures deposited by PLD and their quality such as the substrate to target distance, background oxygen pressure, and substrate temperature, where this experimental work was reported in El zein et al. (2014).
Figure 2 shows the scanning electron microscopic (SEM) images of zinc oxide nanowall nanostructures (ZnO NWaNs). This image shows that the two-dimensional ZnO NWaNs were grown vertically on the substrates. The pore size ranges from 50 nm to 140 nm, and the walls between the cells exhibit a thickness of ∼50 nm. The size of the nanowalls is remarkably uniform over the whole substrate. The density of the nanowalls increased with the deposition time.
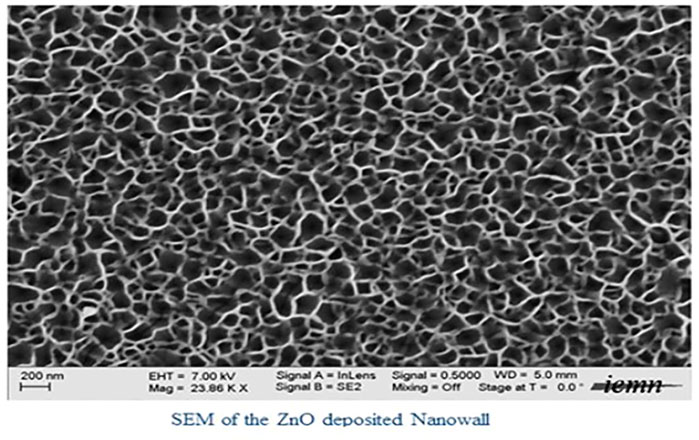
FIGURE 2. SEM image of the ZnO nanowall honeycomb structure.
The crystallography of ZnO NWaNs was further investigated by transmission electron microscopy (TEM). Figure 3 is a cross-section image of the ZnO film. The orientation can be revealed by the image. TEM results suggest single crystal ZnO NWaNs were grown with c-axis orientation with a thickness of 470 nm. Only a few crystal defects such as dislocations and stacking faults were observed. An HRTEM image shows the ZnO crystal lattice is continuous across the film. The grains were grown perpendicular to the substrates even though they were deposited on Si (100) substrates. The grain size forming the columnar structure seems to be similar to each other in the range of 90–120 nm. More results have been reported by Elrashidi and Tharwat (2021).
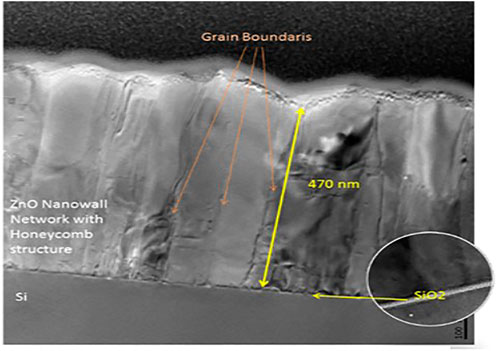
FIGURE 3. TEM images of ZnO NWaN with the honeycomb structure.
The variation of the CO2 concentration has a negligible effect on the refractive index, as reported in many research studies (Gheorghe et al., 2021); however, the metal–organic framework, MOF, is used to improve the refractive index sensitivity of the CO2 gas even with a small change of the refractive index. In this work, we used plasmonic nanoparticles, NPs, instead of using MOF to enhance the refractive index sensitivity as the absorption of the plasmonic materials depends on the refractive index of the surrounding medium, as shown in Eq. 2. However, the CO2 concentration depends on the gas pressure and temperature, following Eq. 6. Hence, the relation between gas pressure and concentration, ppm, at different temperatures, 20, 25, 30, 35, and 40°C, is illustrated in Figure 4A using Eq. 6. Figure 4A shows that the effect of changing the temperature between 20°C and 40°C is small and can be neglected. However, the effect of CO2 pressure on the dielectric constant is noticeable and shown in Figure 4B (El zein et al., 2014).
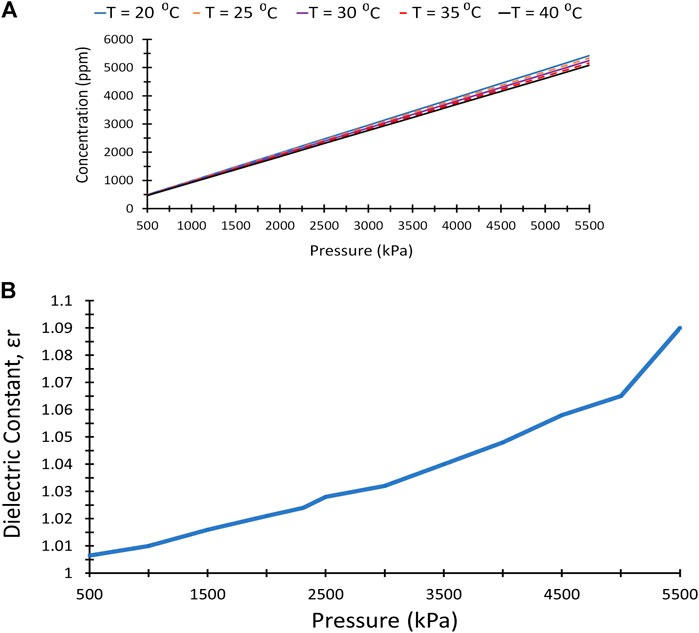
FIGURE 4. (A)Carbon dioxide pressure as a function of concentration in ppm at different temperature. (B)Carbon dioxide pressure as a function of dielectric constant.
As the gas pressure increased, the concentration increased linearly, as shown in Figure 4A, starting from CO2 pressure and concentration from pressure 500 kPa to 5,500 kPa and concentration from 477 ppm to 5,243 ppm. Moreover, the pressure has a great effect on the dielectric constant of the gas, which can be used to measure the concentration and consequently the refractive index sensitivity of the sensor. The dielectric constant is changed from 1.0065 to 1.09 at the pressure of 500 kPa to 5,500 kPa consequently, as illustrated in Figure 4B.
Figure 5 shows the monotonic increase in the concentration with a little change in the gas dielectric constant, which is extracted from Figure 4.
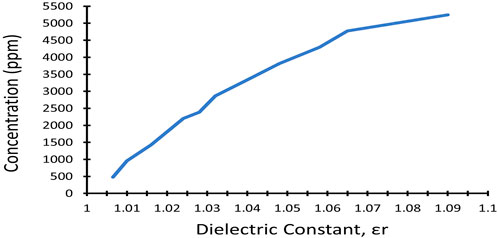
FIGURE 5. Carbon dioxide concentration as a function of the gas dielectric constant.
By using the simulation toolbox, Lumerical, we simulate different structures to calculate the absorbed light power in the UV and NIR regions. In addition, the absorbed light power of the incident light for different gas pressures is compared and analyzed in the following figures.
Figure 6 illustrates the light absorbed by 1) the nanowall structure, 2) the nanowall with a graphene layer on its top surface, and 3) the nanowall with a graphene layer with Au NPs. There is no remarkable difference in the absorbed light power in the UV region; however, the absorption has extra peaks when the graphene layer is used on the top of the nanowall, and Au NPs are distributed on the nanowall sides in the near-infrared region. As illustrated in Figure 6, the graphene layer causes sharp peaks in the absorption curve as the graphene absorption is in the range of 1,500 nm, depending on the graphene thickness and surrounding mediums (Jiang et al., 2017). In addition, the maximum absorption of Au NPs located at wavelength λmax depends on the reflective index of the surrounding medium, as given in Eq. 1. Refractive index sensitivity, FOM, and Q-factor are calculated for the three structures in Table 2 as follows, where the data are calculated at a pressure of 1,000 kPa.
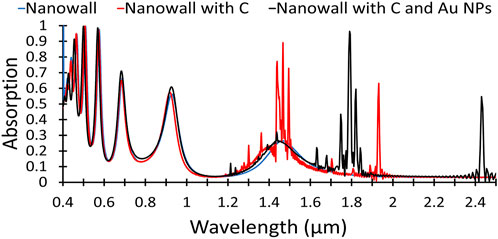
FIGURE 6. Absorption of different structures, nanowalls, with and without graphene layer, and with Au NPs.
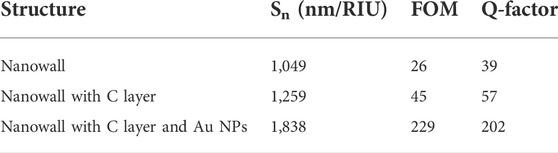
TABLE 2. Refractive index sensitivity, FOM, and Q-factor for the three proposed structures.
The sensitivity, when Au NPs distributed on the nanowall sides, is 1838 nm/RIU, while the sensitivity for the nanowall is 1,049 nm/RIU. The FOM and Q-factor are 229 and 202, respectively, and increased when Au NPs are used, as shown in Table 2.
The absorbed light energy by the proposed structure for different gas pressures, 500–5,500 kPa, is given in Figure 7 as a function of wavelength in the NIR region. There are four groups of shifting due to the change in the refractive index of CO2 at different wavelengths. Refractive sensitivity, FOM, and Q-factor of each group are compared in Table 2, to determine the best group used for sensing the concentration of CO2.
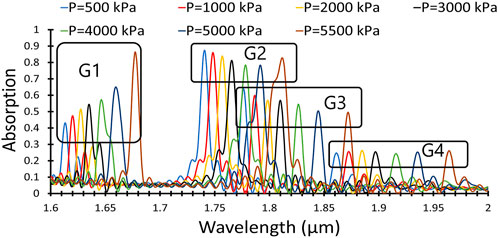
FIGURE 7. Carbon dioxide absorption at different gas pressures.
In order to distinguish between each group and determine which group has higher sensitivity, the following table has been generated for all groups. In Table 3, the gas pressure and concentration are generated using Eq. 6, for the first group, G1. The peak wavelength associated with each concentration is given in the table, and as noticed, there is a red shift in the peak. The refractive index sensitivity, Sλn, is calculated, which decreases with the increasing gas concentration to reach 874 nm/RIU at a concentration of 5,249 ppm. This phenomenon is very important to consider as we need higher sensitivity for higher concentration, so we noticed a higher change in the intensity with the changing concentration. Hence, we consider the intensity sensitivity as a selection criterion by calculating the change in the intensity of the absorbed power of the incident light to the change in the refractive index. Higher sensitivity has been obtained and reaches 5,174 Int/RIU (intensity change per reflective index unit), at the critical concentration value of 5,249 ppm. In addition, higher FOM and Q-factor are noticed at CO2 concentrations of 5,249 ppm, 12.2, and 281, respectively.

TABLE 3. CO2 pressure, concentration, peak wavelength, absorption, FWHM, RI sensitivity, intensity sensitivity, FOM, and Q-factor for the first group, G1.
Furthermore, Tables 4–6 illustrate the gas pressure, concentration, peak wavelength, absorption, FWHM, RI sensitivity, intensity sensitivity, FOM, and Q-factor for groups 2, 3, and 4.

TABLE 4. CO2 pressure, concentration, peak wavelength, absorption, FWHM, RI sensitivity, intensity sensitivity, FOM, and Q-factor for group G2.
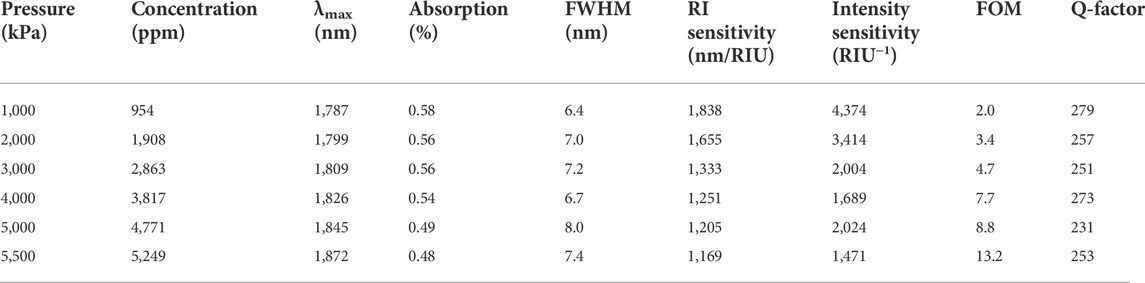
TABLE 5. CO2 pressure, concentration, peak wavelength, absorption, FWHM, RI sensitivity, intensity sensitivity, FOM, and Q-factor for group G3.

TABLE 6. CO2 pressure, concentration, peak wavelength, absorption, FWHM, RI sensitivity, intensity sensitivity, FOM, and Q-factor for group G4.
The same data are calculated for all groups; however, the obtained results are summarized in Figure 8. The proposed structure refractive index sensitivity, Sλn, for the four groups is compared and illustrated for different gas concentrations, as shown in Figure 8A. Groups 3 and 4 have high RI sensitivity, especially in the high concentration, 1,169 nm/RIU and 1,236 nm/RIU for groups 3 and 4, respectively, and for groups 1 and 2, the sensitivity is 874 nm/RIU and 869 nm/RIU, respectively. On the other hand, the intensity sensitivity for group 1 is very high and reaches 5,174 RIU−1 at a concentration of 5,249 ppm. Furthermore, the intensity absorption is very low for group 4 as the intensities are almost the same, as given in Figure 8B.
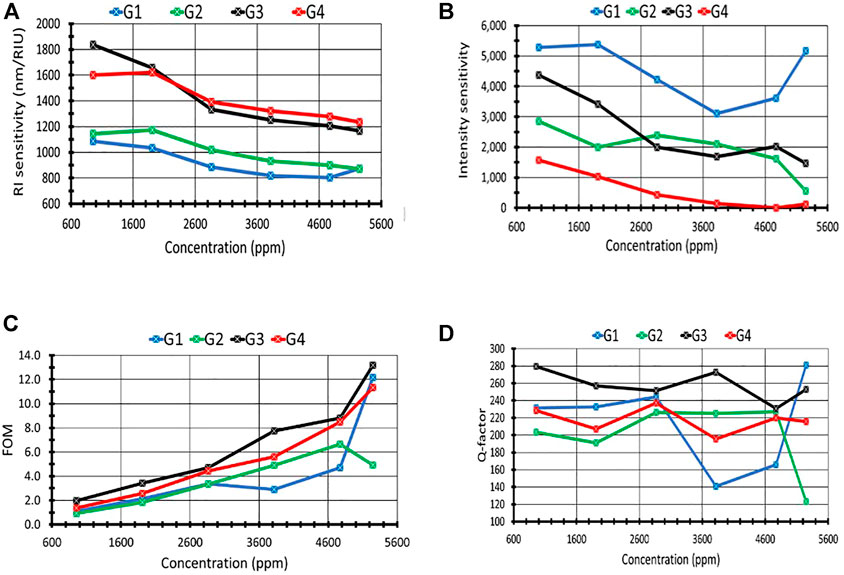
FIGURE 8. (A)Effect of concentration on the refractive index sensitivity (nm/RIU) for groups G1, G2, G3, and G4. (B) Effect of concentration on the intensity sensitivity, for groups G1, G2, G3, and G4. (C) Effect of concentration on the FOM, for groups G1, G2, G3, and G4. (D) Effect of concentration on the Q-factor, for groups G1, G2, G3, and G4.
In addition, the FOM is also calculated for all groups, where the best FOM obtained from group 3, FOM = 13.2 at concentration = 5,249 ppm, whereas group 1 gives a comparable value at the same concentration, 12.2, as illustrated in Figure 8C. Figure 8D shows the Q-factor as a function of CO2 concentration for all groups, where group 3 provides the best values except at the high concentration where group 1 gives the best value, 281.
Figure 8 shows that group 1, on average, supports the best performance using RI sensitivity, FOM, and Q-factor; however, group 3 introduced the highest intensity sensitivity and comparable FOM and Q-factor, especially at a high gas concentration.
Furthermore, the direction of the incident light is one of the main parameters that affect the absorption and consequently the gas sensitivity. The intensity of absorbed light is illustrated in Figure 9 at different polarization angles, from 0° to 80°.
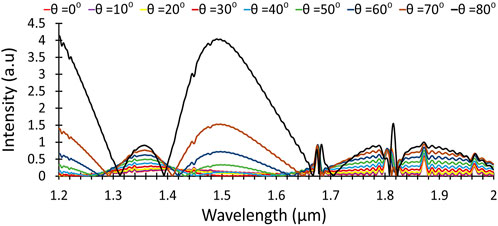
FIGURE 9. Light intensity at different incident angles.
As the polarization increased, the intensity of the absorbed light increased, which is expected for multi-reflection of the incident light on the nanowall sides. The multi-reflection leads to improving light absorption by the Au NPs distributed on the nanowall sides without any shifting in the peak wavelength. However, the intensity of the absorbed light is less than 0.4 a.u at the normal light incident, 10°, with respect to 4.0 a.u at an incident angle of 80°, where the proposed device can be used as a perfect absorber in the near-infrared region.
Table 7 illustrates a comparison between the proposed sensor and some related CO2 sensors, which use the refractive index change measuring technique. The proposed nanosensor structure gives the highest sensitivity, 5 m 175 RIU−1, in a wide sensing range, 0–5,000 ppm.
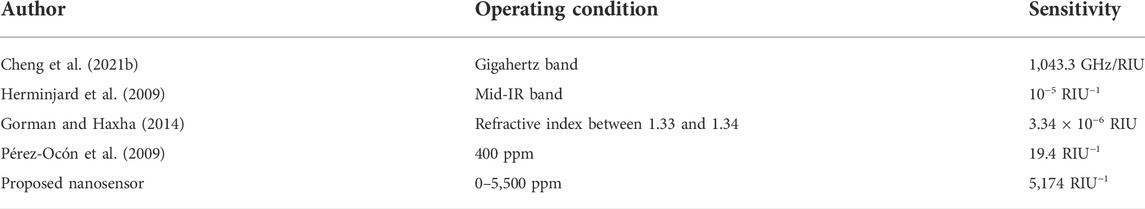
TABLE 7. Comparison between the proposed sensor and some related CO2 sensors used in the refractive index technique.
A highly sensitive ZnO honeycomb nanowall with different plasmonic nanoparticles was investigated, where the fabrication of the ZnO honeycomb nanowall is performed by using the PLD technique. The proposed structure is then simulated using the FDTD method when the nanowalls are covered by a graphene layer and Au NPs are distributed on the nanowall sides. Also, the effect of CO2 pressure on the gas concentration on the dielectric constant is presented in this work. Furthermore, the peaks shifting in the light absorption due to changing the refractive index of the surrounding gas are also simulated, which leads to four different groups of shifting. The maximum obtained RI sensitivity is 874 nm/RIU, and the intensity sensitivity is 5174 RIU−1 from group 1, and the FOM and Q-factors are 12.5 and 281, respectively. In addition, the effect of changing the polarization on light absorption is also introduced in this article.
The original contributions presented in the study are included in the article/Supplementary Material; further inquiries can be directed to the corresponding author.
Conceptualization, BE and AE; methodology, BE and AE; software, AE; validation, ET; formal analysis, BE; investigation, ET; writing—original draft preparation, AE; writing—review and editing, BE; supervision, ET.
The authors declare that the research was conducted in the absence of any commercial or financial relationships that could be construed as a potential conflict of interest.
All claims expressed in this article are solely those of the authors and do not necessarily represent those of their affiliated organizations, or those of the publisher, the editors, and the reviewers. Any product that may be evaluated in this article, or claim that may be made by its manufacturer, is not guaranteed or endorsed by the publisher.
Aguilar, O., De Castro, S., Godoy, M., and Dias, M. (2019). Optoelectronic characterization of Zn1-xCdxO thin films as an alternative to photonic crystals in organic solar cells. Opt. Mat. Express 9, 3638–3648. doi:10.1364/ome.9.003638
Amoosoltani, N., Zarifkar, A., and Farmani, A. (2019). Particle swarm optimization and finite-difference time-domain (PSO/FDTD) algorithms for a surface plasmon resonance-based gas sensor. J. Comput. Electron. 18, 1354–1364. doi:10.1007/s10825-019-01391-7
Aspnes, D., and Studna, A. (1983). Dielectric functions and optical parameters of Si, Ge, GaP, GaAs, GaSb, InP, InAs, and InSb from 1.5 to 6.0 eV. Phys. Rev. B 27, 985–1009. doi:10.1103/physrevb.27.985
Baruah, S., Maibam, B., and Kumar, S. (2019). Zinc oxide: A novel material for biosensors (A review). Imperial J. Interdiscip. Res. 3 (3), 1466–1479.
Batzill, M., and Diebold, U. (2005). The surface and materials science of tin oxide. Prog. Surf. Sci. 79 (2-4), 47–154. doi:10.1016/j.progsurf.2005.09.002
Chaudhary, D., Nayse, S., and Waghmare, L. (2011). Application of wireless sensor networks for greenhouse parameter control in precision agriculture. Intl. J. Wirel. Mob. Netw. 3 (1), 140–149. doi:10.5121/ijwmn.2011.3113
Chen, C., Kim, J., and Ahn, W. (2014). CO2 capture by amine-functionalized nanoporous materials: A review. Korean J. Chem. Eng. 31, 1919–1934. doi:10.1007/s11814-014-0257-2
Chen, F., Cheng, Y., and Luo, H. (2020). A broadband tunable terahertz metamaterial absorber based on single-layer complementary gammadion-shaped graphene. Materials 13 (4), 860. doi:10.3390/ma13040860
Cheng, Y., Chen, F., and Luo, H. (2020a). Triple-band perfect light absorber based on hybrid metasurface for sensing application. Nanoscale Res. Lett. 15 (103). doi:10.1186/s11671-020-03332-x
Cheng, Y., Zhao, H., and Li, C. (2020b). Broadband tunable terahertz metasurface absorber based on complementary-wheel-shaped graphene. Opt. Mater. 109, 110369. doi:10.1016/j.optmat.2020.110369
Cheng, Y., Chen, F., and Luo, H. (2021a). Plasmonic chiral metasurface absorber based on bilayer fourfold twisted semicircle nanostructure at optical frequency. Nanoscale Res. Lett. 16 (12). doi:10.1186/s11671-021-03474-6
Cheng, Y., Li, Z., and Cheng, Z. (2021b). Terahertz perfect absorber based on InSb metasurface for both temperature and refractive index sensing. Opt. Mater. 117, 111129. doi:10.1016/j.optmat.2021.111129
Cheng, Y., Liu, J., Chen, F., Luo, H., and Li, X. (2021c). Optically switchable broadband metasurface absorber based on square ring shaped photoconductive silicon for terahertz waves. Phys. Lett. A 402, 127345. doi:10.1016/j.physleta.2021.127345
Chung, T., Lee, S., Song, E., Chun, H., and Lee, B. (2011). Plasmonic nanostructures for nano-scale bio-sensing. Sensors 11, 10907–10929. doi:10.3390/s111110907
Dinh, T., Choi, I., Son, Y., and Kim, J. (2016). A review on non-dispersive infrared gas sensors: Improvement of sensor detection limit and interference correction. Sensors Actuators B Chem. 231, 529–538. doi:10.1016/j.snb.2016.03.040
El Zein, B., Yao, Y., Dogheche, E., Boulfrad, S., and Jabbour, G. (2013). Nanometer sized structures grown by pulsed laser deposition. Patent number: US20150280017A1, United States.
El Zein, B., Boulfrad, S., Jabbour, G., and Dogheche, E. (2014). Parametric study of self-forming ZnO Nanowall network with honeycomb structure by Pulsed Laser Deposition. Appl. Surf. Sci. 292, 598–607. doi:10.1016/j.apsusc.2013.12.014
Elrashidi, A., and Tharwat, M. (2021). Broadband absorber using ultra-thin plasmonic metamaterials nanostructure in the visible and near-infrared regions. Opt. Quantum Electron. 53, 426. doi:10.1007/s11082-021-03089-2
Elrashidi, A. (2016). Investigating the performance of ultra-sensitive optical sensor using plasmonic nanoparticles. Nanosci. Nanotechnol. Lett. 8, 465–470. doi:10.1166/nnl.2016.2031
Elrashidi, A. (2020a). High performance molecular detection biosensor using plasmonic spiral nanoantenna based on optical fiber. J. Biomed. Nanotechnol. 16, 715–720. doi:10.1166/jbn.2020.2902
Elrashidi, A. (2020b). Highly sensitive silicon nitride biomedical sensor using plasmonic grating and ZnO layer. Mat. Res. Express 7, 075001. doi:10.1088/2053-1591/ab9ee0
Farmani, A. (2019). Three-dimensional FDTD analysis of a nanostructured plasmonic sensor in the near-infrared range. J. Opt. Soc. Am. B 36, 401–407. doi:10.1364/josab.36.000401
Fermani, H., and Fermani, A. (2020). Graphene sensing nanostructure for exact graphene layers identification at terahertz frequency. Phys. E Low-dimensional Syst. Nanostructures 124, 114375. doi:10.1016/j.physe.2020.114375
Folke, M., Cernerud, L., Ekström, M., and Hök, B. (2003). Critical review of non-invasive respiratory monitoring in medical care. Med. Biol. Eng. Comput. 41 (4), 377–383. doi:10.1007/bf02348078
Gheorghe, A., Lugier, O., Ye, B., and Tanase, S. (2021). Metal–organic framework based systems for CO2 sensing. J. Mat. Chem. C Mat. 9, 16132–16142. doi:10.1039/d1tc02249k
Gorman, T., and Haxha, S. (2014). Design and optimisation of integrated hybrid surface plasmon biosensor. Opt. Commun. 325, 175–178. doi:10.1016/j.optcom.2014.03.081
Herminjard, S., Sirigu, L., Herzig, H., Studemann, E., Crottini, A., Pellaux, J., et al. (2009). Surface plasmon resonance sensor showing enhanced sensitivity for CO2 detection in the mid-infrared range. Opt. Express 5, 293–303. doi:10.1364/oe.17.000293
Jiang, X., Wang, T., Xiao, S., Yan, X., and Cheng, L. (2017). Tunable ultra-high-efficiency light absorption of monolayer graphene using critical coupling with guided resonance. Opt. Express 25 (22), 27028–27036. doi:10.1364/oe.25.027028
Korotcenkov, G. (2007). Metal oxides for solid-state gas sensor: what determines our choice? Material Sci. Eng. B 139 (1), 1–23. doi:10.1016/j.mseb.2007.01.044
Kretschmann, E., and Raether, H. (2014). Notizen: Radiative decay of non radiative surface plasmons excited by light. Z. für Naturforsch. A 23A, 2135–2136. doi:10.1515/zna-1968-1247
Kwon, J., Ahn, G., Kim, G., Kim, J., and Kim, H. (2009). “A study on NDIR-based CO2 sensor to apply remote air quality monitoring system,” in Iccas-Sice (IEEE, 2009), Japan, 18-21 Aug. 2009, 1683–1687.
Lan, G., Jin, Z., Nong, J., Luo, P., Guo, C., Sang, Z., et al. (2020). Narrowband perfect absorber based on dielectric metal meta-surface for surface-enhanced infrared sensing. Appl. Sci. 10 (7), 2295–2312. doi:10.3390/app10072295
Liu, X., Cheng, S., Liu, H., Hu, S., Zhang, D., and Ning, H. (2012). A survey on gas sensing Technology. Sensors 12 (7), 9635–9665. doi:10.3390/s120709635
Mbomson, I., Tabor, S., Lahiri, B., Sharp, G., Mcmeekin, S., Rue, R., et al. (2017). Asymmetric split H-shape nanoantennas for molecular sensing. Biomed. Opt. Express 8 (1), 395–412. doi:10.1364/boe.8.000395
McDonagh, C., Burke, C., and MacCraith, B. (2008). Optical chemical sensors. Chem. Rev. 108 (2), 400–422. doi:10.1021/cr068102g
Mi, J., Horvath, C., Aktary, M., and Van, V. (2016). Silicon microring refractometric sensor for atmospheric CO2 gas monitoring. Opt. Express 25, 1773–1780. doi:10.1364/oe.24.001773
Mitra, C. (2018). Infrared spectroscopy – principles, advances, and applications. Vienna: IntechOpen, 5–12.
Mulrooney, J., Clifford, J., Fitzpatrick, C., and Lewis, E. (2007). Detection of carbon dioxide emissions from a diesel engine using a mid-infrared optical fibre based sensor. Sensors Actuators A Phys. 136 (1), 104–110. doi:10.1016/j.sna.2006.11.016
Neethirajan, S., Jayas, D., and Sadistap, S. (2009). Carbon dioxide (CO2) sensors for the agri-food industry—a review. Food bioproc. Tech. 2 (2), 115–121. doi:10.1007/s11947-008-0154-y
Nuryadi, R., Mayasari, R. D., Aprilia, L., and Yuliarto, B. (2015). “Fabrication of ZnO/Au/prism-based surface plasmon resonance device for gas detection,” in International Conference on Quality in Research (QiR), Lombok, Indonesia, 10–13 August 2015.
O’Veill, B., Dalton, M., Duchs, R., Jiang, L., Pachauri, S., and Zigova, K. (2010). Global demographic trends and future carbon emissions. Proc. Natl. Acad. Sci. U. S. A. 107 (41), 17521–17526. doi:10.1073/pnas.1004581107
Pérez-Ocón, F., Pozo, A., Cortina, J., and Rabaza, O. (2021). Surface plasmon resonance sensor of CO2 for indoors and outdoors. Appl. Sci. 11, 6869. doi:10.3390/app11156869
Pfeiffer, T., Summerfelt, S., and Watten, B. (2011). Comparative performance of CO2 measuring methods: Marine aquaculture recirculation system application. Aquac. Eng. 44 (1), 1–9. doi:10.1016/j.aquaeng.2010.10.001
Semwal, V., and Gupta, B. (2019). LSPR- and SPR-based fiber-optic cholesterol sensor using immobilization of cholesterol oxidase over silver nanoparticles coated graphene oxide nanosheets. IEEE Sens. J. 18, 1039–1046. doi:10.1109/jsen.2017.2779519
Shiryaev, M., Eremin, S., and Baranov, A. (2014). Structure of the receptor layer in electrochemical immunosensors. Modern trends and prospects of development. Nanotechnologies Russ. 9, 3–4. doi:10.1134/S1995078014020153
Singh, O., and Malarvili, M. (2019). “Effect of temperature, pressure and humidity on carbon dioxide concentration—simulation study,” in Sustainable and Integrated Engineering International Conference 2019 (SIE 2019), Putrajaya, Malaysia, 9-10 Dec., 2019.
Tharwat, M., Attia, M., Alghamdi, M., and Mahros, A. (2017). Ultra-sensitive nano optical sensor samarium-doxycycline doped in sol gel matrix for assessment of glucose oxidase activity in diabetics disease. J. Fluoresc. 27, 1885–1895. doi:10.1007/s10895-017-2127-x
Vogler, D., and Sigrist, D. (2006). Near-infrared laser based cavity ringdown spectroscopy for applications in petrochemical industry. Appl. Phys. B 85, 349–354. doi:10.1007/s00340-006-2313-z
Wang, H., Wang, J., Ma, X., Chen, W., Chen, D., and Li, Q. (2017). Note: A NDIR instrument for multicomponent gas detection using the galvanometer modulation. Rev. Sci. Instrum. 88, 116103. doi:10.1063/1.5000085
Wang, Z. (2009). ZnO nanowire and nanobelt platform for nanotechnology. Mater. Sci. Eng. R Rep. 64 (3-4), 33–71. doi:10.1016/j.mser.2009.02.001
Zhang, H., Cheng, Y., and Chen, F. (2021). Quad-band plasmonic perfect absorber using all-metal nanostructure metasurface for refractive index sensing. Optik 229, 166300. doi:10.1016/j.ijleo.2021.166300
Zhao, L., Zhang, R., Zhang, J., and Sun, S. (2012). Synthesis and characterization of biocompatible ZnO nanoparticles. CrystEngComm 14, 945–950. doi:10.1039/c1ce05621b
Keywords: CO2 nanosensor, FDTD, nanowall honeycomb structure, PLD, plasmonic Au NPs, near-infrared region
Citation: Elrashidi A, Traversa E and Elzein B (2022) Highly sensitive ultra-thin optical CO2 gas sensors using nanowall honeycomb structure and plasmonic nanoparticles. Front. Energy Res. 10:909950. doi: 10.3389/fenrg.2022.909950
Received: 31 March 2022; Accepted: 22 September 2022;
Published: 13 October 2022.
Edited by:
Amr Abdel-Fattah, Saudi Aramco, Saudi ArabiaReviewed by:
Khalid Nouneh, Ibn Tofail University, MoroccoCopyright © 2022 Elrashidi, Traversa and Elzein. This is an open-access article distributed under the terms of the Creative Commons Attribution License (CC BY). The use, distribution or reproduction in other forums is permitted, provided the original author(s) and the copyright owner(s) are credited and that the original publication in this journal is cited, in accordance with accepted academic practice. No use, distribution or reproduction is permitted which does not comply with these terms.
*Correspondence: Ali Elrashidi, YWxpcmFzaGVkeUBnbWFpbC5jb20=; Basma Elzein, YmFzbWFAaWVlZS5vcmc=
Disclaimer: All claims expressed in this article are solely those of the authors and do not necessarily represent those of their affiliated organizations, or those of the publisher, the editors and the reviewers. Any product that may be evaluated in this article or claim that may be made by its manufacturer is not guaranteed or endorsed by the publisher.
Research integrity at Frontiers
Learn more about the work of our research integrity team to safeguard the quality of each article we publish.