 Tianfeng Chu1,2
 Yu Xie
 Gang Liu
- 1College of Information Science and Engineering, Northeastern University, Shenyang, China
- 2Electric Power Research Institute of State Grid Liaoning Electric Power, Shenyang, China
- 3The State Grid Liaoning Electric Power, Shenyang, China
- 4Northeast Electric Power University, Jilin, China
With the large-scale renewable energy access to the power system, the voltage source converters (VSCs) in the system are gradually increasing. The system inertia is weakened, which leads to the decrease in frequency supportability and affects the stability of the power system. After adopting active support control, VSC-based renewable energy units have inertia supportability similar to traditional synchronous generators (SGs), which can improve the frequency stability of the power system. This article is intended to the control strategy based on active support of renewable energy. Small-signal stability of a two-zone system with different control strategies for VSCs under different conditions is analyzed. At the same time, the dynamic adjustment effect of different parameters on active support control is considered, and frequency stability of a two-zone system with inertial flexible control is improved. In this article, the basic principle of active support control is expounded in detail. Compared with PQ-control and droop-control, it is verified that active support control has good frequency supportability. The small-signal model of VSCs for active support and two-machine system is established. Combined with the simulation system, the influence of virtual inertia and damping coefficient on system stability is verified.
1 Introduction
Modern power grids are being penetrated by various renewable energy sources, which are integrated into the power grid through various converters (Fan et al., 2019). This also promotes the development of renewable energy grid-connected technologies. The power system with a high proportion of renewable energy may cause multiple power outages due to weakness of the inertia support capacity (Nikkhajoei and Lasseter, 2009). For power grids with large load demand and high proportion of renewable energy generation, significant frequency evens may happen, such as the “8.9” blackout in the United Kingdom and the “9.28” South Australia blackout (Chen et al., 2020). One of the important causes is that the high proportion of renewable energy and DC transmission leads to a decrease in system inertia damping. Therefore, scientifically measuring and effectively improving the anti-interference ability of the power grid with a high proportion of renewable energy have become an important issue that needs to be concerned in power grid planning and dispatching operation (Wang et al., 2020; Wu et al., 2019; Kayikci and Milanovic, 2009; Li et al., 2015). However, renewable energies such as photovoltaic and wind power (DC power generation) are generally connected to the grid via inverters. Due to the influence of of voltage and frequency is very weak. Consequently, they are basically not involved in the voltage and frequency regulation of the power system. Therefore, higher requirements are put forward for SGs. Given that the installed capacity of photovoltaic and wind power in the power system is surging, together with the installed proportion of SGs such as thermal power generation, water power generation, and nuclear power is decreasing year by year, the regulation task of SGs aggravates sharply, and the system stability decreases gradually.
At present, the active support control is mainly based on the virtual synchronous generator (VSG) control (Li et al., 2017b; Li et al., 2020). The most common active support control simulates the rotor motion equation of SGs, and the active power is coupled with the frequency change rate. This structure is also used in this article. VSG has gradually become a research hotspot since the concept was first proposed by the Lawskatar University of Technology, Germany (Zhong and Weiss, 2011; Li et al., 2022a; Shu et al., 2018). Around this technology, extensive studies have been carried out, and fruitful results have been achieved in the improvement of the control strategy, the optimization and setting of the parameters, the stability analysis, and the multi-generator parallel synergistic equivalence. Moreover, combined with the ontology control of specific renewable energy units, the active support control is used to connect wind turbines and the photovoltaic to the grid (Zhang et al., 2020; Hou et al., 2019; Yuan et al., 2017; Li et al., 2022b; Liu et al., 2017; Li et al. 2017a). A prior work proposed a renewable frequency control strategy, including virtual inertia control based on VSGs, which simulates the behavior of conventional SGs in large power systems and virtually adds some inertia to the system control loop (Gaber et al., 2019). A statistical model that can estimate the system inertia in real-time through observed steady-state and relatively small frequency changes has been proposed by Cao et al. (2016), but it lacks the possibility of implementation. The virtual inertia control of a doubly-fed wind turbine was used in the reference (Ma et al., 2017), through the phase-locked loop virtual inertia participation system to influence the system damping, and did not abandon the traditional phase-locked loop. According to the frequency rate of change in stages of inertia and damping coefficient adaptive control, the reference proposed a piecewise adaptive inertia and damping control method based on the power difference as the calculation parameter, in order to improve the power distribution state (Song et al., 2017). However, the introduction of piecewise analysis adds to the system complexity. A complete small-signal model of a multi-inverter parallel system with classical droop control and power differential droop control has been established but without considering the influence of damping (Xu et al., 2017). In addition, an SG simulation model of a wind turbine during rotor motion to evaluate transient stability has been proposed but did not discuss transient stability in detail (Tang et al., 2018).
This article focuses on the small-signal stability analysis of active support for renewable energy. By the active support control strategy, the renewable energy units will have the inertia support characteristics similar to the traditional SGs and can participate in the system frequency regulation. Meanwhile, since the inertia H and damping D of the renewable energy unit can be changed, the inertia of each unit can be flexibly set according to the actual demand of the dynamic response in each region. Combined with the characteristics of the network inertia center, the anti-disturbance ability of the network can be further improved. The control strategy design and small-signal analysis of active support control for VSC are described in detail in this article. Based on the topology of the three-phase VSC inverter, the basic principle of active support control is introduced, and the frequency supportability of PQ-control and droop-control is compared. The small-signal model of active support control for VSC is established, and then the small-signal analysis is carried out by transfer function. Furthermore, the influence of each parameter on the stability of the system is verified by simulation results. The small-signal model of active support control based on a two-machine system is established. Similarly, the small-signal analysis is carried out through the transfer function, and the influence of each parameter on the stability of the system is verified by simulation as well.
2 Basic Principles of Three Control Modes
VSC has a variety of power control strategies, such as PQ-control, droop-control, and active support control. Different strategies are used for control, and the corresponding effect and grid-connected stability are quite different. It is significant for grid-connected inverters to select appropriate control methods in this research.
2.1 PQ-Control
PQ-control is to adjust the power difference by proportional–integral controller (PI), and then the desired power can be obtained through the current loop control by using pulse width modulation (PWM). For PQ-control, the controlled power is directly changed into the dq-axis of the current, and the inverter becomes the current source control. Therefore, when the inverter runs in the microgrid, it does not have the supportability of voltage and frequency. The power generation system of renewable energy (such as wind power and photovoltaic power generation) is out of the front-end power generation equipment, and the back-end inverter is basically controlled by PQ-control. Therefore, the renewable energy needs to operate in a large power grid with strong voltage inertia support. The basic expression of PQ-control active power is given in (1):
The control strategy diagram of PQ-control is given in Figure 1.
2.2 Droop-Control
In droop-control, the power difference is changed into frequency change, then into angle change, and then into current loop control through Park transformation. It is characterized by the sagging curve between active power and frequency and reactive power and voltage. Changing active power and reactive power will change the frequency and voltage of the controller accordingly, which is similar to the process of the primary frequency regulation and voltage regulation for SGs. Therefore, compared with PQ-control, droop-control will have a certain support capability of frequency and voltage. It can be adopted in a microgrid or low inertia system with fewer SGs.
The basic expression of active frequency for droop-control is determined as follows:
where Pm is the mechanical power, Pe is the electromagnetic power, Δω is the unit value, representing the generator angular frequency, and K is the droop coefficient. It can be seen that the droop coefficient is the only variable that affects the relationship between active power and frequency. Changing the droop coefficient will regulate the frequency stability of the system.
The control strategy diagram of droop-control is given in Figure 2.

FIGURE 1. Control strategy diagram of PQ-control.
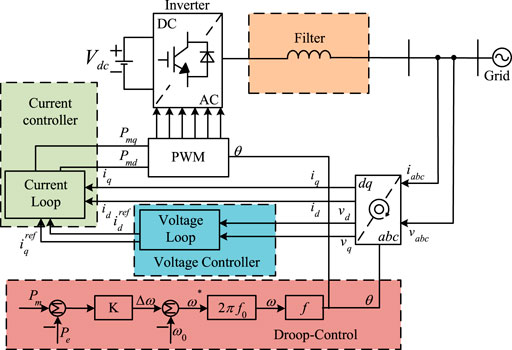
FIGURE 2. Control block diagram of droop-control.
2.3 Active Support Control
The SG has good grid-connected stability and supportability. Although the droop-control has some characteristics of the SG and has a certain supportability of frequency and voltage, it still cannot fully simulate the external characteristics of the SG. In contrast, the inverter with active support control can greatly simulate the characteristics of the traditional SG, and then, the grid will have the ability of active support, raising the stability and robustness of the whole system.
The relationship between rotor inertia and frequency is analyzed by the second-order SG model. The basic expression of active frequency for active support control is shown by the following expression:
where Pm is mechanical power, Pe is electromagnetic power, ω is generator angular frequency, H is the inertial constant, D is the damping coefficient, and θ is the generator electrical angle.
In this article, the active support control does not consider the reactive voltage loop control, so a desired port voltage is directly given. Moreover, only the active frequency response characteristics are analyzed. The control frame is shown in Figure 3.
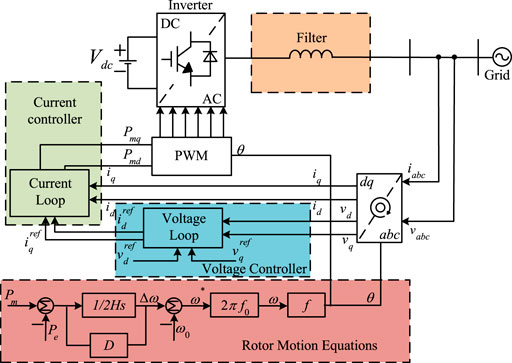
FIGURE 3. Active support control block diagram.
It can be seen from Figure 3 that the active support control is actually similar to the improved droop-control, which not only has the active frequency droop characteristics in the droop-control but also can simulate the process of active frequency change in the rotor motion of the SG more accurately. Therefore, the active support control of the inverter will also have good grid-connected stability and supportability.
The active support control simulates the rotor motion equation of the SG and generates a self-controlled rotor angle to avoid the influence of the network strength and phase-locking accuracy caused by the phase-locked loop (PLL). The inverter adopts active support control because of the flexibility of the parameters. Compared with the traditional SG, it will realize the adjustability of inertia, which plays an important role in realizing the inertia support of renewable energy.
In order to compare the frequency response of VSC under different control strategies, the connected load is combined with an SG. The change of frequency when the load suddenly increases at a certain time is simulated. The reference power and voltage of SG are set to 100 MVA and 20 kV, respectively. The reference power and voltage of the inverter are set to 200 MVA and 20 kV, respectively.
Figure 4 shows the frequency response of the inverter with different control strategies under the same output. Figure 5 shows the active power output of the inverter with different control strategies under the same output. When t = 2 s, the load increases by 10%. It can be seen from the graph that PQ-control does not undergo frequency change. Therefore, after the load surges, the frequency drops rapidly and its amplitude also changes substantially, and frequency change is not affected by parameters. Due to the active frequency link, the frequency change of droop-control is significantly better than that of PQ-control. The frequency response can be adjusted by changing the droop coefficient.
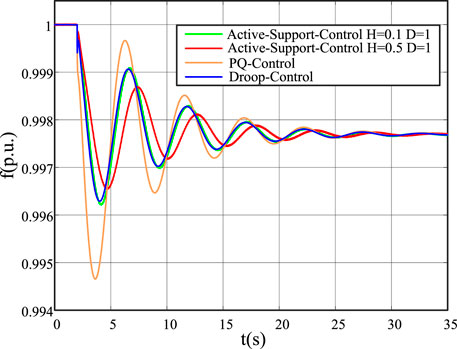
FIGURE 4. Frequency response of different control strategies.
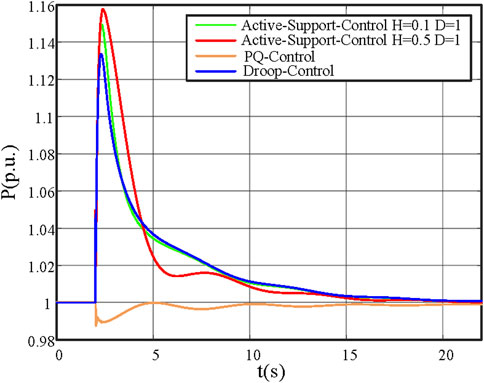
FIGURE 5. Active power output of different control strategies.
The active support control provides inertia support, so the change of power does not immediately map to the change of frequency. Comparing the frequency response curve of droop-control and active support control (H = 0.1, D = 1) under the same disturbance, the frequency change of active support control is slower than that of droop-control.
It can also be seen from Figure 5 that compared with PQ-control, the active power output of droop-control and active support control at the moment of disturbance is significantly high, which also confirms that PQ-control has no frequency support characteristics. The active power of active support control is higher than that of PQ-control, which indicates that the frequency support capability of active support control is better than that of PQ-control. Therefore, when the system is disturbed, the active support control has a buffer process, which is more conducive to improving the system frequency stability.
When the virtual inertia of active support control is further improved, the frequency drop is further reduced, the drop speed is further slowed down, the active power output is further increased, and the frequency support capability is further enhanced.
3 Small-Signal Model and Stability Analysis of Voltage Source Converters for Active Support
The active support control simulates the rotor motion equation of a synchronous generator, produces a self-controlled rotor angle, avoids the influence of network strength and phase-locking accuracy brought by using PLL, and achieves the effect of active support. When the VSC for active support is incorporated into the infinite system, the voltage and power angle of VSC components will be in a dynamic change process, so its state equation needs to be listed. Ignoring the influence of inverter component characteristics, the DC side power supply adopts energy storage infinite power supply.
Due to the large installed capacity of an infinite system, its characteristics are similar to an ideal voltage source. This means the internal resistance is very small, and the external voltage characteristics remain basically unchanged. Moreover, when a small-signal or large disturbance occurs in the external environment, the power angle and frequency of the infinite system are not affected. Therefore, its voltage and frequency do not require column state equations.
3.1 Small-Signal Model of VSC for Active Support
The grid-connected system of VSC for active support is composed of VSC and an infinite system in series through line impedance. The equivalent circuit is shown in Figure 6.
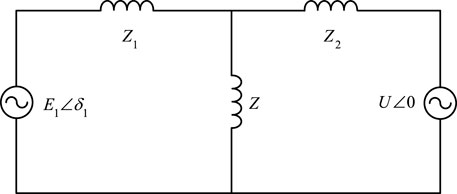
FIGURE 6. Equivalent circuit of active support VSC.
In Figure 6, Z1 and Z2 are characteristic lines with the same line impedance and same length.
By delta-star transformation, Figure 6 can be converted into Figure 7.
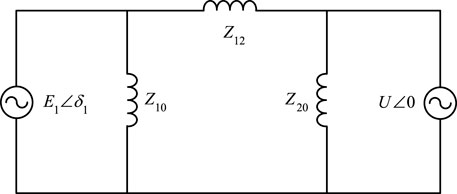
FIGURE 7. Equivalent circuit of actively supported VSC after conversion.
The conversion relationship of each component after equivalent transformation is given as follows:
According to Figure 7, the small-signal equation can be listed as follows.
According to (8), the characteristic equation can be solved as (10):
The system line parameters are shown in Table 1. Substituting Table 1 into (4) and (10) yields (11).
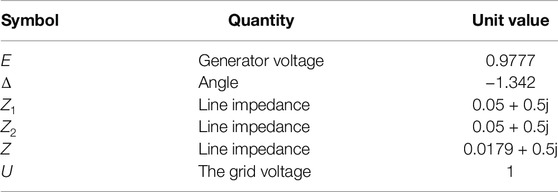
TABLE 1. System line parameters.
According to (11), the characteristic roots of the state equation are mainly affected by the virtual inertia H and damping D. The two parameters have different effects on the stability of the system with different values. The small-signal analysis of (11) under different parameters is carried out. The results are shown in Figure 8.
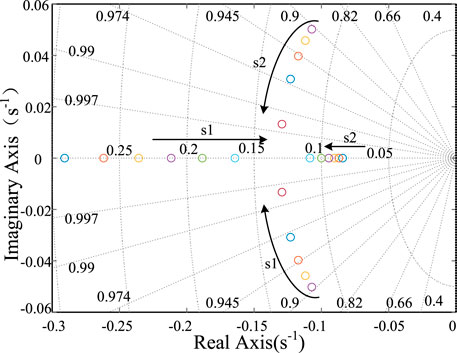
FIGURE 8. Trajectories of characteristic roots for H from 40 to 70 at D = 30.
In Figure 8, s1 and s2 are the dominant characteristic roots, and the direction indicated by the arrow is their variation trend. H gradually increases along the direction indicated by the arrow. In the initial state, the characteristic root of the system is negative. With the increase of H, s1 and s2 gradually transit to the imaginary axis, which indicates that the system stability decreases.
In Figure 9, s1 and s2 gradually increase along the direction D indicated by the arrow. In the initial state, the characteristic root of the system is a virtual value. With the increase of D, s1 and s2 gradually transit to the negative real-axis, so the system stability is improved.
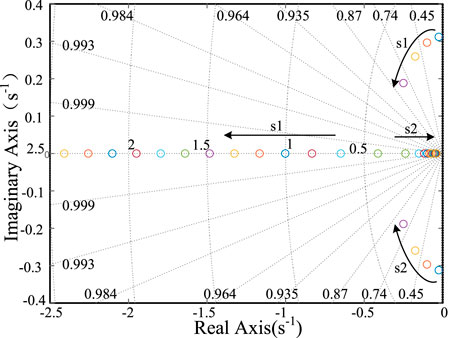
FIGURE 9. Trajectories of characteristic roots for D from 1 to 50 at H = 30.
3.2 Experimental Verification
The system in Section 3 is used for analysis. The reference power and voltage of SG are set at 100 MVA and 20 kV, and the inverter is set at 200 MVA and 20 kV, respectively. When t = 2 s, the load increases by 10%.
In active support control, both the virtual inertia constant H and damping coefficient D can affect inverter frequency response. The virtual inertia constant mainly affects the speed of system frequency fluctuation. Increasing the virtual inertia constant can slow down the frequency change and reduce the fluctuation amplitude. The damping coefficient D affects the amplitude of frequency fluctuation of the system. By increasing the damping coefficient, the amplitude of frequency drop will decrease.
As shown in Figure 10, when the virtual inertia constant H increases from 5 to 15, the drop rate of frequency slows down. Furthermore, the frequency drop amplitude decreases and slowly attenuates to a stable value. As shown in Figure 11, when D increases from 30 to 40, the frequency drop amplitude decreases and slowly approaches the steady-state value.
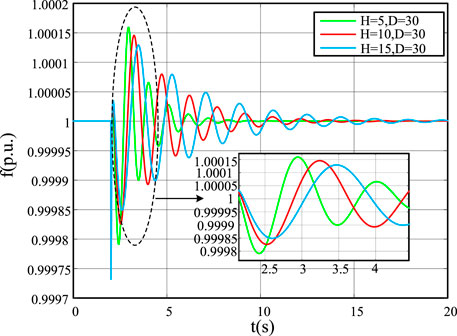
FIGURE 10. Frequency of the grid-connected inverter when virtual inertia time constant changes.
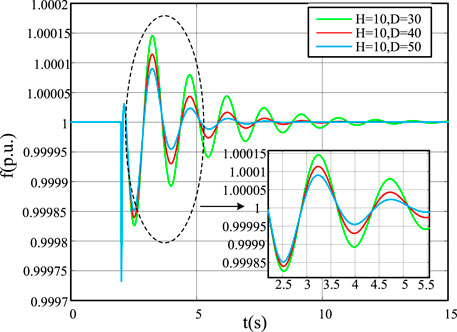
FIGURE 11. Frequency of the inverter with varying damping coefficients under grid connection.
4 Small-Signal Model and Stability Analysis of VSC for the Actively Supported Two-Machine System
When the active support VSC is connected to an SG, the voltage and power angle of the VSC component will be in a dynamic change process, so its state equation needs to be listed. Ignoring the influence of inverter component characteristics, the DC side power supply adopts energy storage type infinite power supply.
Similarly, when the external environment occurs in small-signal or large disturbance events, the voltage and frequency of SG will also change dynamically, which also needs to list its state equation. Moreover, the SG considers the excitation and speed regulation system. Therefore, compared with the grid-connected system containing VSC for active support, the state matrix order of the whole system increases, and the dynamic adjustment process is much complex.
4.1 Small-Signal Model of Two-Machine System Containing Voltage Source Converters for Active Support
The grid-connected system about VSC for active support is composed of VSC and an SG with equal capacity connected in series through line impedance. The equivalent circuit is shown in Figure 12.
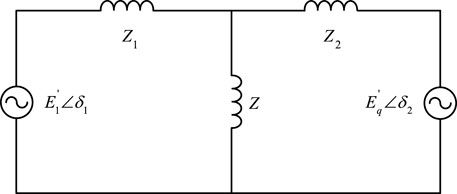
FIGURE 12. Equivalent circuit of the actively support VSC two-machine system.
In Figure 12, Z1 and Z2 are characteristic lines with the same line impedance and same length.
By using star triangle transformation, Figure 12 can be converted into Figure 13.
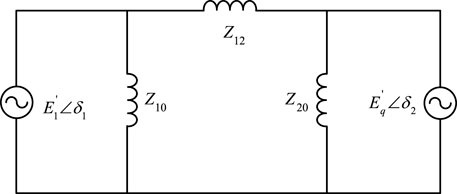
FIGURE 13. Equivalent circuit of the active support VSC two-machine system after conversion.
In Figure 13 the conversion relationship of each component after equivalent transformation is as follows (4): he active power of the two-machine system satisfies as (12) and (13):
Considering the speed regulation and excitation system of SG, the SG needs to adopt the classical three-order model with Eq. The model equation is shown in (14):
A simplified model of the excitation system with automatic regulation is given as (17):
The simplified model considering only prime mover governor in the speed control system is given as (18):
The small-signal equation of VSC is given as follows:
The small-signal equation of SG is defined in (21):
The state equation matrix based on (19) and (20) can be obtained as follows:
Assuming that the amplitude of SG’s port voltage
The system line parameters are shown in Table 2. The SG parameters are shown in Table 3. Substituting Tables 2, 3 into (27), (34) is obtained:
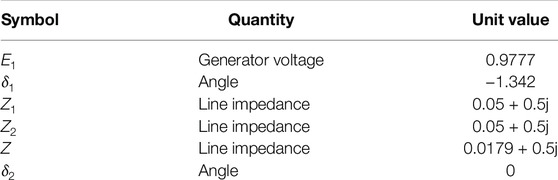
TABLE 2. Line parameters of the two-machine system.
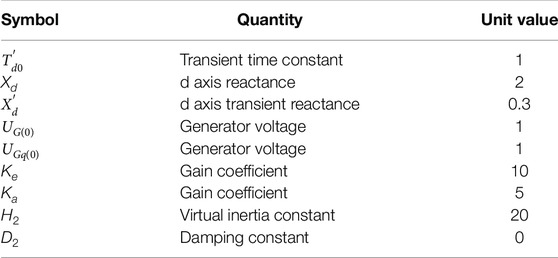
TABLE 3. SG parameters.
According to (27), the characteristic equation can be solved as follows:
It can be seen from equation (35) that the characteristic roots of the state equation are mainly affected by the virtual inertia H1 and the damping D1. The two parameters have different effects on the stability of the system with different values. The aforementioned characteristic equation has a zero root. The fifth-order equation is reduced to the fourth-order equation, and two pairs of characteristic roots will be solved. The small-signal analysis of (35) under different parameters is shown in Figure 14.
FIGURE 14. Eigenvalues when D = 10 and H changes.
Figure 14 shows the trajectory of characteristic roots when H1 changes from 10 to 50 under D1 = 10. s5 is zero, and s1, s2 and s3, s4 are two pairs of dominant characteristic roots. It can be seen from the figure that s3 and s4, the conjugate complex roots with negative real parts, do not change significantly with the change of virtual inertia H1. The characteristic roots of s1 and s2 change significantly with the virtual inertia H1. In the figure, the directions indicated by arrows are their changing trends. H gradually increases along the directions indicated by arrows. In the initial state, the system characteristic root is negative. With the increase of H, s1 and s2 gradually transit to the virtual axis, indicating that the system stability decreases. Therefore, in the two-machine system, the real part of the characteristic root solved by the characteristic equation is negative, and the system is static and stable under this operating condition. When the damping coefficient of VSC for the active support unit is constant, only the virtual inertia time constant is increased, so the system stability will be reduced.
Figure 15 shows the trajectory of characteristic roots when D1 changes from 1 to 30 under H1 = 20. s5 is zero, and s1, s2 and s3, s4 are two pairs of dominant characteristic roots. It can be seen from the figure that s3 and s4, the conjugate complex roots with negative real parts, do not change significantly with the change of virtual inertia D1. D1 gradually increases along the direction indicated by the arrow. In the initial state, the characteristic root of the system is a virtual value. With the increase of D1, s1 and s2 gradually transit to the negative real axis, and the system stability is improved.
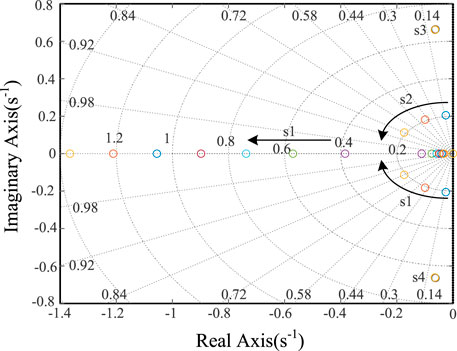
FIGURE 15. Eigenvalues when H = 20 and D changes.
Therefore, in the two-machine system, the real part of the characteristic root solved by the characteristic equation is negative, and the system is static and stable under this operating condition. When the virtual inertia constant of VSC for the active support unit is constant, the system stability will be improved only by increasing its damping coefficient.
4.2 Experimental Verification
The system in Section 4.1 is used for analysis. The reference power and reference voltage of SG are set at 100 MVA and 20 kV, and the inverter is set at 200 MVA and 20 kV, respectively. When t = 2 s, the load increases by 10%.
In active support control, both virtual inertia constant H and damping coefficient D can affect inverter frequency response. The virtual inertia constant mainly affects the speed of system frequency fluctuation. Increasing the virtual inertia constant can slow down the frequency change and reduce the fluctuation amplitude. Damping coefficient D affects the amplitude of system frequency fluctuation. By increasing the damping coefficient, the amplitude of frequency drop will decrease.
Figure 16 shows that when the virtual inertia time constant H increases from 10 to 30, the frequency drop rate slows down. Moreover, the frequency drop amplitude decreases and slowly attenuates to a stable value. Figure 17 shows that when the damping coefficient D increases from 10 to 30, the frequency drop amplitude decreases and slowly approaches the steady-state value. Figure 18 shows how the frequency changes when two parameters change simultaneously. After many experiments, the effect of continuous interference is the same as that of single interference.
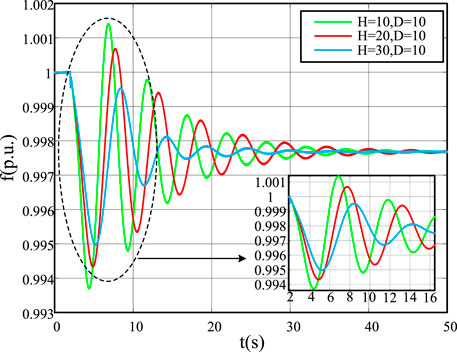
FIGURE 16. Frequency of the parallel inverter with the virtual inertial time constant changing.
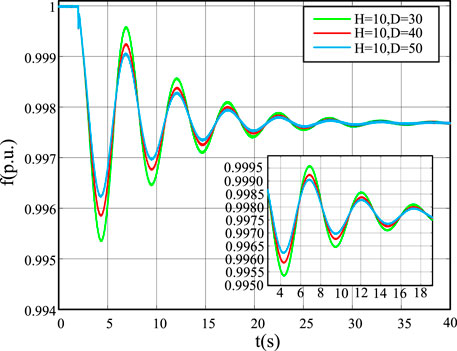
FIGURE 17. Frequency when the damping coefficient of the inverter changes in parallel connection.
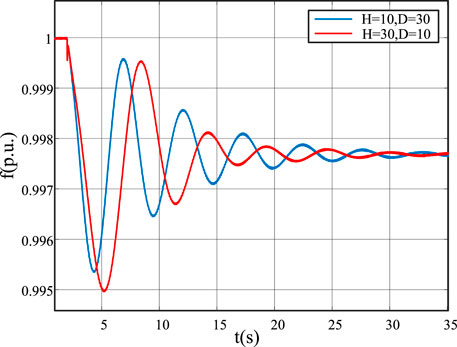
FIGURE 18. H and D change at the same time.
5 Conclusion
This article describes the control strategy design and small-signal analysis of VSC for active support. Based on the topology of three-phase VSC, the basic principle of active support control is introduced. Compared with PQ-control and droop-control, it is obvious that PQ-control does not have the frequency supportability. The frequency supportability of active support control is better than that of droop-control. When the system is disturbed, the active support control has a buffer process, which is more conducive to improving the frequency stability of the system. Then, the small-signal model of VSC for active support is established, and the small-signal analysis is carried out by the transfer function.
The influence of virtual inertia constant H and damping coefficient D on system stability is verified by simulation results. The small-signal model of a VSC-based two-machine system with active support control is established. Similarly, the small-signal analysis is carried out through the transfer function. Moreover, combined with the simulation results, the influence of the virtual inertia constant H and the damping coefficient D on the stability of the system is verified. With the increase of its virtual inertia constant, the system stability will decrease. In addition, with the increase of the damping coefficient, the system stability will be improved.
Data Availability Statement
The raw data supporting the conclusion of this article will be made available by the authors, without undue reservation.
Author Contributions
SW and TC contributed to the conception and design of the study. YX performed the statistical analysis. YX wrote the first draft of the manuscript. YX, SW, TC, MX, DL, and GL wrote sections of the manuscript. All authors contributed to manuscript revision and read and approved the submitted version.
Conflict of Interest
SW, MX, DL, and GL were employed by The State Grid Liaoning Electric Power.
TC was employed by the Electric Power Research Institute of State Grid Liaoning Electric Power.
The remaining authors declare that the research was conducted in the absence of any commercial or financial relationships that could be construed as a potential conflict of interest.
Publisher’s Note
All claims expressed in this article are solely those of the authors and do not necessarily represent those of their affiliated organizations, or those of the publisher, the editors, and the reviewers. Any product that may be evaluated in this article, or claim that may be made by its manufacturer, is not guaranteed or endorsed by the publisher.
Acknowledgments
The author thanks the State Grid Liaoning technology project “Research on Active Support Technology of High Proportion Renewable Energy Power System Based on Wind Solar Power Generation Inverter Boost Micro Control” (Project No. 2021YF-60).
References
Cao, X., Stephen, B., Abdulhadi, I. F., Booth, C. D., and Burt, G. M. (2016). Switching Markov Gaussian Models for Dynamic Power System Inertia Estimation. IEEE Trans. Power Syst. 31, 3394–3403. doi:10.1109/TPWRS.2015.2501458
Chen, Y., Guo, Z., Li, H., Yang, Y., and Ding, Z. (2020). Selection of a Critical Time Scale of Real-Time Dispatching for Power Systems with High Proportion Renewable Power Sources. IEEE Access PP, 1. doi:10.1109/access.2020.2980253
Fan, R., Wu, H., Chang, X., Yang, C., and Zhao, J. (2019). “A New Power Prediction Accuracy Evaluation Method of Renewable Energy Plant,” in 2019 IEEE Sustainable Power and Energy Conference (iSPEC). doi:10.1109/ispec48194.2019.8975125
Gaber, M., Shabib, G., Elbaset, A. A., and Mitani, Y. (2019). Renewable Power Systems Dynamic Security Using a New Coordination of Frequency Control Strategy Based on Virtual Synchronous Generator and Digital Frequency Protection. Int. J. Electr. Power & Energy Syst. 109, 351–368. doi:10.1016/j.ijepes.2019.02.007
Hou, X., Sun, Y., Han, H., Liu, Z., Yuan, W., and Su, M. (2019). A Fully Decentralized Control of Grid-Connected Cascaded Inverters. IEEE Trans. Sustain. Energy 10, 315–317. doi:10.1109/TPWRD.2018.2816813
Kayikci, M., and Milanovic, J. V. (2009). Dynamic Contribution of Dfig-Based Wind Plants to System Frequency Disturbances. IEEE Trans. Power Syst. 24, 859–867. doi:10.1109/tpwrs.2009.2016062
Li, B., Zhou, L., Yu, X., Zheng, C., and Liu, J. (2017a). Improved Power Decoupling Control Strategy Based on Virtual Synchronous Generator. IET Power Electron. 10, 462–470. doi:10.1049/iet-pel.2016.0608
Li, D., Zhu, Q., Lin, S., and Bian, X. Y. (2017b). A Self-Adaptive Inertia and Damping Combination Control of Vsg to Support Frequency Stability. IEEE Trans. Energy Convers. 32, 397–398. doi:10.1109/TEC.2016.2623982
Li, H., Zhao, Y., Zhang, Z., and Hu, X. (2015). “Short-term Load Forecasting Based on the Grid Method and the Time Series Fuzzy Load Forecasting Method,” in International Conference on Renewable Power Generation (RPG 2015), 1–6. doi:10.1049/cp.2015.0382
Li, M., Huang, W., Tai, N., Yang, L., Duan, D., and Ma, Z. (2020). A Dual-Adaptivity Inertia Control Strategy for Virtual Synchronous Generator. IEEE Trans. Power Syst. 35, 594–604. doi:10.1109/TPWRS.2019.2935325
Li, Y., Li, J., and Wang, Y. (2022a). Privacy-preserving Spatiotemporal Scenario Generation of Renewable Energies: A Federated Deep Generative Learning Approach. IEEE Trans. Ind. Inf. 18, 2310–2320. doi:10.1109/TII.2021.3098259
Li, Y., Wang, R., and Yang, Z. (2022b). Optimal Scheduling of Isolated Microgrids Using Automated Reinforcement Learning-Based Multi-Period Forecasting. IEEE Trans. Sustain. Energy 13, 159–169. doi:10.1109/TSTE.2021.3105529
Liu, H., Xie, X., He, J., Xu, T., Yu, Z., Wang, C., et al. (2017). Subsynchronous Interaction between Direct-Drive Pmsg Based Wind Farms and Weak Ac Networks. IEEE Trans. Power Syst. 32, 4708–4720. doi:10.1109/TPWRS.2017.2682197
Ma, J., Qiu, Y., Li, Y., Zhang, W., Song, Z., and Thorp, J. S. (2017). Research on the Impact of Dfig Virtual Inertia Control on Power System Small-Signal Stability Considering the Phase-Locked Loop. IEEE Trans. Power Syst. 32, 2094–2105. doi:10.1109/TPWRS.2016.2594781
Nikkhajoei, H., and Lasseter, R. H. (2009). Distributed Generation Interface to the Certs Microgrid. IEEE Trans. Power Deliv. 24, 1598–1608. doi:10.1109/tpwrd.2009.2021040
Shu, D., Xie, X., Rao, H., Gao, X., Jiang, Q., and Huang, Y. (2018). Sub- and Super-synchronous Interactions between Statcoms and Weak Ac/dc Transmissions with Series Compensations. IEEE Trans. Power Electron. 33, 7424–7437. doi:10.1109/TPEL.2017.2769702
Song, Q., Zhang, H., Sun, K., and Wei, Y. (2017). Improved Adaptive Control of Inertia for Virtual Synchronous Generators in Islanding Micro-grid with Multiple Distributed Generation Units. Proc. CSEE.
Tang, W., Hu, J., Chang, Y., and Liu, F. (2018). Modeling of Dfig-Based Wind Turbine for Power System Transient Response Analysis in Rotor Speed Control Timescale. IEEE Trans. Power Syst. 33, 6795–6805. doi:10.1109/TPWRS.2018.2827402
Wang, M., Ma, S., Wang, T., and Zeng, S. (2021). “Frequency Stability Analysis of High Proportion Renewable Energy System Delivered via Dc,” in The 16th IET International Conference on AC and DC Power Transmission (ACDC 2020), 675–679. doi:10.1049/icp.2020.0379
Wu, Q., Huang, Y., Li, C., Gu, Y., Zhao, H., and Zhan, Y. (2019). Small Signal Stability of Synchronous Motor-Generator Pair for Power System with High Penetration of Renewable Energy. IEEE Access 7, 166964–166974. doi:10.1109/ACCESS.2019.2953514
Xu, H., Zhang, X., Liu, F., Mao, F., and Yu, Y. (2017). Virtual Synchronous Generator Control Strategy Based on Lead-Lag Link Virtual Inertia. Proc. CSEE 37, 1918–1926.
Yuan, F., Wang, Y., and Zhang, X. (2017). Integrated Wind Turbine Controller with Virtual Inertia and Primary Frequency Responses for Grid Dynamic Frequency Support. IET Renew. Power Gener. 11, 1129–1137.
Zhang, B., Du, X., Zhao, J., Zhou, J., and Zou, X. (2020). Impedance Modeling and Stability Analysis of Three-phase Three-Level NPC Inverter Connected to Grid. CSEE J. Power Energy Syst. 6, 270–278. doi:10.17775/CSEEJPES.2019.02620
Keywords: active support, frequency stability, small-signal analysis, virtual inertia, VSC control strategy
Citation: Chu T, Xu M, Xie Y, Wang S, Li D and Liu G (2022) Small-Signal Stability Analysis of the Power System Based on Active Support of Renewable Energy VSCs. Front. Energy Res. 10:907790. doi: 10.3389/fenrg.2022.907790
Received: 30 March 2022; Accepted: 13 April 2022;
Published: 23 May 2022.
Edited by:
Dan Lu, Alfred University, United StatesReviewed by:
Ning Li, Xi’an University of Technology, ChinaYiqi Liu, Northeast Forestry University, China
Yaoqiang Wang, Zhengzhou University, China
Copyright © 2022 Chu, Xu, Xie, Wang, Li and Liu. This is an open-access article distributed under the terms of the Creative Commons Attribution License (CC BY). The use, distribution or reproduction in other forums is permitted, provided the original author(s) and the copyright owner(s) are credited and that the original publication in this journal is cited, in accordance with accepted academic practice. No use, distribution or reproduction is permitted which does not comply with these terms.
*Correspondence: Yu Xie, YTE0MTE2Nzg0MzFAMTYzLmNvbQ==