
95% of researchers rate our articles as excellent or good
Learn more about the work of our research integrity team to safeguard the quality of each article we publish.
Find out more
ORIGINAL RESEARCH article
Front. Energy Res. , 17 June 2022
Sec. Nuclear Energy
Volume 10 - 2022 | https://doi.org/10.3389/fenrg.2022.907374
This article is part of the Research Topic Experimental and Analytical Investigations on Nuclear Reactor Safety, Severe Accident Phenomena and Severe Accident Mitigation of Nuclear Power Plants View all 20 articles
 Haoyu Wang1
 Tianfei Zhao2Shuanghui Cao2
 Quan-yao Ren1Menglong Liu1Jibin Zhang1Yong Zheng3Yuanming Li1*Lianfeng Wei3*
Welding is one of the important connection methods for zirconium alloy, and the shear failure under the dynamic load is a typical failure mode of the weld. Aiming at clarifying the shear failure of zirconium alloy welds, three kinds of double-notched shear weld specimens with welding sizes of 2, 4, and 6 mm were designed, respectively; the shear performance of specimens under quasi-static and dynamic loading was tested by tensile testing machine and split Hopkinson pressure bar (SHPB). The stress–strain curves and shear strength were determined for the weld under quasi-static and dynamic loading. It was demonstrated that 1) an obvious strain rate strengthening effect was observed for the shear strength performance of zirconium alloy weld; 2) the shear performance of zirconium alloy weld was not sensitive to its length, but the tolerance to micro defects in the weld was improved with the increase of the weld length, which gave rise to a small increment of shear strength; 3) the failure mode of zirconium alloy welds under quasi-static loading was the typical lamellar tearing failure, and the angle between the fracture and base metal was about 17°; however, the shear failure mode showed obvious brittle characteristics under dynamic loading and the angle between fracture and base metal was almost parallel to the loading direction.
1) The quasi-static and dynamic shear performances of zirconium alloy welds with different sizes were determined.
2) The shear performance of zirconium alloy welds showed an obvious strain rate strengthening effect.
3) The dynamic shear failure of zirconium alloy welds was because of the micro holes generated in the electron beam welding process.
Zirconium alloy has been widely used as a structural material in the nuclear industry for its low thermal neutron absorption cross-section, excellent corrosion resistance, good irradiation stability, and mechanical properties (Adamson et al., 2019; Kalavathi and Kumar Bhuyan, 2019). As a credible connection method, welding has been applied in different zirconium alloy devices (Slobodyan M., 2021; Slobodyan M. S., 2021), such as nuclear fuel assemblies. Zirconium alloy cladding tube was welded with the end plugs, which served as the first barrier to nuclear reactor safety, and the spacer grid consisted of zirconium alloy strips, which were welded together with welding spots and lines. The fuel element with a rectangular cross-section was formed by the long welding line in the reactor transient test facility (TREAT) of Argonne National Laboratory (Vandegrift et al., 2019; Parga et al., 2017). Moreover, due to the good corrosion resistance, zirconium alloy was also utilized as a structural material in the dissolver equipment in the post-treatment device of the fast breeder reactor, a heat exchanger (Bandi et al., 2018), and pressure vessel (Tomie et al., 1990) in the chemical process industry, where the connection was also made by welding.
As an important structure in the above-mentioned fuel assemblies and other pieces of equipment, zirconium alloy welds should have sufficient mechanical strength so as not to be damaged during operation. Song et al. (2012) used zirconium alloy plate welds as specimens and determined mechanical properties (such as yield strength and tensile strength) of the base metal zone, heat-affected zone, and weld zone based on the instrumented indentation method. Then, a numerical simulation was carried out on the spacer grid crush strength with different weld properties (Song and Lee, 2012), which demonstrated that the crush strength decreased by about 30% when the zirconium alloy base metal properties were replaced by the weld material properties. However, Parga et al. (2017) found that the zirconium alloy base metal and weld zone by electron beam welding presented equivalent mechanical properties, but the hardness of the heat-affected zone was slightly higher. Considering the large influence of porosity on the mechanical properties and corrosion performance of zirconium alloy welds, X-ray tomography was used to conduct the three-dimensional visualization and quantitative measurement of the porosity of Zr-4 plate welding joints by the electron beam under different welding parameters (Bandi et al., 2018). Tao et al. (2013) developed a pulsed laser spot welding technology for the junction connection of Zr-4 sheets with a thickness of 0.457 mm and studied the effect of shot numbers, pulse width, and peak power on the size, mechanical properties, and the microstructure of the weld zones. Sakamiti et al. (2019) compared the mechanical properties, microstructure, and corrosion of zirconium alloy welds between resistance welding and laser beam welding. Sakamiti et al. (2019) found that the tensile strength of resistance welding welds (8,700 ± 100 N) was much larger than that of pulse laser welding welds (3,500 ± 200 N) because the fit gaps between welds were compensated by the electrode load during resistance welding and reduced to zero nearly in resistance welding technology.
In the above-mentioned studies on the mechanical properties of zirconium alloy welds, the static tensile strength was mainly focused and so were the effects of welding methods on the mechanical properties of welds. However, studies on the shear strength of zirconium alloy welds were scarce, especially for that under dynamic loads at different strain rates. Shear failure is a typical and common mode of weld failure, which needs much attention in the related design of welds. For example, when the fuel assembly dropped in the transportation (Kim et al., 2019) or underwent an earthquake shock (Pellissetti et al., 2021), strong shear loads would be exposed to the zirconium structure. Thus, it is of great significance to study the shear performance of zirconium alloy welds under dynamic and static loadings. Recently, the double-notched shearing technique was developed and widely applied to study the shear failure of some metals (Xu et al., 2018; Zhou et al., 2019). For the designed double-notched specimen, the compression load can be transformed into the local shear load with good uniformity, and the shear deformation of the specimen surface can also be observed clearly. In the present study, the double-notched shear weld specimens were designed to study the shear performance of zirconium alloy welds, and the electronic tensile testing machine and the split Hopkinson pressure bar (SHPB) device were used to carry out the shear tests under quasi-static and dynamic loads. In addition, the effects of strain rate and weld length on the shear performance are discussed, which could provide fundamental information for the design and failure analysis of zirconium alloy welds.
The double-shear specimens were made from three Zr–Sn–Nb alloy plates using the vacuum electron beam scanning welding method for both sides, whose chemical composition is shown in Table. 1. The weld specimen for the double-notched shear test is shown in Figure 1B while the welding plate after sampling is shown in Figure 1A. It should be noted that the welding zone is marked by the red dotted line and the heat affecting zone is marked by a green rectangular box. The design of weld specimens kept the shear failure appearing in the welding zone. Moreover, to ensure the geometrical accuracy of the specimen, the high-precision slow-feeding wire cutting machine was used to cut the specimens with a cutting accuracy of 0.1 mm.

TABLE 1. Chemical composition (wt%) of the Zr–Sn–Nb alloy plate.
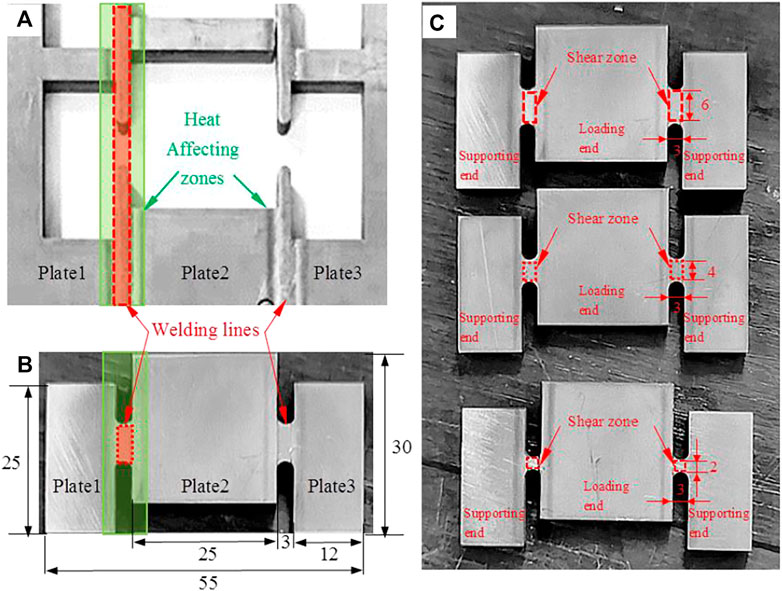
FIGURE 1. Specimens design: (A) welding plate after sampling, (B) welding specimen with a welding length of 6 mm, and (C) three kinds of weld specimens with different lengths.
As shown in Figure 1C, the double-notched shear specimen was composed of two supporting ends and one loading end. There were two welding zones for the shear test between the supporting end and the loading end. To study the influence of welding length on the shear performance, three kinds of specimens were made with welding lengths of 2, 4, and 6 mm. Moreover, the fillet with a radius of 1.5 mm was set at the corner of the shear area to prevent stress concentration in this area during the shearing tests.
As shown in Figure 2A, the fixture consisting of a restraint end and a connecting end was designed to apply load on the shear zone of weld specimens uniformly. The assembly relationship between the fixture and specimen is shown in Figure 2B. During the test, the restraint end and the connecting end were connected by bolts. The slots were designed in the restraint part to prevent toppling and transverse displacement of the specimen. Moreover, the observation window was considered in the restraint end for observing the real-time deformation process of the specimen by high-speed photography.
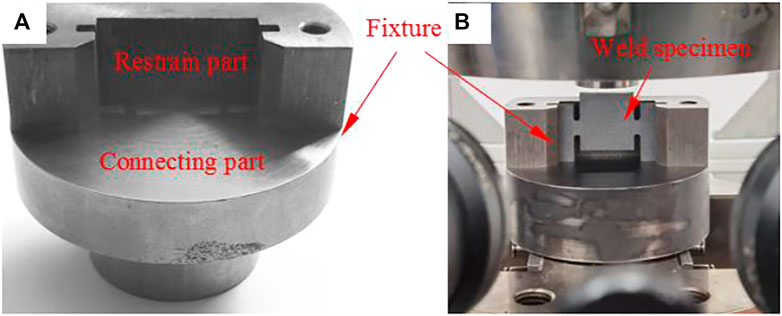
FIGURE 2. Fixture design: (A) fixture and (B) clamping relationship between the weld specimen and fixture.
As shown in Figure 3A, the quasi-static shear test was carried out by the MTS 10-ton tensile and torsional fatigue testing machine. Moreover, Aramis optical non-contact full-field strain measurement system provided by the German GOM Company was used to measure the shear strain of the specimen in real time. The system captured the randomly distributed spots on the specimen surfaces by two cameras and converted them into digital data by CCD (charge-coupled device), and processed the digital data into the required strain data with its built-in software with an accuracy of 0.001. A typical full-field shear strain field is shown in Figure 3B, which shows that the shear deformation of the specimen was mainly concentrated in the weld zone, and almost no deformation occurred in the other zones.
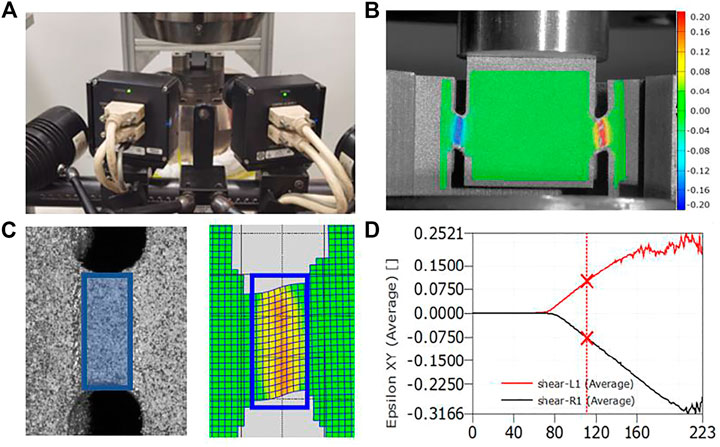
FIGURE 3. Quasi-static shear test: (A) Aramis optical full-field strain measurement system, (B) shear strain field on the specimen surface, (C) average shear strain selection zone, and (D) average shear strain curves at left and right weld shear zones.
It should be noted that the shear strain was not uniform in the welding zone as shown in Figure 3C. Therefore, the selected zone to calculate the averaged shear strain had a large influence on the averaged strain value, which must remove the heat-affecting zone. In addition, the shear strain would be too large if the selected zone were too narrow. After several shear tests, it was observed that the obvious strain features appeared in the zone with a width of 2 mm for all specimens with three different welding lengths. Thus, the zone with a width of 2 mm, as shown in Figure 3C, was selected to calculate the average shear strain value. Moreover, the absolute values of the average shear strain in the left and right shear zones gradually increased with the shear load, as shown in Figure 3D. The average shear strain in the right shear zone was negative because the coordinate origin was established on the centerline of the specimen.
The averaged shear stress was calculated as
where
As shown in Figure 4, the split Hopkinson pressure bar (SHPB) experimental technique was used to measure the dynamic shear properties of welds of different sizes under a high strain rate. SHPB devices mainly consisted of an impact bar, incident bar, and support bar, and these bars were made of titanium alloy rods with a diameter of
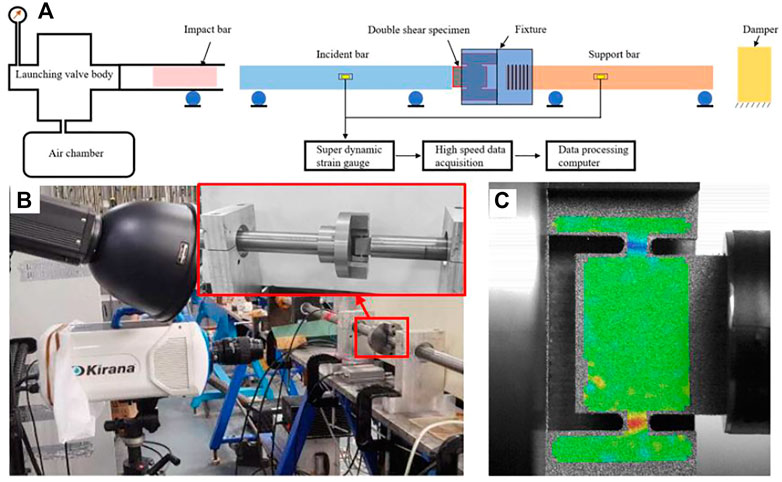
FIGURE 4. SHPB test device: (A) SHPB schematic diagram, (B) ultra-high-speed camera recording system, and (C) shear strain field on the specimen surface.
In the dynamic shear test, the incident bar was hit by the impact bar by the release of air pressure in the chamber, which produced the compression strain pulse signal that acted on the loading end of the specimen. When the incident strain pulse reached the contact interface between the incident bar and the specimen, it was reflected and transmitted due to the differences between the wave impedance of the incident bar and specimen. All the three strain pulse signals were measured by the strain gauge attached to the rod. Moreover, the deformation process and real-time strain field were recorded with a Kirana high-speed camera, and Aramis optical measurement system was applied to calculate the strain as shown in Figures 4B,C. The speckle dots on the surface of the specimen were obtained by the fine spray paint.
It was difficult to achieve a constant strain rate during the sample deformation for the high strain hardening behavior. Aiming at showing the strain rate level, the average strain rate during the loading process was calculated, and the test conditions are listed in Table. 2. It should be noted that the definition of broken specimens and unbroken specimens will be explained in detail in Section 3.2.
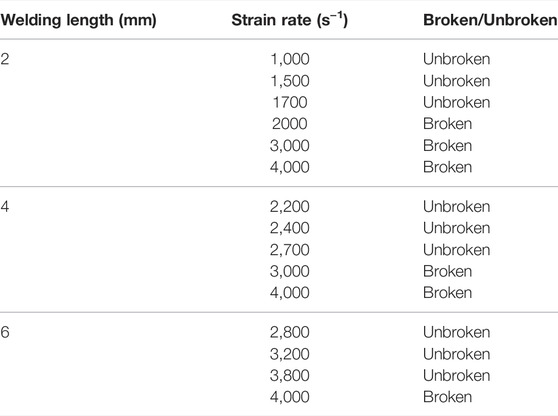
TABLE 2. Dynamic shear test conditions.
Based on the one-dimensional stress wave theory, the dynamic shear stress can be calculated by the three stress wave signals on the incident and support bars (
Based on the study of Zhou et al. (2019), since the transmitted wave was reflected and transmitted many times at the contact interfaces between the specimen and the fixture as well as between the fixture and the support rod, the transmitted strain wave signal that recorded on the support rod was seriously dispersed and was not suitable for the calculation of the dynamic shear stress. But if the incident bar and the loading end of the specimen were treated as a mini-system (as shown in Figure 5), the equilibrium state could be achieved in the loading end of the specimen. With the analogy to the quasi-static loading system, the stress and strain of the specimen can be obtained using the incident bar. A similar system and data processing method were adopted by Zhou et al. (2019) and Xu et al. (2018).
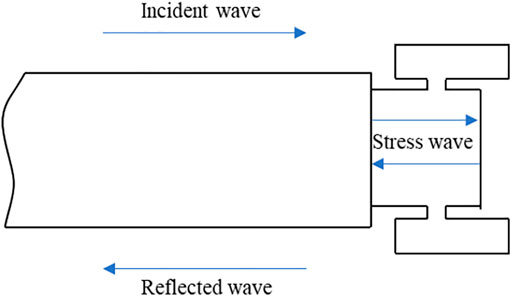
FIGURE 5. Loading end of SHPB.
Due to the mini-system equilibrium relation of SHPB, the transmitted wave strain is the sum of incident wave strain and reflected wave strain as shown in Eq. 3. Thus, the dynamic shear stress can be calculated as in Eq. 4.
In Equations 2–4,
The shear stress–strain curves of different specimens in the quasi-static shear test are shown in Figure 6 while the values of the shear yield strength and maximum shear strength are listed in Table. 3. The shear stress–strain curves almost coincided in the elastic zone. The shear yield strengths of the specimens with lengths of 2, 4, and 6 mm were about 310, 317, and 325 MPa, respectively, while the maximum shear strengths were about 407, 416, and 424 MPa, respectively. Therefore, the shear strength increased slightly with the increase in the welding length, and the deviations of the shear yield strength and maximum shear strength for the specimens with three welding lengths were less than 5%.
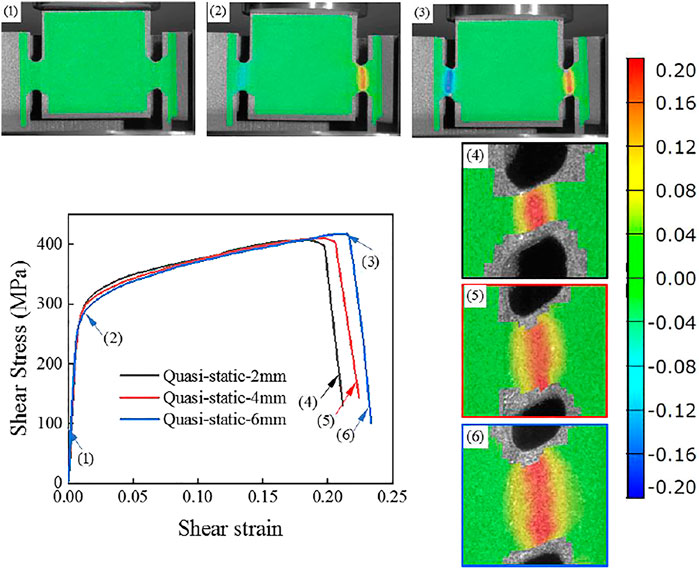
FIGURE 6. Quasi-static shear stress–strain curves and the corresponding shear strain field.
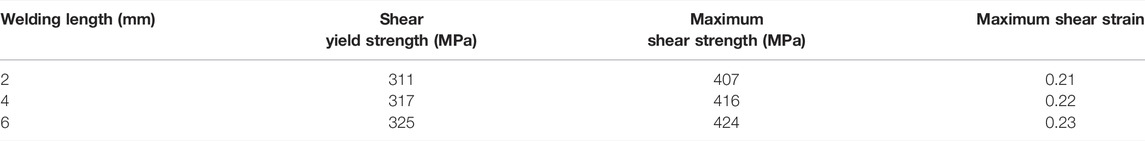
TABLE. 3. Shear test data of zirconium alloy welds with different welding lengths.
The shear strain fields for the specimen with a welding length of 6 mm at the initial loading condition, yield condition, and maximum shear strength condition are shown in Figures 6(1), (2), and (3), respectively. At the initial loading condition, the uniform deformation appeared on welding zones on both sides; the shear strain increased rapidly when the welding zone reached the plastic deformation zone; at last, with the load increasing, larger deformation occurred and then the shear failure occurred.
When the welds were almost broken, the shear strain fields of the weld with lengths of 2, 4, and 6 mm are shown in Figures 6(4), (5), and (6), respectively. As can be seen, with the length of the weld increasing, the surrounding region bearing the shear deformation also gradually increased, which gave rise to the larger maximum shear strength. It was considered that the weld with a larger length improved the resistance to the local micro deflects. To sum up, the shear yield strength and maximum shear strength increased with the welding length increasing for the larger average shear strain in the welding zone.
For clarifying the influences of shear strain rate and welding length on the shear strength, SHPB tests on the specimens of the same size were conducted under different strain rates. The dynamic shear stress–strain curves of the specimen with a welding length of 2 mm under different strain rates are shown in Figure 7, while their final deformation shapes are shown in Figure 8. As can be seen, the strain rate had a great influence on the shear stress–strain curves and the final deformation shape.
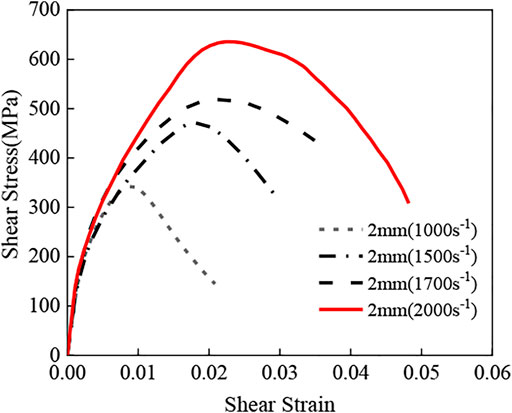
FIGURE 7. Dynamic shear stress–strain curves of specimens with 2 mm welding length.
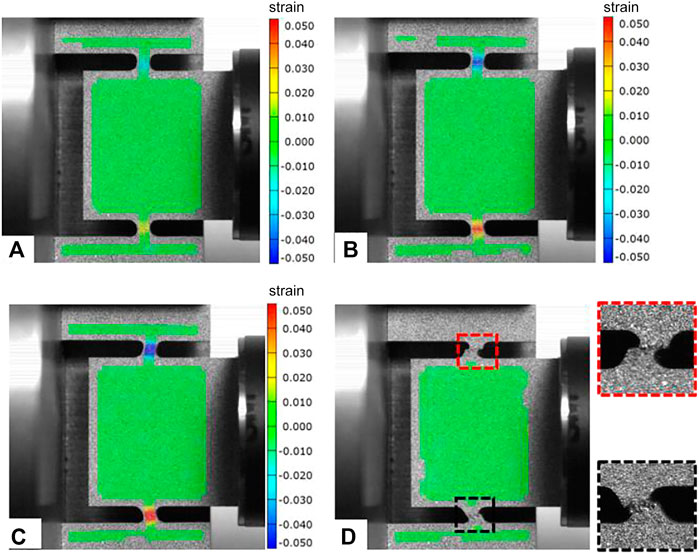
FIGURE 8. Failure morphology of specimens with 2 mm welding length: (A) 1000 s−1, (B) 1500 s−1, (C) 1700 s−1 and (D) 2000 s−1.
As shown in Figure 8, the weld specimens did not break under the strain rates of 1,000, 1,500, and 1,700 s−1, and these specimens are called “unbroken” ones. Thus, the shear stress peak values under these three strain rates in Figure 7 were at the initial unloading conditions, which were not the maximum shear strength values of welds. Moreover, although no fracture occurred, the shear stress increased with the strain rate due to a larger impact load.
As shown in Figure 8D, the shear failure appeared on the weld specimens with a length of 2 mm when the strain rate reached 2,000 s−1, and this kind of specimen is called a “broken” specimen. Thus, the shear stress peak value with a strain rate of 2,000 s−1 was recognized as the maximum shear strength of the weld specimens. Moreover, it can be observed that the lower welding zone (in the black line) had larger shear deformation than the upper welding zone (in the red line). In this test, it was deduced that: the shear fracture first appeared in the upper welding zone due to nonuniformly distributed micro defects; then, the lower welding zone bear the load by itself and an obvious shear deformation occurred.
With the emitting pressure on the impact bar increasing gradually, the shear stress–strain curves of zirconium alloy weld specimens with lengths of 4 and 6 mm had similar rules, and the failed strain rates were 3,000 and 4,000 s−1, respectively. To study the influence of welding lengths, the tests on the weld specimens with lengths of 4 and 6 mm were also conducted under strain rates of 3,000 and 4,000 s−1.
As shown in Figure 9, with the strain rate increasing from 2,000 to 4,000 s−1 under the quasi-static conditions, the maximum shear strength of the weld specimen with a length of 2 mm increased obviously. The maximum shear strength values were 407, 636, 716, and 818 MPa at strain rates of 2,000, 3,000, and 4,000 s−1 under quasi-static conditions, respectively. Compared with the maximum shear strength values under the quasi-static test, the maximum shear strength values at strain rates of 2,000, 3,000, and 4,000 s−1 increased by about 56, 76, and 101%, respectively. Therefore, the zirconium alloy weld had a typical strain rate strengthening effect.
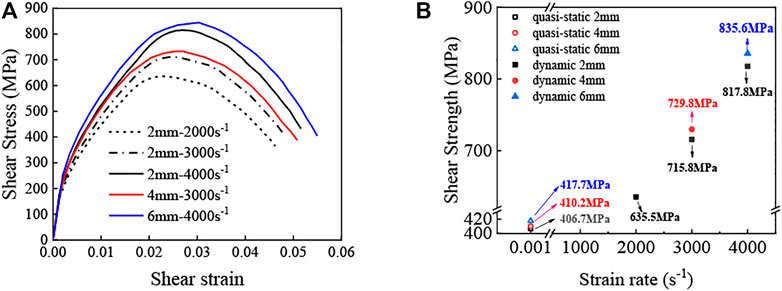
FIGURE 9. Shear performance comparison with different welding lengths under different strain rates: (A) dynamic shear stress–strain curves and (B) shear strengths.
As shown in Figure 9B, under the quasi-static conditions, the maximum shear strengths of 4 and 6 mm weld specimens were 0.9 and 2.7% larger than that of the 2 mm weld specimen. When the strain rate was 3,000 and 4,000 s−1, the maximum shear strengths of 4 and 6 mm weld specimens were 2.0 and 2.2% larger than that of 2 mm weld specimens, respectively. These phenomena demonstrated that the larger welding length gave rise to a larger shear strength but with a small increment.
Aiming at studying the fracture mechanisms of zirconium alloy weld shear failure under different strain rates, focused ion/electron double beam microscopy was used to observe the microstructures of fractures.
The macro morphology of the weld fracture under quasi-static shear test conditions is shown in Figures 10A–C, which shows typical shear failure features. The obvious shear deformation appeared at the weld, while the angle between the loading direction and the fracture on the side broken earlier was about 17°.
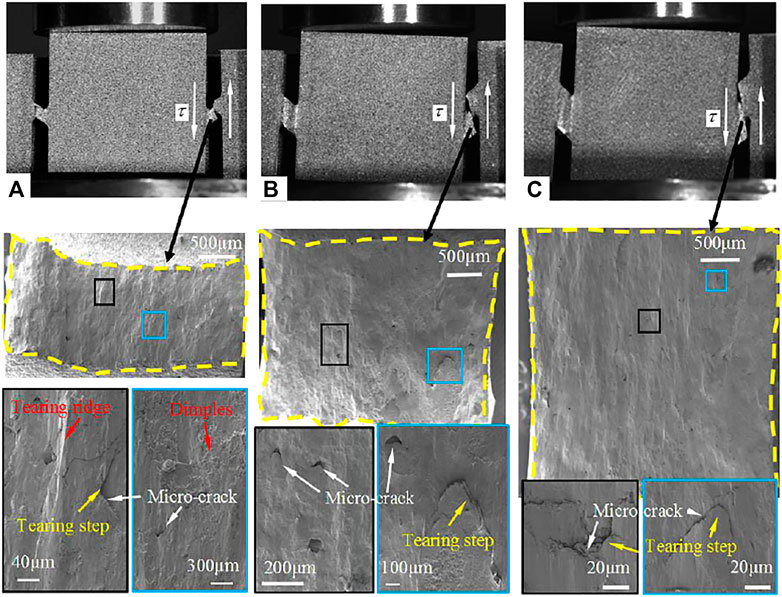
FIGURE 10. SEM images of the fracture surface of weld specimens with different welding lengths under quasi-static tests with a shear strain rate of about 0.001 s−1: (A) 2 mm weld specimen, (B) 4 mm weld specimen, and (C) 6 mm weld specimen.
As shown in the fracture SEM pictures of the 2 mm weld specimen, many tearing ridges were observed, whose direction was almost parallel to the direction of shear loading. By enlarging the zone in the black line of the SEM picture, some tearing steps appeared on both sides of the tearing ridges, and most micro cracks were located near the tearing steps. Moreover, some micro holes that did not form the micro cracks were also found. Based on the above-mentioned phenomena, the lamellar tearing was inferred to be the main mechanism of micro cracks formation. By enlarging the zone in the blue line of the SEM picture, a few dimples were found, which indicated that the ductile fracture appeared in some local zone. It should be noted that the dimple shape did not show the ductile fracture morphology of the metal, but presented layered distribution and was stretched along the loading direction. Thus, it can be concluded that the slight ductile deformation occurred in this zone first and then the micro holes appeared; further this zone was torn in the loading process.
By comparison among the SEM pictures of the fracture of 2, 4, and 6 mm weld specimens, it was found that, with the increase in the welding length, the number of tearing ridges decreased obviously and the fracture tended to be smoother. Micro cracks derived from tearing steps could be still seen but dimples were not observed for the fracture SEM picture of 4 and 6 mm welds, which might result because the larger welding length led to a more uniform load on the shear face and weakened the stress concentration and the plastic flow in the local zone. Moreover, the number of cracks also decreased with the increase in the welding length, which was attributed to the full propagation of micro cracks into the fracture.
Therefore, the transition from the brittle fracture accompanied by a few local ductile fractures in the 2 mm weld specimen to the brittle fracture in the 6 mm weld specimen was the main reason for the increment of shear strength.
The SEM pictures of the fracture under a dynamic load are shown in Figure 11. The dynamic shear fracture was almost parallel to the loading direction, which is distinct from that of the quasi-static shear fracture, as shown in Figure 10, and indicated the typical brittle fracture characteristics. Moreover, the dynamic shear fracture surface was smoother compared with the quasi-static shear fracture surface, and the lamellar tearing zone was located on the right side of the fracture. However, the lamellar tearing zone was very small and the obvious tearing steps were nearly not observed, and the number of micro cracks was also small. Instead, the nearly circular deep holes were found in the zone in black lines of SEM pictures.
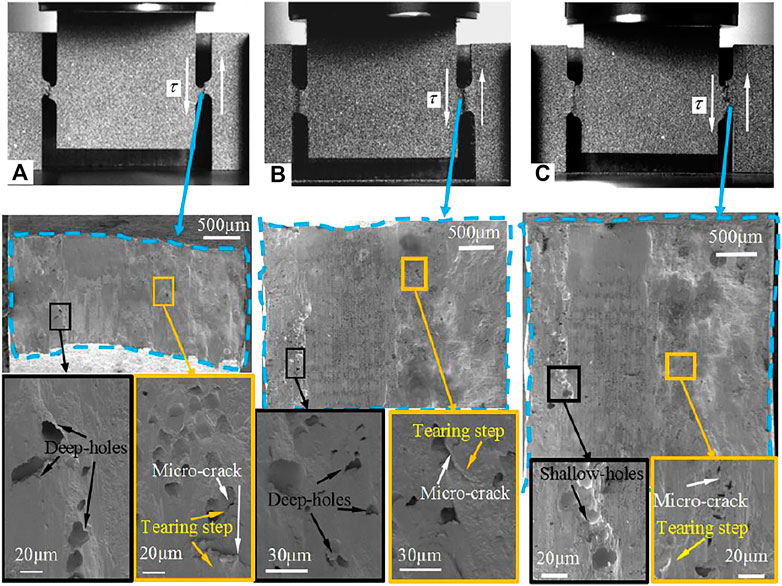
FIGURE 11. SEM images of the fracture surface of weld specimens with different welding lengths under dynamic test conditions: (A) 2 mm weld specimen (2000 s−1), (B) 4 mm weld specimen (3000 s−1), and (C) 6 mm weld specimen (4000 s−1).
When the attention was paid to these deep micro holes, some interesting phenomena were found: all the deep micro holes in the SEM pictures of three different weld specimens were located in the zone which was several millimeters from the welding surface. It was speculated that in the electron beam welding process, the temperature gradient appeared due to the large melting temperature of zirconium alloy; when the electron beam bombarded the welding zone, the melt zirconium alloy froze at a larger rate at the surface than that at the bottom of the molten pool, and the metal steam might be hard to be released; thus, the linear porosity and nail tip defects might arise (Liang et al., 2019) and continuous micro gas holes might appear (Liu and He, 2016) at the bottom of the molten pool. The double-side electron beam welding method was adopted in the weld specimens in this study; therefore, the micro holes appeared near both sides of the weld specimens.
Because micro holes were located near the weld surface, micro cracks appear in the zone near the welding surface first and propagated to the macro cracks; then, the macro cracks propagated to the other side rapidly and the smooth fracture formed in the middle zone. As shown in Figure 11, because a few lamellar tearing steps appeared on the right sides of the fractures (the zone in the yellow lines), the cracks of all weld specimens propagated from the left side to the right side. Moreover, it should be noted that no dimples were observed in the SEM pictures and they showed typical shear brittle fracture features. Thus, the dynamic shear failure of the zirconium alloy welding specimen was deduced to result from the micro hole defects generated in the electron beam welding process; in dynamic loading, the micro holes and micro cracks propagated rapidly and formed fractures due to the stress concentration near the micro holes defects.
Aiming at studying the influences of strain rate and welding length on the zirconium alloy welding strength, double-notched shear specimens with welding lengths of 2, 4, and 6 mm were made by electron beam welding and a slow-feeding wire cutting machine. Based on the specimens, the quasi-static and dynamic shear tests were conducted. The following conclusions can be reached:
1) The shear performance of zirconium alloy welds showed an obvious strain rate strengthening effect: the maximum shear strengths of 2 mm weld at strain rates of 2,000, 3,000, and 4,000 s−1 were about 56, 76, and 101% larger than those under quasi-static conditions.
2) For present specimens, with the increase in the welding length, all the maximum shear strength of the zirconium alloy weld under quasi-static and dynamic shear tests increased with a small amplitude, which might result from the larger tolerance for the micro defects and need more experimental data to verify.
3) The failure mode of zirconium alloy welds under quasi-static loading was the typical lamellar tearing failure, and the angle between the fracture and base metal was about 17°. The shear failure mode showed obvious brittle characteristics under dynamic loading, and the fracture was almost parallel to the loading direction. The dynamic shear failure of zirconium alloy weld was due to the micro gas holes generated in the electron beam welding process.
The original contributions presented in the study are included in the article/supplementary material; further inquiries can be directed to the corresponding authors.
HW: conception and design of the study, analysis of data, drafted the manuscript; TZ: experimental design, experimental execution; SC: experimental execution, data processing; Q-YR: analysis of data, drafting the manuscript; ML: investigation; JZ, LW: made samples; YZ, YL: analysis of data.
The authors are grateful for the support from the National Key R&D Program of China (Grant No. 2018YFE0116100) and the Natural Science Foundation of China (Grant Nos: 12105273).
The authors declare that the research was conducted in the absence of any commercial or financial relationships that could be construed as a potential conflict of interest.
All claims expressed in this article are solely those of the authors and do not necessarily represent those of their affiliated organizations, or those of the publisher, the editors, and the reviewers. Any product that may be evaluated in this article, or claim that may be made by its manufacturer, is not guaranteed or endorsed by the publisher.
Adamson, R. B., Coleman, C. E., and Griffiths, M. (2019). Irradiation Creep and Growth of Zirconium Alloys: A Critical Review. J. Nucl. Mater. 521, 167–244. doi:10.1016/j.jnucmat.2019.04.021
Bandi, B., Dinda, S. K., Kar, J., Roy, G. G., and Srirangam, P. (2018). Effect of Weld Parameters on Porosity Formation in Electron Beam Welded Zircaloy-4 Joints: X-Ray Tomography Study. Vacuum 158, 172–179. doi:10.1016/j.vacuum.2018.09.060
Kalavathi, V., and Kumar Bhuyan, R. (2019). A Detailed Study on Zirconium and its Applications in Manufacturing Process with Combinations of Other Metals, Oxides and Alloys - A Review. Mater. Today Proc. 19, 781–786. doi:10.1016/j.matpr.2019.08.130
Kim, H.-J., Yim, J.-S., Tahk, Y.-W., Oh, J.-Y., and Kong, E.-H. (2019). Drop Behaviors of a Plate-type Fuel Assembly Used in Research Reactor for a Drop Accident. Prog. Nucl. Energy 113, 255–262. doi:10.1016/j.pnucene.2019.01.020
Liang, L., Hu, R., Wang, J., Luo, M., Huang, A., Wu, B., et al. (2019). A CFD-FEM Model of Residual Stress for Electron Beam Welding Including the Weld Imperfection Effect. Metall Mat Trans A 50 (5), 2246–2258. doi:10.1007/s11661-019-05154-8
Liu, C., and He, J. (2016). Numerical Analysis of Fluid Transport Phenomena and Spiking Defect Formation during Vacuum Electron Beam Welding of 2219 Aluminium Alloy Plate. Vacuum 132, 70–81. doi:10.1016/j.vacuum.2016.07.033
Parga, C. J., van Rooyen, I. J., Coryell, B. D., Lloyd, W. R., Valenti, L. N., and Usman, H. (2017). Room Temperature Mechanical Properties of Electron Beam Welded Zircaloy-4 Sheet. J. Mater. Process. Technol. 241, 73–85. doi:10.1016/j.jmatprotec.2016.11.001
Pellissetti, M., Kessler, H., Schmidl, J., Nykyforchyn, A., and Akcay, S. S. .(2021). Seismic Performance of Fuel Assemblies and Impact Force Correlations with Intensity-Compatible Sets of Recorded Ground Motion Time Histories. Nucl. Eng. Des. 375 (2021), 111052. doi:10.1016/j.nucengdes.2021.111052
Sakamiti, G. P., Siqueira, R. H. M. d., Carvalho, S. M. d., Meireles, J. B., and Lima, M. S. F. d. (2019). Weldability of a Zirconium Alloy Comparing Resistance and Pulsed Laser Methods. Nucl. Mater. Energy 20, 100693. doi:10.1016/j.nme.2019.100693
Slobodyan, M. (2021). Resistance, Electron- and Laser-Beam Welding of Zirconium Alloys for Nuclear Applications: A Review. Nucl. Eng. Technol. 53 (4), 1049–1078. doi:10.1016/j.net.2020.10.005
Slobodyan, M. S. (2021). Arc Welding of Zirconium and its Alloys: A Review. Prog. Nucl. Energy 133, 103630. doi:10.1016/j.pnucene.2021.103630
Song, K.-n., Hong, S.-d., Lee, S.-h., and Park, H.-y. (2012). Effect of Mechanical Properties in the Weld Zone on the Structural Analysis Results of a Plate-type Heat Exchanger Prototype and Pressurized Water Reactor Spacer Grid. J. Nucl. Sci. Technol. 49 (9), 947–960. doi:10.1080/00223131.2012.713571
Song, K.-n., and Lee, S.-h. (2012). Effect of Weld Properties on the Crush Strength of the PWR Spacer Grid. Sci. Technol. Nucl. Installations 2012, 1–12. doi:10.1155/2012/540285
Tao, W., Cai, C., Li, L., Chena, Y., and Wanga, Y. L. (2013). Pulsed Laser Spot Welding of Intersection Points for Zircaloy-4 Spacer Grid Assembly. Mater. Des. 52, 487–494. doi:10.1016/j.matdes.2013.05.037
Tomie, M., Abe, N., and Hano, M. (1990). Electron Beam Welding of Zirconium Plate. Trans. JWRI 19 (1), 149–150.
Vandegrift, J., Parga, C. J., Coryell, B., Butt, D. P., and Jaques, B. J. (2019). Oxidation Behavior of Welded Zry-3, Zry-4, and Zr-1Nb Tubes. Nucl. Mater. Energy 21, 100714. doi:10.1016/j.nme.2019.100714
Xu, Z., Liu, Y., Sun, Z., Hu, H., and Huang, F. (2018). On Shear Failure Behaviors of an Armor Steel over a Large Range of Strain Rates. Int. J. Impact Eng. 118, 24–38. doi:10.1016/j.ijimpeng.2018.04.003
Keywords: zirconium alloy, weld, shear, strain rate, dynamic load
Citation: Wang H, Zhao T, Cao S, Ren Q-y, Liu M, Zhang J, Zheng Y, Li Y and Wei L (2022) Shear Performance of Zirconium Alloy Welds Under Different Strain Rates. Front. Energy Res. 10:907374. doi: 10.3389/fenrg.2022.907374
Received: 30 March 2022; Accepted: 09 May 2022;
Published: 17 June 2022.
Edited by:
Luteng Zhang, Chongqing University, ChinaReviewed by:
Kui Zhang, Xi’an Jiaotong University, ChinaCopyright © 2022 Wang, Zhao, Cao, Ren, Liu, Zhang, Zheng, Li and Wei. This is an open-access article distributed under the terms of the Creative Commons Attribution License (CC BY). The use, distribution or reproduction in other forums is permitted, provided the original author(s) and the copyright owner(s) are credited and that the original publication in this journal is cited, in accordance with accepted academic practice. No use, distribution or reproduction is permitted which does not comply with these terms.
*Correspondence: Yuanming Li, THltX25waWNAMTI2LmNvbQ==; Lianfeng Wei, MjUyMDQ0NjY1QHFxLmNvbQ==
Disclaimer: All claims expressed in this article are solely those of the authors and do not necessarily represent those of their affiliated organizations, or those of the publisher, the editors and the reviewers. Any product that may be evaluated in this article or claim that may be made by its manufacturer is not guaranteed or endorsed by the publisher.
Research integrity at Frontiers
Learn more about the work of our research integrity team to safeguard the quality of each article we publish.