 Gangui Yan1
 Xueyuan Liu
 Xiuyu Yang
 Guofeng Chai
 Qi Guo
- 1Key Laboratory of Modern Power System Simulation and Control and Renewable Energy Technology, (Northeast Electric Power University), Jilin, China
- 2Northeast Electric Power Design Institute Company Limited of China Power Engineering Consulting Group, Changchun, China
- 3School of Electrical and Computer Engineering, the University of Idaho, Moscow, ID, United States
An energy storage system transfers power and energy in both time and space dimensions and is considered as critical technique support to realize high permeability of renewable energy in future power systems. It contributes to the achievement of China’s long-term carbon emission abatement targets. However, the promotion and application of energy storage are severely restricted due to the high construction cost of energy storage systems and lack of effective compensation mechanisms for peak-regulating ancillary service. In this study, a source-storage-transmission joint planning method is proposed considering the comprehensive incomes of energy storage. The comprehensive income of the energy storage system is divided in detail from the planning level, and the accounting method of energy storage income is proposed. Based on the load fluctuating trend under the condition of the connecting wind power grid, the dynamic electricity pricing methods of power trisection and time trisection are introduced to achieve the dual goals of direct income from energy storage and improving system flexibility. To comprehensively consider the direct income of peak-valley arbitrage and indirect income of energy storage configuration, a coordinated planning model of source-storage-transmission is constructed and tested in the Garver-6 system using the measured data from one province grid in China. The results verify the effectiveness of the proposed methods and show improvements in cost recovery and system flexibility.
1 Introduction
Vigorously developing renewable energy power generation is an effective remedy to reduce the dependence on fossil fuel energy and achieve a sustainable society (Chen et al., 2022). The total installed capacity of wind and solar power is expected to exceed 1.2 billion kW by 2030, with non-fossil energy accounting for 80 percent of primary energy by 2060 (Jiang et al., 2018; Aktar et al., 2021). Due to the volatility and uncertainty of renewable energy output, the high proportion of grid connection will put forward higher requirements for the supply and demand balance of power system flexibility. Energy storage has many technical characteristics such as energy storage capacity, controllability, and flexible installation. Its large-scale application can better solve the problem of system flexibility imbalance after high-proportion renewable energy access. Energy storage is an important technical support for future high-proportion renewable energy power systems (Zhang et al., 2018; Heggarty et al., 2019; Zhai et al., 2020). However, the high cost of energy storage and the lack of a comprehensive income accounting mechanism seriously restrict the popularization and application of energy storage. Speeding up the development of energy storage technology to reduce costs and building a power market mechanism that fully considers the effectiveness of energy storage is the key to promoting large-scale investment in energy storage. Therefore, the establishment of an accounting mechanism considering the comprehensive incomes of energy storage is of great significance to the source-storage-transmission coordination planning in high-proportion renewable energy power systems.
In order to cope with the lack of flexibility caused by large-scale renewable energy integration, many scholars have made a series of valuable studies on the optimal allocation of energy storage, the joint planning of energy storage and transmission networks, and the coordinated planning of source-storage-networks. In terms of optimal allocation of energy storage, (Liu Y. et al., 2021) proposed an optimization method of energy storage capacity allocation for wind power cluster based on the ant lion algorithm, aiming at maximizing the income of wind power cluster and energy storage. (Sun et al., 2020) considered both planning and operation aspects of energy storage and proposed a storage configuration scheme that is both economically and flexibly optimal. (Sadeghian et al., 2020) proposed an optimal allocation method of energy storage based on the conditional risk value to improve the economy of energy storage layout in virtual power plants. (Zhao et al., 2021) constructed the optimal allocation model of microgrid cluster and took the minimum operation cost of energy storage as the dynamic optimization strategy of operation cost, so as to achieve the purpose of minimizing the total cost. (Cai et al., 2019) proposed an optimal allocation method of battery energy storage systems considering the comprehensive incomes of energy storage systems in electric networks. (Cui et al., 2016) considered the economic incomes of the energy storage system in terms of peak-valley arbitrage and proposed the energy storage control strategy based on the feasible region of photovoltaic acceptance. (Tang et al., 2019) took energy storage as the upper decision-maker and constructed the comprehensive income index of energy storage. The comprehensive income mainly considers the peak and valley price arbitrage and government subsidies. Finally, a bi-level optimal configuration model of the distributed energy storage system in the distribution network with the participation of aggregators is proposed. In terms of the joint planning of energy storage and transmission networks, (Jorgenson et al., 2018) compared and analyzed the respective effects of energy storage configuration and transmission network coordinated planning on reducing wind curtailment and light curtailment and found that the coordination planning of the two was superior to the mitigation effect of their respective planning. (Bustos et al., 2018) established a transmission expansion planning model to verify the various functions of energy storage and transmission networks from the perspective of wind power reduction. It is concluded that energy storage is not only a supplement to transmission lines but also an alternative to transmission lines, and the comprehensive effect of transmission lines and energy storage is better. (Liu W. et al., 2021) established the relevant revenue models from the grid side and the power market, power supply reliability, and power supply side and proposed an optimal allocation method of energy storage for incremental distribution systems based on the intelligent generation method of operation strategy. (Dvorkin et al., 2018) incorporated peak-valley arbitrage into the three-layer optimization model of energy storage, transmission networks, and market clearing to realize the joint planning of electrochemical energy storage capacity, power, and location with transmission networks. (Sun et al., 2021) analyzed the multiple incomes of energy storage from the power grid planning and operation level and constructed a multi-stage joint planning model of energy storage and transmission, so as to maximize the resource efficiency in the joint planning of energy storage and power grids. (Yang L. et al., 2020) proposed a robust chance-constrained programming model with the constraint of the wind curtailment rate to minimize the investment cost of energy storage. In terms of source-reservoir-network coordination planning, (Yang X. et al., 2020; Jiang et al., 2021) established the source-storage-grid joint planning model with the goal of minimizing the total investment cost of the system. (Jiang et al., 2021) comprehensively considered the renewable energy planning and the inter-regional interconnection income of power. (Yang X. et al., 2020) mainly considered the supply and demand balance of system flexibility and considered the influence of energy storage configuration on power supply and power grids. However, the above studies mainly focus on the planning and operation of energy storage and only optimize the allocation for the purpose of minimizing the investment or maximizing the total revenue of energy storage. These studies do not consider that the role of energy storage in the grid side and the power side is complex and simultaneous, and the revenue of energy storage is not calculated from many aspects. At the same time, due to the inadaptability of fixed time-of-use price caused by high proportion of wind power integration, the income accounting of energy storage cannot be scientifically and accurately carried out (Zhong et al., 2013), which seriously affects the application of energy storage in power systems.
Therefore, this work studies the source-storage-network joint planning method considering the comprehensive income of energy storage. First, considering the low return rate of energy storage, the income of the energy storage system is divided in detail from the planning level, and the accounting method of energy storage income is proposed. Second, considering the inadaptability of the original time-of-use electricity price after the renewable energy is connected to the grid, two dynamic electricity price formulation methods are proposed, named power trisection and time trisection. Then, a source-storage-transmission coordination planning model with peak-valley arbitrage as the direct income and the indirect income of the impact of energy storage allocation on the system is constructed. Finally, the effectiveness and economy of the proposed method are verified by Garver-6 system example analysis and comparative analysis with fixed time-of-use electricity price planning and conventional source-storage-transmission planning.
The main contributions of this study are as follows:
(1) From the perspective of comprehensive accounting of energy storage incomes, the accounting method of direct and indirect incomes of energy storage is proposed, which effectively solves the problem of low efficiency of energy storage cost recovery;
(2) Two dynamic pricing methods of power trisection and time trisection based on wind power fluctuation are proposed. The direct income of energy storage and the flexibility of the power system are improved at the same time.
(3) A source-storage-transmission coordinated planning model to maximize the comprehensive income of energy storage is constructed, which can comprehensively calculate the income of energy storage, promote the investment of energy storage in planning, improve the flexibility and supply capacity of the system, and solve the problem of low income of energy storage enterprises to a certain extent.
The rest of the article is organized as follows:
Section 2 describes, in detail, the accounting method for the comprehensive revenue of the energy storage system. Section 3 introduces the strategy of dynamic electricity price formulation and verifies the effectiveness of the method in this work through a case study. Section 4 constructs a source-storage-transmission planning model considering the comprehensive revenue of energy storage. The effectiveness and economy of the source-storage-transmission coordinated optimization method are verified by simulation results. Finally, Section 5 concludes the article.
2 Comprehensive Income Analysis of Energy Storage System
Energy storage systems have different applications in all aspects of power generation, transmission, electric distribution, and consumption in the power system. Therefore, considering only the peak-to-valley arbitrage of energy storage will be difficult to cover the economic incomes generated by energy storage in each link. This study sorts out the energy storage incomes from the planning level and divides the comprehensive incomes of energy storage into direct income and indirect income.
2.1 Direct Income
The direct income of energy storage is mainly the use of time-of-use electricity prices for peak-to-valley arbitrage. The direct income of energy storage is mainly peak-to-valley arbitrage using time-sharing electricity price. In the planning stage, peak-to-valley arbitrage is the simplest and most direct method of revenue accounting for energy storage companies. Energy storage is charged when the load is low (low electricity price) and discharged when the load is peak (high electricity price). Usually, the peak-to-valley price difference is used for profit; the schematic diagram is shown in Figure 1.
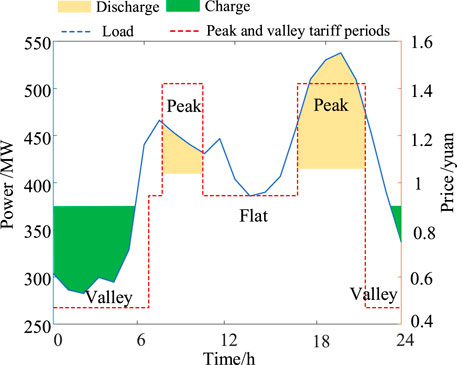
FIGURE 1. Schematic diagram of peak-valley arbitrage of energy storage.
2.2 Indirect Income
The indirect income of energy storage is the income generated by the beneficial impact on the power system with the configuration of energy storage. To accurately account for the indirect income of energy storage, the difference method is used to solve the problem of accounting for indirect income by comparing the system costs with and without energy storage. The reduced system cost is considered as the indirect income of energy storage.
The indirect income is calculated using the difference method, and the formula is shown in Eq. 1 as follows:
where CNES is the cost-effectiveness of technology without an energy storage system; CYES is the cost-effectiveness of technology with an energy storage system.
Based on the above methods, it is possible to calculate the reduced investment of conventional units ΔCY, the reduced investment of transmission lines ΔCT, the reduced cost of wind abandonment ΔCQ, and the reduced cost of network loss ΔCL. The specific calculation processes of ΔCY, ΔCT, ΔCQ, and ΔCL are shown in (Eqs 7-23).
3 Development of Dynamic Time-of-Use Electricity Prices
3.1 Analysis of Peak and Valley Fluctuation Characteristics of Netload
The volatility of netload will significantly change in the power system that has a high penetration of wind power, which is mainly reflected in the weakening of the waveform law and the diffusion of peak-valley distribution during the period. Figure 2 shows the peak and valley distribution of netload with different permeabilities. In the graph, the blue line segment represents the moment when the netload valley occurs and the red line segment represents the moment when the netload peak occurs. It can be seen that with the increase in wind power permeability, the peak-valley distribution will become more and more diffused. Therefore, peak and valley electricity prices based on load fluctuations are becoming less and less applicable as wind power penetration rises.
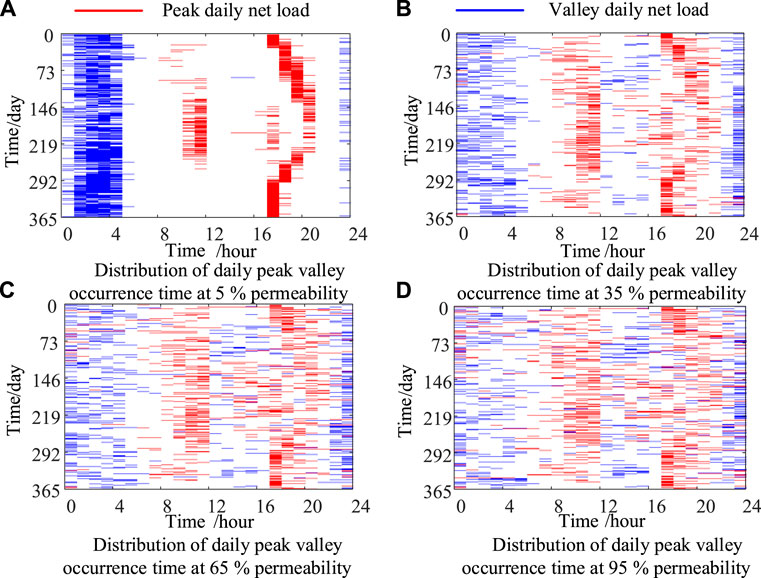
FIGURE 2. Distribution of peak and valley occurrence time.
3.2 Dynamic Peak-Valley Pricing Method
With the access of large-scale renewable energy to the power system, the trend of netload fluctuations is changeable and the regularity is weakened. There is a need to formulate dynamic time-of-use electricity prices based on the features of netload fluctuation. The following are the two methods named the power trisection method and the time trisection method.
3.2 1 Power Trisection Method
The power trisection method is to divide the peak-to-valley value of the netload into three equal parts using the day as a time scale, and the three parts are from high to low, corresponding to the peak, flat, and valley power values. The power trisection method calculation formula is shown in Eq. 2 as follows:
where Pmax and Pmin are the maximum and minimum netload, respectively. ΔP is the average power value after the trisection. L1 and L2 are the three bisectrix lines in the netload fluctuation range.
The formula for power at t time judgment is as follows:
where T1, T2, and T3 are the electricity price time at the peak, at the flat, and at the valley. sgn is the symbol function, namely, the bracket judgment established returns 1; otherwise, it returns 0.
This principle of this formulation is shown in Figure 3. The netload curve for 1 day is shown in Figure 3A, with the power values ordered from the largest to the smallest. The range of power value is divided into three equal parts, from the largest to the smallest to the peak (Pmax-L2), flat (L2-L1), and valley (L1-Pmin). The curve is shown in Figure 3B. According to the above, the period corresponding to the netload portion of the Pmax-L2 scale is defined as the peak electricity price. Similarly, the period corresponding to the L2-L1 scale is referred to as the flat electricity price, and the period corresponding to the period within the L1-Pmin scale is defined as the valley electricity price. The results are shown in Figure 3C. The sorted netload curve and electricity price curve are reordered according to time, and the final results are shown in Figure 3D.
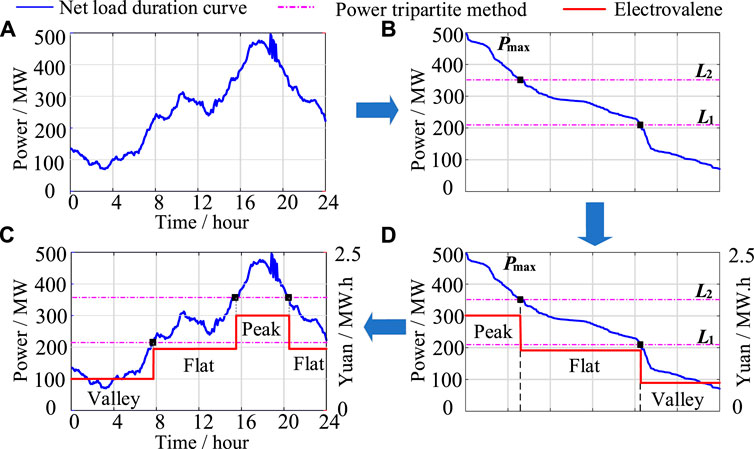
FIGURE 3. Dynamic electricity price-setting method of power trisection.
3.2.2 Time Trisection Method
The time trisection method is for sorting the netload power values from the largest to the smallest, generating a continuous power curve and dividing the entire time of the day into three equal parts. The corresponding power segments are defined as the peak, valley, and flat. The corresponding power segments are defined as the peak, flat, and valley. The formula for power at t time judgment is as follows:
where PT1 and PT2 are the points of intersection of the time trisection line and the continuous power netload curve. T1, T2, and T3 are the electricity price at peak time, at flat time, and at valley time, severally.
The principle of the time trisection method is shown in Figure 4. Figure 4A shows the netload curve for 1 day. The power values are sorted from the largest to the smallest. The range of the whole time is divided into three equal parts, from the largest to the smallest, peak (Pmax-PT1), flat (PT1- PT2), and valley (PT2-Pmin). The curves are shown in Figure 4B. According to the above, the netload portion of Pmax-PT1 corresponds to the time of peak electricity price. Similarly, the time corresponding to the netload portion of PT1- PT2 is the flat electricity price, and the time corresponding to the netload portion of PT2-Pmin is the valley electricity price. The results are shown in Figure 4C. The sorted netload curve and electricity price curve are reordered according to time, and the final results are shown in Figure 4D.
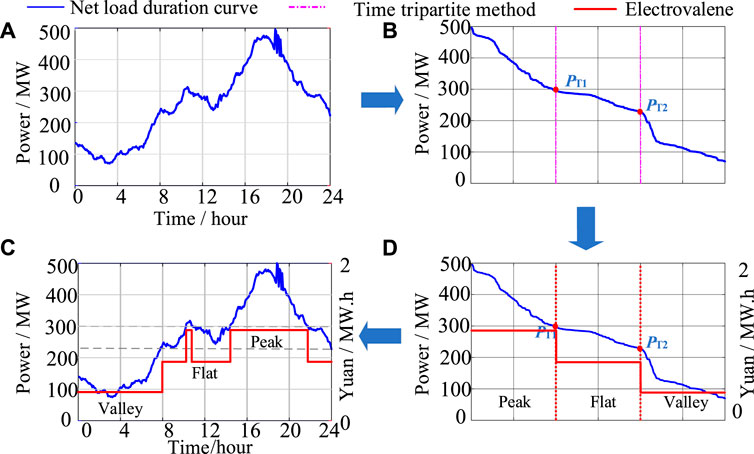
FIGURE 4. Dynamic electricity price-setting method of time trisection.
3.2.3 Validity Check of Dynamic Time-of-Use Electricity Price
In verifying the effectiveness of dynamic electricity price based on power trisection and time trisection, it is necessary to compare and analyze the impact of energy storage peak valley arbitrage on the netload curve under different electricity price strategies. Under the same capacity and power, the storage energy is discharged at the peak price and charged at the valley price, to make a profit. First, the netload curve under different wind power permeability is arbitraged with different electricity price formulation strategies. Then, the changes of the abandoned wind rate, peak-to-valley difference, and maximum value of netload curve after peak valley arbitrage are analyzed. The effect of dynamic time-of-use price on reducing wind abandonment, peak shaving, and valley filling is verified through quantitative calculation. The specific calculation conditions are described as follows: typical daily electricity consumption is 9067 MW h and the maximum power is 470 MW. For example, when the energy storage power is 200 MW and the storage capacity is 400 MW h, the calculation results are shown in Table 1, Supplementary Table S1, and Supplementary Figure S1. Table 1 shows the effects of different electricity price strategies on the wind abandonment rate, peak valley difference, and maximum value when the wind power permeability is 0.40%. Supplementary Figure S1 and Supplementary Table S1 show the time-of-use electricity price, netload curves, and statistical results before and after energy storage arbitrage in four scenarios with daily wind power penetration rates of 0, 20, 40, and 60%.
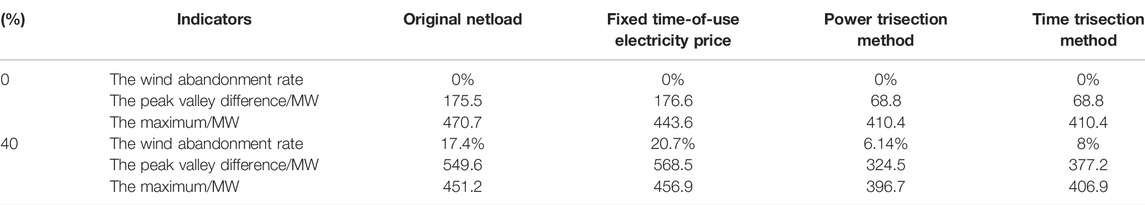
TABLE 1. Statistics of netload characteristics under different permeability and different time-of-use electricity prices.
With the increase in permeability, the peak-valley difference of fixed price will continue to increase. After the peak-valley arbitrage of energy storage, the abandonment rate will increase with the increase in permeability. This also shows that with the increase in permeability, the inadaptability of fixed time-of-use electricity price will further deteriorate. However, methods the article proposed for the dynamic electricity price can significantly reduce the wind abandonment rate, the peak valley difference, and the maximum netload.
4 Planning Model of Source-Storage-Transmission Considering the Comprehensive Income of Energy Storage
4.1 Objective Function
The coordinated source-storage-transmission optimization model that considers the comprehensive income s of energy storage is to maximize the total income s (direct income and indirect income) of the power grid with the storage system. The objective function is shown in Eq. 5.
where Cpva is the peak-to-valley arbitrage income of the dynamic time-of-use electricity price. ΔCY is the indirect income of the energy storage system in the power supply planning, namely, the difference between the investment cost of the new power source before and after the energy storage used on the power supply side. ΔCT in the plan is the difference between the investment cost of the new transmission line before and after the energy storage applied on the grid side. ΔCQ is the difference between the cost of wind abandonment before and after using the energy storage. ΔCL is the difference between the cost of network loss before and after using the energy storage. Iess is the investment cost of the energy storage system.
4.1.1 Direct Income
Direct income (peak-valley arbitrage) Cpva is calculated in Eq. 6 as follows:
where Wv-i is the charged power of energy storage during the load valley on the ith day. Wp-i is the charged power of energy storage during the load peak on the ith day. β is the energy storage efficiency. Cp is the electricity price at the peak load. Cv is the electricity price at the load valley.
4.1.2 Reducing Investment in Conventional Units
The ΔCY is calculated by reducing the investment of conventional units:
The formulas for calculating the cost of power planning before and after the application of energy storage are shown as follows:
where CY is the investment cost of the original boundary power supply planning. CYN is the investment cost of the power supply planning after the energy storage used. Gk is the investment 0,1 variable of the thermal power unit k. Pgk is the installed capacity of the unit k. Cgk is the project cost of installing this capacity of the unit k. Wg is the selected unit set. PgkN is the installed capacity of the unit k after the application of energy storage. PESS(t) is the power at time t of energy storage, and PL(t) is the load at time t.
4.1.3 Reducing Investment in Transmission Lines
The ΔCT is calculated by reducing the investment in transmission lines as shown in Eq. 11.
The planning boundary before configuring energy storage is the maximum load, and the calculation formula is shown in Eq. 12 as follows:
PLi(t) is the load of node i at time t, and PL is the planning boundary.
The planning boundary after energy storage configured is the maximum value of the corrected netload, and the calculation formulas are shown as follows:
PLN is the planning boundary after energy storage configured, PLNi(t) is the corrected load of node i at time t, PESS(t) is the power of storage energy at time t, and ki is the proportion of overall energy storage configuration at node i.
The planning and construction cost of the transmission grid before and after the energy storage invested is consistent with the formula in Eq. 15:
where CT is the investment cost of the transmission line under the original boundary. CTN is the investment cost of the transmission line after the energy storage is applied. ni is the number of construction times of the ith candidate line. Ci is the per unit length price of the ith candidate line. KL is the power cost per unit length line. Li is the length of the ith candidate line. Zi is the 0–1 decision variable for the investment of the ith candidate line. PL-i is the transmission capacity of the ith candidate line. Wl is the collection of the candidate lines.
4.1.4 Reducing Wind Curtailment Costs
The reduced wind curtailment cost is set as ΔCQ, which is calculated in Eq. 16:
where CQ is the cost of system wind abandonment before energy storage is used. CQN is the cost of system wind abandonment after energy storage is used.
The cost of wind curtailment is calculated in Eq. 17:
where KQ is the unit penalty cost of abandoned wind power. Ts is the cost recovery period. WQ is the abandoned wind power before energy storage is used, and WQN is the abandoned wind power after energy storage is used.
The equation of the annual wind power curtailment before the energy storage is put into use is constructed in Eq. 18:
The calculation of the annual wind power curtailment after the energy storage is put into operation is shown in Eq. 19 as follows:
where Pnet(t) is the netload at time t. Pess(t) is the output power of energy storage at time t. Pmin g is the minimum technical output of conventional units.
4.1.5 Reducing Network Loss Costs
After configuring the energy storage system, peak-shaving and valley-filling are used to improve the power flow distribution in the power grid and reduce the cost caused by power grid losses. This cost of grid loss is calculated as follows:
The power loss of the power grid is calculated by using the node equivalent power method shown in Eq. 21:
According to Equation 21, the calculation for line loss cost before applying energy storage is shown in Eqs. 22 and 23:
where n is the number of system nodes. Ii(t) is the electric current at the ith node at time t. Pi(t) is the active load power at the ith node at time t. Ui(t) is the voltage at the ith node at time t. cos α is the power factor. Ri is the ith node. Iess-i(t) is the electric current of the energy storage system on the ith node at time t. Pess-i(t) is the active output power of the energy storage system on the ith node at time t. e(t) is the grid electricity price at the time t in the system.
4.2 Restrictions
4.2.1 Power Balance Constraint
The power balance constraints are shown in Eq. 24:
where
4.2.2 The Upper and Lower Limits of the Output of Thermal Power Units
The output limits of thermal power units are shown in Eq. 25:
4.2.3 The State of Charge (SOC) of Full Charge and Discharge Constraints for Using the Energy Storage System
The SOC limits of using the energy storage system are shown in Eq. 26:
where δSOCmin and δSOCmax are the lower limit and upper limit of the SOC of the energy storage device, respectively. δSOC(0) and δSOC(24) are the states of charge of the energy storage device at times 0 and 24, respectively, and both are equal.
4.2.4 Line Flow Constraint
The limits of line flow are shown in (27):
where ai-j is the load rate on the transmission line from node i to node j, and its value range is ai-j∈ (0,1]. Pi-j is the transmitting power in the transmission line from node i to node j, and Pi-j,max is the maximum value of the line transmission capacity.
4.3 Solution Process of the Source-Storage-Transmission Planning Model Considering Comprehensive Income of Energy Storage
Based on the given annually planned target load, there are two categories generated due to the indirect income of energy storage calculated using different methods. The specific solution process is shown in Figure 5.
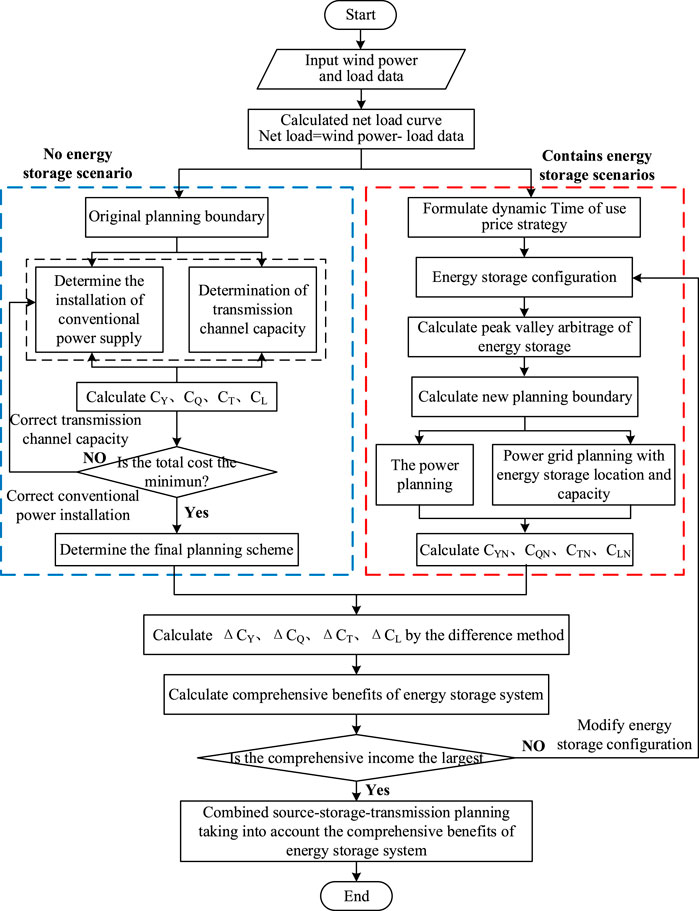
FIGURE 5. Schematic block diagram of the source-storage-transmission coordinated planning method considering comprehensive incomes of energy storage.
One is that the original boundary is applied in planning conditions without energy storage. In this case, the construction costs on source side CY and grid side CT are calculated directly. The wind abandonment cost CQ and the grid loss cost CL are obtained through the production sequence simulation.
Another one is that the source-storage-grid planning is coordinated with energy storage processed in the following steps. The first step is to formulate the dynamic time-of-use electricity price for each typical daily scenario based on wind power and load data. The second step is to provide the initial values of the energy storage configuration and the dynamic time-sharing electricity price strategy. The direct income of the energy storage system is obtained after the time series simulation, and a new planning boundary is generated. The third step is to conduct power planning within the new planning boundary to calculate the power planning construction cost CYN and to carry out the site and capacity selection of the energy storage system used in grid planning. In this way, the power grid planning and construction cost CTN are obtained. Finally, a production simulation is performed to obtain the abandonment cost CQN and network loss cost CLN. The indirect income of energy storage is calculated using the difference method, and the comprehensive income accounting of energy storage is completed. If the comprehensive income is the maximum value, it is the optimal solution and outputs the final planning scheme; if the integrated return is not the maximum value, the energy storage configuration is corrected and returned to the second step for recalculation until the optimal scheme of source-storage-transmission planning considering the integrated return of energy storage is derived.
5 Case Study
5.1 Basic Data
To verify the effectiveness of the proposed source-storage-transmission coordination optimization method that considers the comprehensive incomes of energy storage, the planning model is performed in the Garver-6 system that matches the measured data of a certain power grid in Northeast China. In this data system, the total real load power is 710MW, and the installed capacity of wind power at Node 6 is 2000 MW, which reaches 30% wind power penetration. The total system load, typical scenarios, and corresponding probabilities of wind power are shown in Supplementary Figure S2 and Supplementary Table S2. The topology and parameters of the Garver-6 system are shown in Supplementary Table S3 and Supplementary Figure S3. The typical load scenarios of five nodes are shown in Supplementary Figure S4.
The specific calculation conditions are described as follows:
(1) The construction cost of thermal power unit: 5 million yuan/MW;
(2) The penalty cost of abandoning wind power is 830 yuan/MW.h;
(3) The unit capacity cost of energy storage is 1.5 million yuan/MW. The converter cost per megawatt is 250,000 yuan, and the life span of energy storage is 10 years;
(4) The capacity and length cost of the 220-kV transmission line is 10,000 yuan/(MWkm);
(5) The planning cycle is 20 years
(6) The setting categories of time-of-use electricity prices are as follows: the peak hour electricity price is 1.42 yuan/kW.h. The valley hour electricity price is 0.47 yuan/kW.h, and the normal electricity price is 0.945 yuan/kW.h.
5.2 Source-Storage-Transmission Planning Scheme Under Different Pricing Strategies
In this study, the fixed time-sharing electricity price strategy and the two dynamic electricity price strategies are used for source-storage transmission coordination planning, respectively. The dynamic electricity price proposed in this study only changes the time of peak-valley leveling, the electricity price is fixed, and the change of electricity price will be added in the subsequent study.
To calculate the comprehensive incomes of energy storage based on the different price methods, it is necessary to know the planning condition and costs of the power supply and grid before and after energy storage is applied.
When there is no usage of energy storage, the installed capacity of thermal power on the supply side, the newly built lines on the power grid side, and the corresponding costs are shown in Table 2.
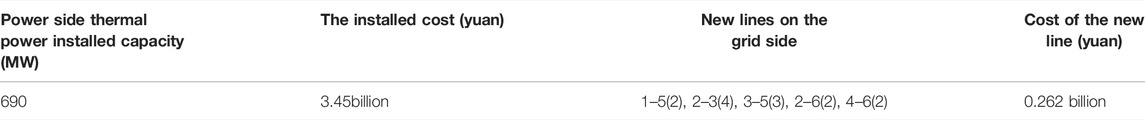
TABLE 2. Planning scheme of the power grid side without energy storage input.
5.2.1 Source-Storage-Transmission Planning Scheme Under Dynamic Time-of-Use Electricity Price
After wind power is accessed, the fluctuation law of netload is greatly weakened, which is extremely different from the fluctuation law of the original load. The purpose of this study is to verify the dynamic electricity price method proposed in this study. The coordinated planning of the source-storage transmission is conducted under the dynamic time-sharing electricity price strategy generated using the power trisection method and the time trisection method, respectively.
(1) Power Trisection Method
Dynamic electricity price is established using the power trisection method. The dynamic electricity price of each typical scene is shown in Supplementary Figure S5.
Based on the dynamic time-of-use electricity price, the coordinated planning of source-storage-transmission considering the comprehensive incomes of energy storage is carried out.
Under the power trisection dynamic time-of-use electricity price strategy, the coordinated planning of sources-storage-transmission considering the comprehensive income of energy storage is carried out. The energy storage investment cost is 2.385 billion yuan, and the peak-valley arbitrage income is 4.39 billion yuan. The thermal power installation investment is reduced by 677 million yuan, and the transmission line investment is decreased by 40 million yuan. Finally, the comprehensive income of energy storage is 4.511 billion yuan. It is shown in Table 3 and Figure 6 for the optimal planning scheme of the time-of-use electricity price strategy written using power trisection. The relationship between energy storage configuration and total comprehensive incomes is shown in Figure 7.
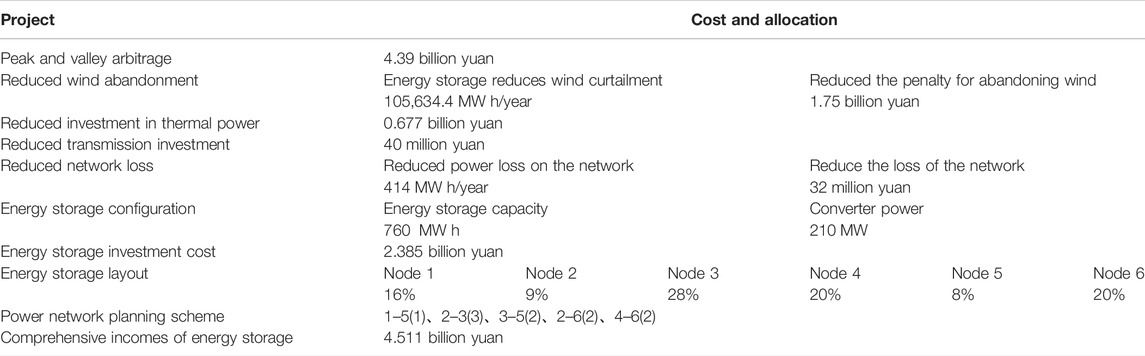
TABLE 3. Source-storage-transmission planning scheme under power trisection strategy.
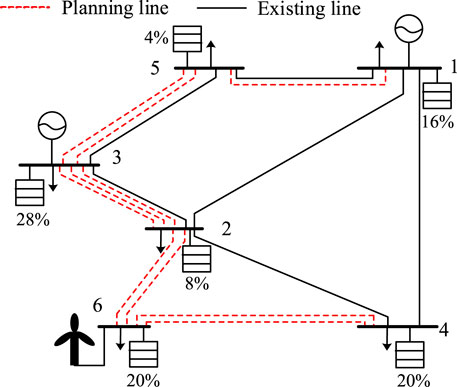
FIGURE 6. Power grid planning scheme under power trisection.
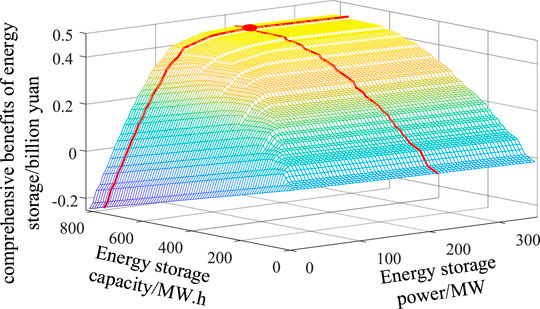
FIGURE 7. Optimal process of coordinated planning of source-storage-transmission under dynamic time-of-use; electricity price based on the power trisection method.
It can be seen from Figure 7 that plotting of energy storage configuration and comprehensive income is presented as an up-convex surface. When there is no energy storage configuration, the comprehensive income is 0. With the increasing energy storage power and capacity configuration, the comprehensive incomes will also increase. The central point in the figure is the optimal configuration of energy storage.
(2) Time Trisection Method
Under the time trisection dynamic time-of-use electricity price strategy, the coordinated planning of sources-storage-transmission considering the comprehensive income of energy storage is carried out. The energy storage investment cost is 2.558 billion yuan, and the peak-valley arbitrage income is 5.417 billion yuan. The thermal power installation investment is reduced by 784 million yuan and the transmission line investment is decreased by 20 million yuan. Finally, the comprehensive income of energy storage is 5.231 billion yuan.
The detailed planning scheme is shown in Table 4 and Figure 8. By comprehensively comparing the data in Table 4 and Table 5, it shows that the time trisection method is better than the power trisection method on the whole. In terms of reducing investment in thermal power and the power grid, the time trisection method increasing the comprehensive income by 720 million yuan is compared with the power trisection method.

TABLE 4. Source-storage-transmission planning under the time trisection strategy.
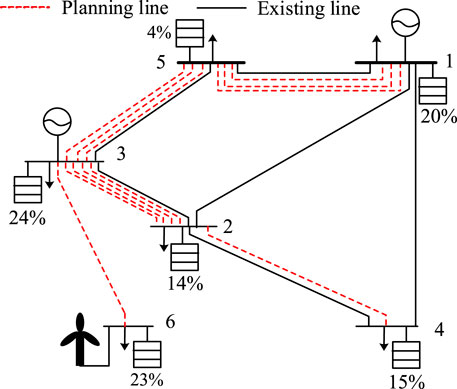
FIGURE 8. Power grid planning scheme under time trisection.
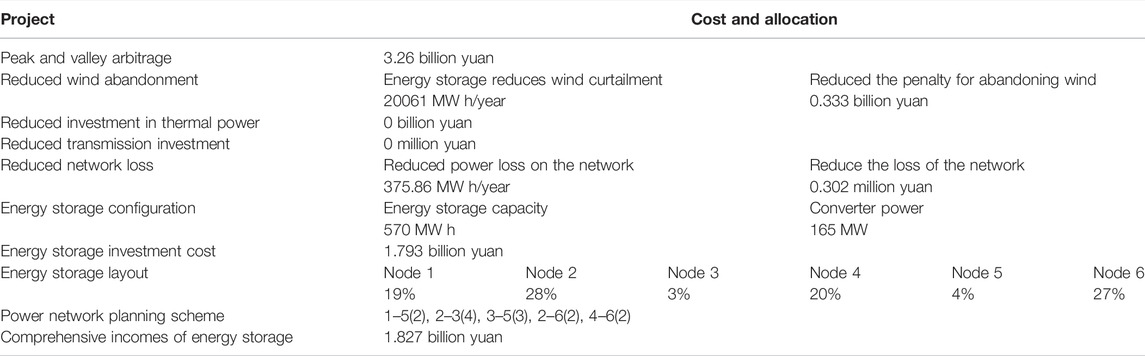
TABLE 5. Planning scheme under fixed time-of-use electricity price strategy.
In terms of energy storage and wind abandoning quantity reduction, the time three equal method increasing the income by 72 million yuan is compared with the power three equal methods. The reason for such a result is that the dynamic time-sharing electricity price established using the time trisection method can eliminate the problem of the mismatching of charging and discharging time of energy storage caused by the power trisection method. In other words, the dynamic time-sharing electricity value established using the power trisection method may result in unequal charging time and discharging time of energy storage and no space for charging and discharging. Typically, scenario 1 in Supplementary Figure S5 is the time-of-use electricity price established using the trisection method of power.
5.2.2 Planning Scheme Under Fixed Time-of-Use Electricity Price Strategy
The fixed electricity price strategy adopts the electricity price of the power grid in Northeast China. The peak hours are 8:00–11:00 in the morning and 18:00–23:00.23:00–7:00 valley time; usually 7:00–8:00 in the morning, 11:00–18:00 afternoon. Peak valley arbitrage is carried out for valley charging and peak discharging of the energy storage system. The planning model proposed in this study is used to carry out the coordinated source-storage-transmission planning. The planning scheme is shown in Table 5 and Figure 9.
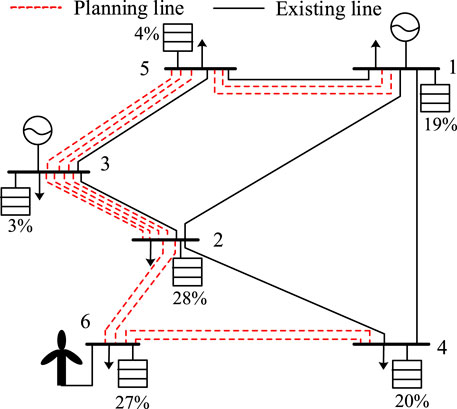
FIGURE 9. Power grid planning scheme under fixed time-of use-electricity price.
The fixed time-of-use electricity price cannot adapt to the netload fluctuations after wind power access, so the role energy storage played in peak reduction and valley filling in the arbitrage process is not effective. In this planning scheme, the reduction value of thermal power investment and transmission line investment after energy storage input is 0.
Compared with the investment in energy storage configuration under the fixed tariff strategy, the power trisection and time trisection dynamic time-sharing tariff strategies increase by 592 million yuan and 765 billion, respectively. In addition, the peak-valley arbitrage, the reduction of abandoned wind power before and after using energy storage, thermal power investment, and transmission investment are also better than the planning scheme under the fixed tariff strategy, and the final comprehensive incomes of energy storage increase by 2.684 billion yuan and 3.404 billion yuan, respectively. The comparison of source-storage-transmission planning schemes conducted by the fixed price, power trisection, and time trisection are shown in Figure 10, which intuitively show that fixed price is not suitable for wind power access with high permeability.
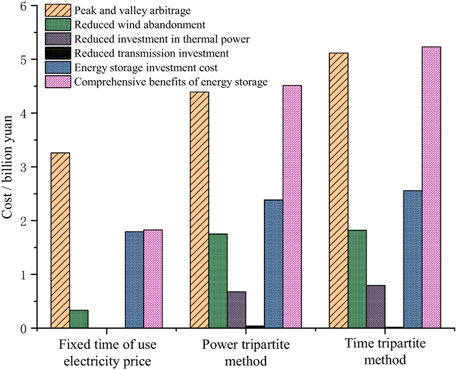
FIGURE 10. Economic comparison of the three methods.
6 Conclusion
This study addresses the problems of the single role of energy storage and incomplete consideration of incomes in previous planning, proposes two dynamic electricity price formulation methods, namely, power trisection and time trisection, explores the impact of fixed time-sharing electricity price and dynamic time-sharing electricity price on flexibility supply, constructs a coordinated source-storage-transmission planning method that takes into account the comprehensive incomes of energy storage, and verifies the effectiveness of the proposed method through example analysis. The main conclusions are as follows.
(1) This study proposes two dynamic electricity price methods based on netload fluctuation power trisection and time trisection, realizing that energy storage can maximize filling system flexibility in peak-valley arbitrage.
(2) This study proposes a method of accounting for the return on energy storage that takes into account direct and indirect income and demonstrates through examples that the return on investment in energy storage can be significantly increased in this accounting method, in which the cost of wind abandonment can be reduced by 4.255 times and 4.471 times for the power trisection method and the time trisection method, respectively, compared to the investment in wind abandonment at a fixed time-sharing electricity price, and the final comprehensive return on energy storage is increased by 146.9 and 186.3%, respectively.
(3) A coordinated source-storage-transmission planning method that takes into account the comprehensive incomes of energy storage can comprehensively account for the incomes of energy storage and promote the input of energy storage in planning, thereby enhancing the system’s flexibility supply capacity, reducing the cost of abandoned wind, and, to a certain extent, overcoming the difficulties of energy storage enterprises.
In the formulation of dynamic electricity price rules, this study only considers the effect of the change of electricity price occurrence time on net load but does not consider the impact of the change of electricity price on it. Considering the mutual influence between demand-side response and electricity price (Zhong et al., 2013), we will plan to add the incentive coupon mechanism to induce demand-side response on the basis of the method in this study to explore the impact on the source-storage- transmission planning.
Data Availability Statement
The original contributions presented in the study are included in the article/Supplementary Material; further inquiries can be directed to the corresponding authors.
Author Contributions
GY contributed to the conception of the study; XL performed the experiment and wrote the manuscript; XY contributed significantly to analysis and manuscript preparation; GC and JG performed the data analyses; QG helped perform the analysis with constructive discussions.
Funding
This study was supported by the Northeastern Electric Power University Doctoral Research Start-up Fund (BSJXM-2021206) and by the National Key R&D Program of China (2017YFB0902200).
Conflict of Interest
GC was employed by Northeast Electric Power Design Institute Company Limited of China Power Engineering Consulting Group.
The remaining authors declare that the research was conducted in the absence of any commercial or financial relationships that could be construed as a potential conflict of interest.
Publisher’s Note
All claims expressed in this article are solely those of the authors and do not necessarily represent those of their affiliated organizations, or those of the publisher, the editors, and the reviewers. Any product that may be evaluated in this article, or claim that may be made by its manufacturer, is not guaranteed or endorsed by the publisher.
Acknowledgments
I would like to express my sincere gratitude to Brother Xu Minghong. I was particularly moved and encouraged by his detailed comments and suggestions when revising my thesis. Without his supervision and guidance, I could not have finished the task.
Supplementary Material
The Supplementary Material for this article can be found online at: https://www.frontiersin.org/articles/10.3389/fenrg.2022.907338/full#supplementary-material
References
Aktar, M. A., Alam, M. M., and Al-Amin, A. Q. (2021). Global Economic Crisis, Energy Use, CO2 Emissions, and Policy Roadmap amid COVID-19. Sustain. Prod. Consum. 26, 770–781. doi:10.1016/j.spc.2020.12.029
Bustos, C., Sauma, E., Torre, S., Aguado, J. A., Contreras, J., and Pozo, D. (2018). Energy Storage and Transmission Expansion Planning: Substitutes or Complements? IET Gener. Transm. & Distrib. 12, 1738–1746. doi:10.1049/iet-gtd.2017.0997
Cai, J., Xu, Q., Yuan, X., and Wang, X. (2019). Configuration Strategy of Large-Scale Battery Storage System Orienting Wind Power Consumption Based on Temporal Scenarios. High. Volt. Eng. 45, 993–1001. doi:10.13336/j.1003-6520.hve.20190226041
Chen, Y., Wei, W., Li, M., Chen, L., and Catalao, J. P. S. (2022). Flexibility Requirement when Tracking Renewable Power Fluctuation with Peer-To-Peer Energy Sharing. IEEE Trans. Smart Grid 13, 1113–1125. doi:10.1109/tsg.2021.3128631
Cui, Y., Xu, B., Zhang, J., Yan, G., Wang, M., and Zheng, X. (2016). Control Strategy and Economic Evaluation of Energy Storage System Based on Feasible Area of PV Power. Acta Energiae Solaris Sin. 37, 2519–2525. doi:10.3969/j.issn.0254-0096.2016.10.011
Dvorkin, Y., Fernandez-Blanco, R., Wang, Y., Xu, B., Kirschen, D. S., Pandzic, H., et al. (2018). Co-Planning of Investments in Transmission and Merchant Energy Storage. IEEE Trans. Power Syst. 33, 245–256. doi:10.1109/tpwrs.2017.2705187
Heggarty, T., Bourmaud, J.-Y., Girard, R., and Kariniotakis, G. (2019). Multi-temporal Assessment of Power System Flexibility Requirement. Appl. Energy 238, 1327–1336. doi:10.1016/j.apenergy.2019.01.198
Jiang, H., Du, E., Jin, C., Xiao, J., Hou, J., and Zhang, N. (2021). Optimal Planning of Multi-Time Scale Energy Storage Capacity of Cross-National Interconnected Power System with High Proportion of Clean Energy. Proc. CSEE 41, 2101–2115. doi:10.13334/j.0258-8013.pcsee.201634
Jiang, S., Wan, C., Wan, C., Chen, C., Cao, E., and Song, Y. (2018). Distributed Photovoltaic Generation in the Electricity Market: Status, Mode and Strategy. Csee Jpes 4, 263–272. doi:10.17775/cseejpes.2018.00600
Jorgenson, J., Denholm, P., and Mai, T. (2018). Analyzing Storage for Wind Integration in a Transmission-Constrained Power System. Appl. Energy 228, 122–129. doi:10.1016/j.apenergy.2018.06.046
Liu, W., Yang, M., Wang, J., and Teng, Y. (2021a). Energy Storage Planning for Incremental Power Distribution Systems Based on the Intellectual Generating Method of Operational Strategies. Proc. CSEE 41, 3317–3329+3658. doi:10.13334/j.0258-8013.pcsee.200655
Liu, Y., Wang, W., Wang, X., and Han, Y. (2021b). Optimization of Storage Capacity Allocation in Wind Farm Cluster Based on Ant Lion Optimization Algorithm. Acta Energiae Solaris Sin. 42, 431–437. doi:10.19912/j.0254-0096.tynxb.2018-0851
Sadeghian, O., Oshnoei, A., Khezri, R., and Muyeen, S. (2020). Risk-constrained Stochastic Optimal Allocation of Energy Storage System in Virtual Power Plants. J. Energy Storage 31, 101732. doi:10.1016/j.est.2020.101732
Sun, W., Liu, W., Pei, L., Xiang, W., and Li, H. (2021). Multistage Energy Storage-Transmission Network Joint Planning Considering the System Value of Energy Storage under the Background of High Penetration Renewable Energy. High. Volt. Eng. 47, 983–993. doi:10.13336/j.1003-6520.hve.20200352
Sun, W., Song, H., Qin, Y., and Li, H. (2020). Energy Storage System Optimal Allocation Considering Flexibility Supply and Demand Uncertainty. Power Syst. Technol. 44, 4486–4497. doi:10.13335/j.1000-3673.pst.2020.0667
Tang, Q., Xu, W., Ye, X., Sheng, L., Gou, J., and Liu, Y. (2019). Optimized Configuration of Distributed Energy Storage System in Distribution Network Considering the Participation of Aggregators. Power Syst. Prot. Control 47, 83–92. doi:10.19783/j.cnki.pspc.181270
Yang, L., Cao, Y., Wei, W., Chen, L., and Mei, S. (2020a). Configuration Method of Energy Storage for Wind Farms Considering Wind Power Uncertainty and Wind Curtailment Constraint. Automation Electr. Power Syst. 44, 45–52. doi:10.7500/AEPS20200224004
Yang, X., Mu, G., Chai, G., Yan, G., and An, J. (2020b). Source-storage-grid Integrated Planning Considering Flexible Supply-Demand Balance. Power Syst. Technol. 44, 3238–3246. doi:10.13335/j.1000-3673.pst.2020.0753
Zhai, S., Zhou, H., Wang, Z., and He, G. (2020). Analysis of Dynamic Appliance Flexibility Considering User Behavior via Non-intrusive Load Monitoring and Deep User Modeling. Csee J. Power Energy Syst. 6, 41–51. doi:10.17775/CSEEJPES.2019.02100
Zhang, R., Jiang, T., Jiang, T., Li, G., Chen, H., Li, X., et al. (2018). Day-ahead Scheduling of Multi-Carrier Energy Systems with Multi-type Energy Storages and Wind Power. Csee Jpes 4, 283–292. doi:10.17775/cseejpes.2017.01250
Zhao, B., Li, D., Wu, Z., Zhang, X., Wang, X., and Tang, Y. (2021). Capacity Optimal Sizing of Island Microgrid Clusters Based on the Target of 100% Green Energy Power Supply. Proc. CSEE 41, 932–946. doi:10.13334/j.0258-8013.pcsee.191903
Zhong, H., Xie, L., and Xia, Q. (2013). Coupon Incentive-Based Demand Response: Theory and Case Study. IEEE Trans. Power Syst. 28, 1266–1276. doi:10.1109/tpwrs.2012.2218665
Nomenclature
Cgk the project cost of installing this capacity of the unit k
PL-i the transmission capacity of the ith candidate line
Ci the per unit length price of the ith candidate line
PL the planning boundary
CL the grid loss cost before energy storage is used
PLN the planning boundary after energy storage configured
CLN the grid loss cost after energy storage is used
PLNi(t) the corrected load of node i at time t
CNES the cost-effectiveness of technology without an energy storage system
Pmax the maximum netload
cos α the power factor
Pmin the minimum netload
Cp the electricity price at the peak load
Pming the minimum technical output of conventional units
Cpva the peak-to-valley arbitrage income of the dynamic time-of-use electricity price
Pnet(t) the netload at time t
CQ the cost of system wind abandonment before energy storage is used
PT1 the lower point of intersection of time trisection line and continuous power netload curve
CQN the cost of system wind abandonment after energy storage is used.
PT2 the upper point of intersection of time trisection line and continuous power netload curve
CT the investment cost of the transmission line under the original boundary
Pw(t) the output power of wind power generation at time t
CTN the investment cost of the transmission line after the energy storage is applied
Ri the ith node
Cv the electricity price at the load valley
sgn the symbol function
CY the investment cost of the original boundary power supply planning
Ts the cost recovery period
CYES the cost-effectiveness of technology with an energy storage system
T1 the electricity price time at the peak
CYN the investment cost of the power supply planning after the energy storage used
T2 the electricity price time at the flat
e(t) the grid electricity price at the time t in the system
T3 the electricity price time at the valley
Gk the investment 0–1 variable of the thermal power unit k
Ui(t) the voltage at the ith node at time t
Iess the investment cost of energy storage system
Wg the selected unit set
Iess-i(t) the electric current of the energy storage system on the ith node at time t
Wp-i the charged power of energy storage during the load peak on the i-th day
Ii(t) the electric current at the ith node at time t
WQ the abandoned wind power before energy storage is used
ki the proportion of overall energy storage configuration at node i
WQN the abandoned wind power after energy storage is used
KL the power cost per unit length line
Wv-i the charged power of energy storage during the load valley on the ith day
KQ the unit penalty cost of abandoned wind power
Wl the collection of the candidate lines
Li the length of the ith candidate line
Zi the 0–1 decision variable for the investment of the ith candidate line
L1 the three bisectrix lines in the netload fluctuation range
ai-j the load rate on the transmission line from node i to node j
L2 the three bisectrix lines in the netload fluctuation range
β the energy storage efficiency
N the number of system nodes
δSOCmax the upper limit of the SOC of the energy storage device
ni the number of construction times of the ith candidate line
δSOCmin the lower limit of the SOC of the energy storage device
Pess-i(t) the active output power of the energy storage system on the ith node at time t
δSOC(0) the states of charge of the energy storage device at time 0
PESS(t) the power at time t of energy storage
δSOC(24) the states of charge of the energy storage device at time 24
Pgk the installed capacity of the unit k
ΔP the average power value after the trisection
PgkN the installed capacity of the unit k after the application of energy storage
ΔCY the indirect income of the energy storage system in the power supply planning, namely, the difference between the investment cost of the new power source before and after the energy storage used on the power supply side
Pi(t) the active load power at the ith node at time t
ΔCT the difference between the investment cost of the new transmission line before and after the energy storage applied on the grid side
Pi-j the transmitting power in the transmission line from node i to node j
ΔCQ the difference between the cost of wind abandonment before and after using the energy storage
Pi-j,max the maximum value of the line transmission capacity
ΔCL the difference between the cost of network loss before and after using the energy storage
PL(t) the total system load power at time t the load at time t
ΔPQ(t) the abandonment power at time t
PL(t) the total system load power at time t the load at time t
ΔPloss(t) the power loss at time t
PLi(t) the load of node i at time t
Keywords: energy storage, comprehensive incomes, flexibility, dynamic electricity price, source-storage-transmission
Citation: Yan G, Liu X, Yang X, Chai G, Guo Q and Gui J (2022) Combined Source-Storage-Transmission Planning Considering the Comprehensive Incomes of Energy Storage System. Front. Energy Res. 10:907338. doi: 10.3389/fenrg.2022.907338
Received: 29 March 2022; Accepted: 03 May 2022;
Published: 20 June 2022.
Edited by:
Shiwei Yu, China University of Geosciences Wuhan, ChinaCopyright © 2022 Yan, Liu, Yang, Chai, Guo and Gui. This is an open-access article distributed under the terms of the Creative Commons Attribution License (CC BY). The use, distribution or reproduction in other forums is permitted, provided the original author(s) and the copyright owner(s) are credited and that the original publication in this journal is cited, in accordance with accepted academic practice. No use, distribution or reproduction is permitted which does not comply with these terms.
*Correspondence: Xiuyu Yang, eWFuZ3hpdXl1MjAxMUAxNjMuY29t