 Jing Shen
 Changheng Zhao
- 1Big Data Modeling and Intelligent Computing Research Institute, Hubei University of Education, Wuhan, China
- 2School of Economics, Lanzhou University, Lanzhou, China
To solve the environmental problems caused by climate change, the Paris Agreement urges China to accelerate the pace of CO2 emission reduction. Carbon trading and carbon tax have been considered the key instruments in reducing CO2 emissions. The focus of this article is not only to examine the impact of carbon trading and the carbon tax policy on China’s macroeconomy but also to study the “carbon trading–carbon tax” mixed policy and make a comparative analysis based on the computable general equilibrium (CGE) model. We found that the mixed policy is more favorable to China’s macroeconomy than a single carbon emission reduction policy and is conducive to improving people’s welfare. If a carbon tax is carried out, a relatively mild and low carbon tax rate should be adopted to achieve China’s carbon emission reduction goal and have a favorable impact on the macroeconomy. The main purpose of this article is to provide a theoretical basis and policy advices for the Chinese government in formulating innovative carbon reduction policies.
1 Introduction
As the world’s largest emitter of greenhouse gases, China accounts for about 30% of the world’s total carbon emissions. Carbon emission reduction is a major environmental problem facing China (Jiang et al., 2018). As early as 2011, China launched a pilot program of carbon emission trading in seven cities and provinces, including Beijing, Shanghai, Tianjin, Chongqing, Hubei, Guangdong, and Shenzhen. After nearly a decade of exploration, as of November 2020, carbon markets in the pilot provinces and cities have covered more than 20 industries, including steel, power, and cement, with nearly 3,000 enterprises. The cumulative trading volume quota is about 430 million tons of carbon dioxide, and the cumulative trading volume is nearly 10 billion yuan. On 16 July 2021, the national carbon emission trading market was officially launched, covering more than 4.5 billion tons of carbon emissions annually, making it the largest carbon market covering greenhouse gas emissions in the world. Carbon emission trading and carbon tax are the two main carbon emission reduction tools based on the market mechanism, which is a classic research proposition of environmental economics to argue over their merits (Zhang et al., 2022).
A large number of studies have proved that compared with traditional policy instruments based on administrative orders, economic incentives such as emission trading schemes and carbon taxes have absolute advantages in saving transaction costs, promoting emission reduction technology innovation, and stimulating the enthusiasm of participants (Bi et al., 2019; Tran et al., 2019; Alkaabneh et al., 2021). These methods have become the primary means of controlling carbon emissions in developed countries, including Britain, France, Germany, Australia, and Sweden. Their experience shows that carbon trading and carbon taxes play an essential role in reducing carbon emissions (Carl and Fedor, 2016; Jiang et al., 2018).
However, the emission reduction cost and incentive effect of emissions trading systems and carbon taxes vary obviously in reality. Carbon trading has a better emission reduction incentive effect than carbon tax (Wang et al., 2021; Wu and Yang, 2021), although both can reduce emissions by updating production equipment to improve production efficiency (Zhou et al., 2019), but the imposition of carbon tax will squeeze the profit space of enterprises. Carbon emission enterprises are likely to pass on the extra cost brought by carbon tax to the consumers or downstream producers of the industrial chain by raising the price of their products (Bai and Chen, 2016), which ultimately leads to the deterioration of the overall economy, such as decreased GDP and consumption and increased investment (Tang et al., 2015; Liu et al., 2017).
Carbon tax is a tax-based pricing mechanism that is easier to implement than emission trading (Corradini et al., 2018; Shi et al., 2019). Alkaabneh argued that a carbon tax improves the quality of the environment and offsets the other taxes paid by enterprises (Alkaabneh et al., 2021). This view has been verified. Bohringer and Müller (2014)found that using a carbon tax to offset other enterprise taxes would expand the overall economy and short-run employment. More than that, carbon tax can be used for inclusive green growth by recycling carbon tax revenue for investment to households to improve the distribution of income (Vijay et al., 2020).
The computable general equilibrium (CGE) model has been widely used as an effective tool for analyzing policy effects. The CGE model originated from the general equilibrium theory of Walras. Its most prominent characteristic is that the economic system is regarded as a whole, which can reflect the input–output relationship between the whole social–economic activities and all factors (Carrera et al., 2015). These models are mainly used to assess the positive effects of carbon tax or carbon trading on reducing carbon emissions and the negative impacts on the macroeconomy and social welfare (Liu et al., 2017; Tang et al., 2019). Some scholars also used the CGE model to explore the impact of carbon tax on China’s environment and economy (Liu and Lu, 2015). For example, Guo et al. used the CGE model and found that a carbon tax policy would significantly reduce the consumption of fossil fuels and have a negative impact on economic growth. Shi et al. (2019) developed a dynamic computable general equilibrium model to explore the possible impacts of different carbon tax conditions on the energy consumption of the construction sector and the macroeconomy of China. Some other scholars used the CGE model to study the pricing of carbon emission right and the transaction cost of carbon emission reduction in carbon trading mechanisms. For example, Jiang H. D. et al. (2022a), Jiang H. D. et al. (2022b) incorporated the co-benefits of carbon abatement policies into the carbon marginal abatement cost curves and evaluated the total abatement costs and cost-saving effects for China to achieve their nationally determined contributions target. Liu et al. (2019) studied the subsidy and penalty mechanisms in the carbon emission trading market based on a CGE model. Zhou et al. (2018) used the CGE model to analyze the rebound effect. Tang et al. (2019) explored the impact of carbon trading policies on carbon emission reduction costs based on a dynamic CGE model and proposed to adopt a penalty price higher than the carbon price to guarantee the effectiveness of carbon trading policies. In a similar study, Weng et al. (2018) examined the impact of carbon intensity targets on the macroeconomy and welfare of China. Bi et al. (2019) believed that China’s carbon trading emission reduction’s double dividend and GDP growth will appear through the establishment of a dynamic CGE model.
To sum up, most of the existing literature studies focus on a single carbon emission reduction policy, and there are few comparative studies. Faced with the limitations of the existing literature and based on China’s actual national conditions and emission reduction commitments, the question on which policy is better is being raised. So far, there is no clear answer (Liu et al., 2019; Zhu et al., 2019). Therefore, based on the CGE model, this article not only examines the impact of carbon trading and the carbon tax policy on China’s macroeconomy but also studies the “carbon trading–carbon tax” mixed policy and makes a comparative analysis to provide references for the Chinese government’s carbon emission reduction innovation incentives. This article sets different scenarios in the context of reaching the carbon emission peak as early as 2030 and comes to the conclusion that a hybrid policy can better help reach a carbon emission peak before 2030.
2 Methodology and Data
The “1-2-3” model used in this article is a simplified CGE model initiated by Devarajan, which refers to an open economy with one country, two producing sectors, and three products (Devarajan et al., 1998). The two products that the country produces are as follows: an export good
2.1 Assumptions of The Computable General Equilibrium Model
The CGE model constructed in this article satisfies three assumptions: 1) the country satisfies the “small country hypothesis”, that is, the country is only the receiver of the world market price; 2) the products involved in the “1-2-3” model meet the “product difference hypothesis”, and the constant elasticity of substitution (CES) function is used to describe this incomplete substitution relationship between
2.2 Equations of the Computable General Equilibrium Model
The “1-2-3” model consists of four types of equations: real logistics equations, nominal flow equations, price equations, and equilibrium equations.
1) Real flow equations: The real flow equations describe the demand and supply of domestic and foreign products. The total output of domestic products can be used for domestic sales and exports. So the function is specified as a constant elasticity of transformation (CET) function with transformation elasticity
where
Since the producer wants to achieve the goal of maximizing profits, it must satisfy the first-order condition of (Eq. 1):
Eq. 2 defines the proportional relationship between domestic and export goods as a function of their relative prices, where
We used the Armington assumption, assuming imports and domestic goods are imperfect substitutes. So the function is specified as a constant elasticity of substitution (CES) function with substitution elasticity
where
Given the price of domestic and import goods and the supply quantity of composite goods, consumers must meet the first-order conditions of (Eq. 3) to maximize utility:
where
2) Nominal flow equations: The nominal flow equations describe the relationship between various economic variables measured in monetary terms.
where
where
where
where
3) Price equations: The price equations describe the price relationship between various economic indicators as follows:
where
4) Equilibrium equations: The equilibrium equations reflect the “general equilibrium” characteristics of the CGE model and describe the state of the market clearing, that is, the equilibrium of each economic account is achieved. The equations are as follows:
Eq. 15 defines the balance between the supply and demand of domestic products in the domestic market. Eq. 16 defines the balance between the domestic aggregate supply and demand. Eq. 17 defines the balance of international payments. Eq. 18 describes the investment–savings equilibrium. Eq. 19 shows the balance of revenue and the expenditure of the government.
2.3 Parameters and Variables in the Computable General Equilibrium Model
According to the specific situation of the research questions in this article, the variables and parameters in the model are 18 endogenous variables, 14 exogenous variables, and 8 parameters, as shown in Table 1.
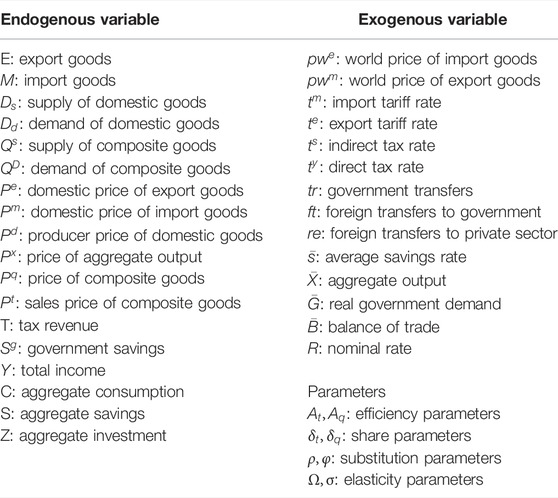
TABLE 1. Variables and parameters in the “1-2-3” model.
2.4 Closure of the Computable General Equilibrium Model
The purpose of constructing the CGE model is to find the equilibrium solution. In order to ensure the uniqueness of the equilibrium solution, we need a rule to “close” the model. The total number of endogenous variables in the CGE model should be equal to the total number of equations. At present, there are four macroscopic closure rules for CGE models: neoclassical closure (Kang et al., 2018; Liu, 2018), Kaynes closure, Johansen closure, and Kaldorian closure. The CGE model constructed in this article has 18 endogenous variables, but there are 19 equations. We used neoclassical closure rules to close this model. The characteristic of this closure rule is to delete the independent investment function, that is, Eq. 18 is eliminated to complete the closure of the model (Liu and Baghban, 2017).
2.5 Data and Calibration of the Computable General Equilibrium Model
2.5.1 Data on the Computable General Equilibrium Model
According to China’s current national economic accounting system, the input–output (IO) table is compiled by the National Bureau of Statistics every 5 years and is officially released after 2–3 years. Therefore, this article uses the latest available data—the 2018 input–output table, 2018 China Statistical Yearbook, and 2018 China Financial Yearbook as the data source of the model; the initial data units are 100 million yuan as shown in Table 2. During the calibration process, the base period’s total output is set to 1.00, and all original data are scaled based on the total output.
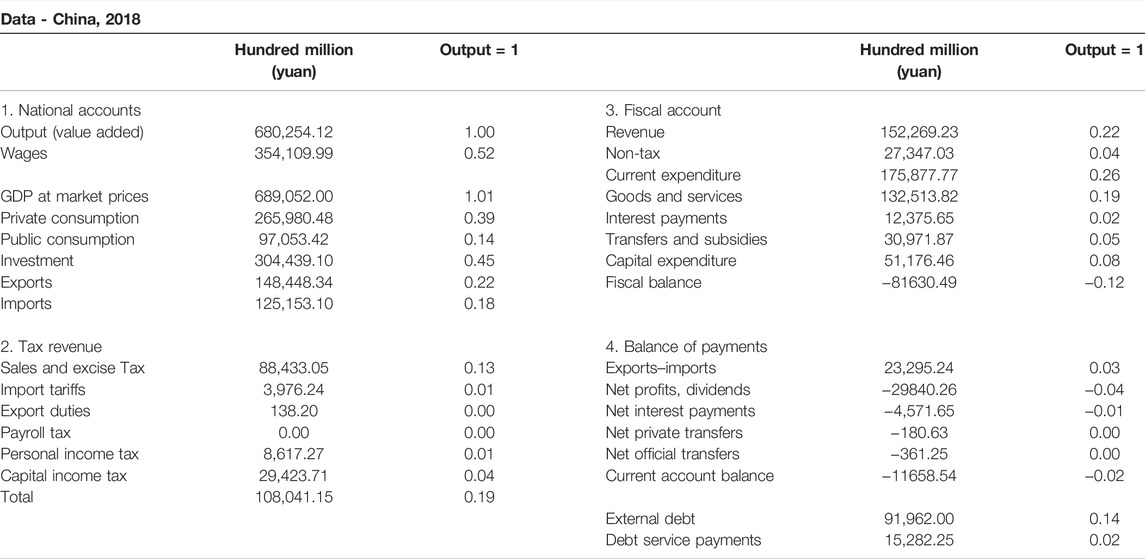
TABLE 2. Dataset of the “1-2-3” model.
2.5.2 Calibration of Exogenous Variables and Parameters of the Computable General Equilibrium Model
The different types of parameters in this model can be divided into two categories: one is the share parameter and the efficiency parameter, which can be obtained by using the calibration method; the second is the elastic parameters, which refers to a large number of existing relevant literature studies and sets the two elastic parameters as 0.6. Figure 1 and Figure 2 are, respectively, the calibration of each parameter and variable of the model. The calibration of variables and parameters is directly related to the data so that the automation of the calibration can be completed automatically.
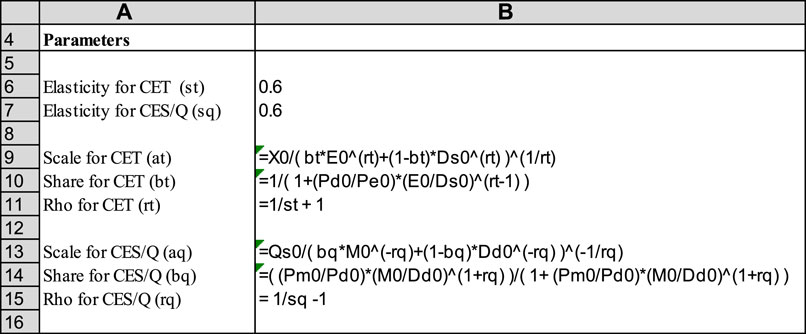
FIGURE 1. Parameter calibration of the “1-2-3” model.
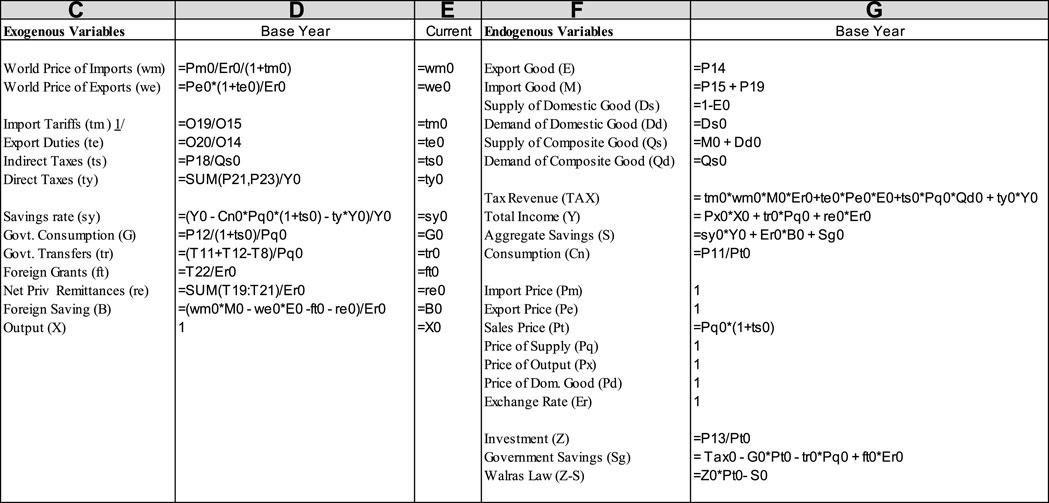
FIGURE 2. Variable calibration of the “1-2-3” model.
3 Scenario Setting
3.1 Single “Carbon Tax” Policy Scenario
In order to assess the impact of the carbon tax policy on China’s economy, we should first measure the embodied carbon emissions in China’s GDP. According to relevant data released by the National Bureau of Statistics and the World Bank, China’s total carbon emission in 2018 was 10.33 billion tons, and the total GDP in the same year was 689.52 billion yuan ($108.59 billion). Therefore, China’s embodied carbon emission per 10,000 yuan ($157.5) of the GDP was about 1.49 tons.
According to the suggestion of China’s Ministry of Environmental Protection and the Ministry of Finance, the simulation of a carbon tax is set as 10 yuan/ton ($1.58/ton), 30 yuan/ton ($4.73/ton), and 50 yuan/ton ($7.88/ton). In this situation, China’s GDP per 10,000 yuan ($157.5) will generate a 0.149–0.749% additional tax burden. Since the tax burden generated by the carbon tax can be passed on to consumers by increasing the selling price of products, it is regarded as an indirect tax (30). We introduced the carbon tax policy into the CGE model through the exogenous variable “indirect tax rate”, that is, every ten thousand yuan of the GDP in China will increase the indirect tax rate by 0.149–0.749%.
This article will use the comparative analysis method to analyze the simulation results, so four scenarios are set: 1) the baseline situation (no carbon tax); 2) low carbon tax rate at 10 yuan/ton ($1.58/ton); 3) medium carbon tax rate at 30 yuan/ton ($4.73/ton); 4) and high carbon tax rate at 50 yuan/ton ($7.88/ton). Through calculations, in the base year without carbon tax, China’s indirect tax rate is 13.4770%, after the introduction of the carbon tax, in the low, medium, and high tax rates, China’s indirect tax rates are as follows: 13.626, 13.926, and 14.226%.
3.2 Single “Carbon Trading” Policy Scenario
This article uses the carbon quota price of the primary market for carbon trading in the seven carbon trading pilot markets established in China as a reference (see Table 3) to set the price of the primary market for carbon trading in the model. Assuming that the national carbon trading price is unified, and according to the average price of the carbon trading pilot market which is between 10–60 yuan ($1.57–9.45) per ton, the following four scenarios are set: 1) the benchmark situation (0 yuan/ton); 2) low carbon price: 20 yuan/ton ($3.15/ton); 3) medium carbon price: 40 yuan/ton ($6.30/ton); and 4) high carbon price: 60 yuan/ton ($9.45/ton).

TABLE 3. Average price of carbon trading in the primary market from 2013.06 to 2019.03.
On 30 June, 2015, the Chinese government announced to the world China’s carbon emission reduction commitments, namely, CO2 emissions per unit of GDP in China should be reduced by 60–65% compared to 2005. China’s GDP in 2005 was 184,937.37 billion yuan ($29,127.64 billion), and CO2 emissions were 5.49 billion tons, so China’s carbon emission intensity in 2005 was
Since China has not yet established a national unified carbon trading market in the base year, it is assumed that the trading price of the carbon allowance in the base year is 0 yuan/ton, and only the primary market is considered. When the carbon price in the primary market is low: 20 yuan/ton ($3.15/ton); medium: 40 yuan/ton ($6.30/ton); and high: 60 yuan/ton ($9.45/ton), the income obtained from the carbon cap-and-trade is 414.18 billion yuan ($65.23 billion), 828.36 billion yuan ($130.47 billion), and 1,242.54 billion yuan ($195.70 billion), respectively. We introduced the carbon trading policy into the CGE model through the exogenous variable “government transfer”, thereby evaluating the effects on the endogenous variables in the model.
3.3 Mixed Policy Scenario
In order to examine the influence of the “carbon trading–carbon tax” policy on China’s macroeconomic policy and take into consideration that China has established a carbon market but not carbon tax, we set 10 kinds of scenario: 1) the baseline situation (no carbon trading, no carbon tax); 2) when carbon price is low: 20 yuan/ton ($3.15/ton), three scenarios of low carbon tax rate: 10 yuan/ton ($1.58/ton), medium carbon tax rate: 30 yuan/ton ($4.73/ton), and high carbon tax rate: 50 yuan/ton ($7.88/ton) are considered, respectively; 3) when the carbon price is medium: 40 yuan/ton (6.30/ton), the three scenarios of a low carbon tax rate: 10 yuan/ton ($1.58/ton), medium carbon tax rate: 30 yuan/ton ($4.73/ton), and high carbon tax rate: 50 yuan/ton ($7.88/ton) are considered, respectively; 4) when the carbon price is high: 60 yuan/ton ($9.45/ton), the three scenarios of low carbon tax rate: 10 yuan/ton ($1.58/ton), medium carbon tax rate: 30 yuan/ton ($4.73/ton,) and high carbon tax rate: 50 yuan/ton ($7.88/ton) are considered, respectively.
4 Results and Suggstions
4.1 Single “Carbon Tax” Policy Simulation Results
The solution of the CGE model in this article is solved by using the “programming solution” in Excel 2010. Since the model is a general equilibrium model, we solved the model under the condition of satisfying the “maximum consumption of the residents” so as to simulate the impact of a carbon tax policy on China’s macroeconomy, the data obtained from the simulation (Table 4) and the changes in the main macroeconomic variables (Figure 3):

TABLE 4. Simulation results in the carbon tax policy scenario.
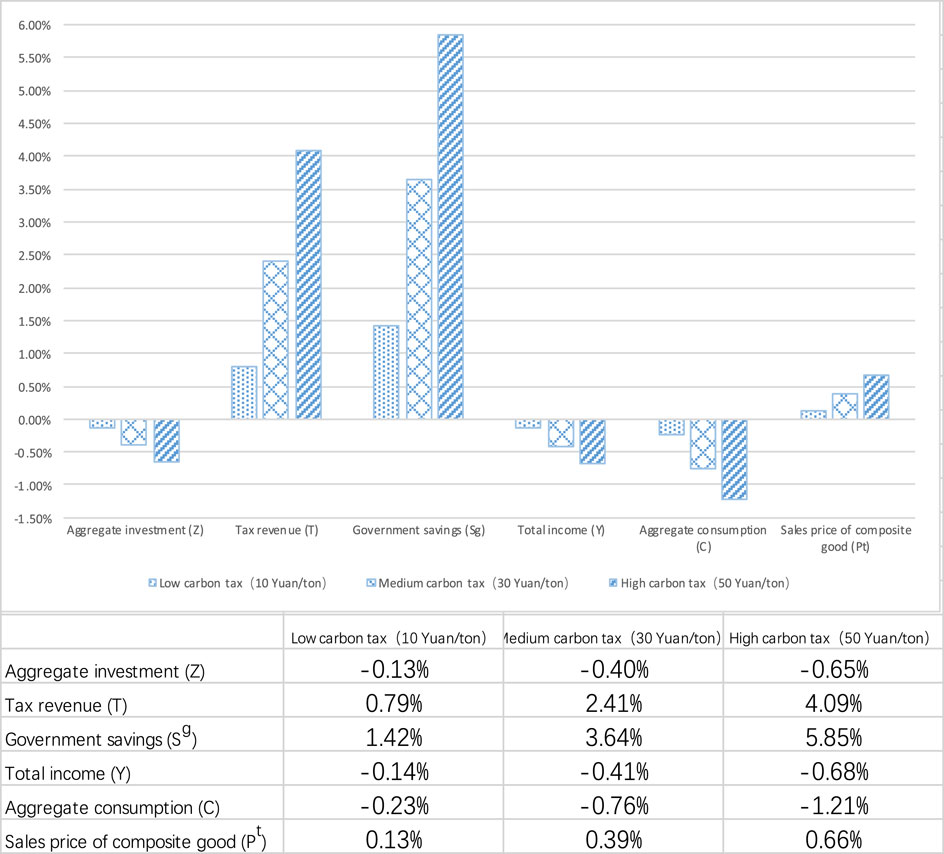
FIGURE 3. Impact on macroeconomic variables in the carbon tax policy scenario.
The simulation results show that the implementation of a carbon tax has a certain degree of restraining effect on certain aspects of China’s macroeconomy. Among them, total investment, the resident’s total income, and consumption all decline, and the degree of decline increases with the continuous increase in the carbon tax rate. The total investment declines as the carbon tax increases. In summary, using carbon tax as a carbon emission reduction tool will lead to the increase in government revenue and savings; the increase in domestic sales prices of goods; and the decrease in total investment, total income, and total consumption with the increase in the carbon tax. Therefore, the carbon tax policy has a profound impact on China’s macroeconomic development.
It is noteworthy here that the impact brought by the carbon tax policy to China’s macroeconomic system has become more significant with the continuous increase in the carbon tax rate. Therefore, if the government wants to levy a carbon tax, it is particularly important to set a carbon tax rate suitable for China’s current economic development. It is recommended to adopt a lower carbon tax rate when the carbon tax starts, carefully assessing its impact on China’s carbon reduction and its impact on the macroeconomy. We suggest that the government can compensate the consumers using the increased tax, and the rest can be used to encourage the development of new energies.
4.2 Single “Carbon Trading” Policy Simulation Results
The “programming solution” method was used to simulate the impact of the carbon emission trading policy on China’s main macroeconomy and the data obtained from the simulation (shown in Table 5.) and the changes in the main macroeconomic variables (Figure 4).
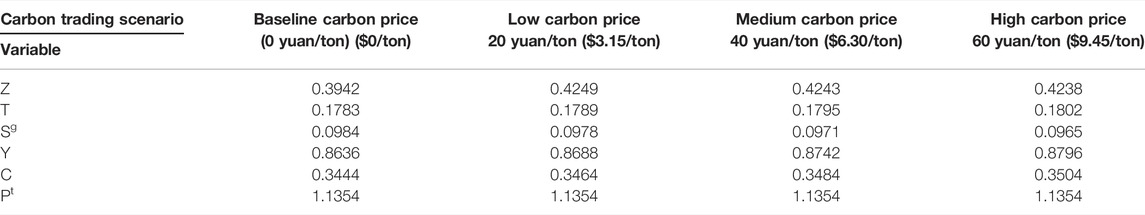
TABLE 5. Simulation results in the carbon trading policy scenario.
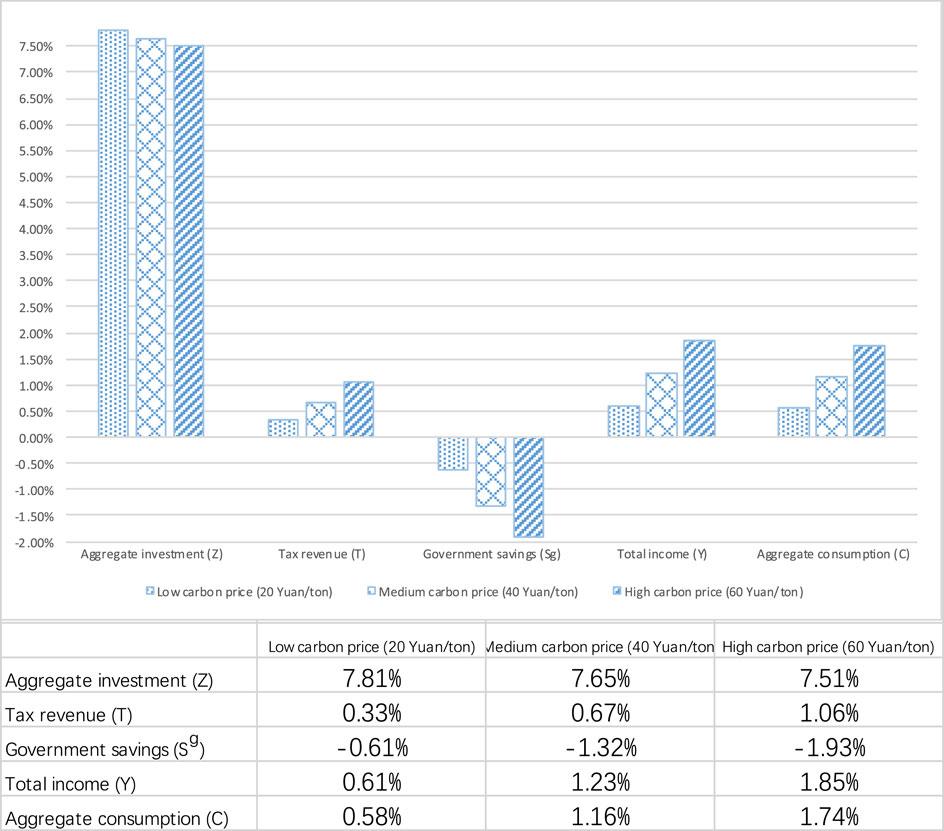
FIGURE 4. Impact on macroeconomic variables in a carbon trading policy scenario.
It can be seen from the simulation results that when the government adopts a carbon trading policy, the investment will increase significantly, the income of the government and residents will increase, the consumption of residents will increase, and the government savings will decrease. It is worth noting that compared with the carbon tax policy, the carbon trading policy can significantly improve the total investment, residents’ total income, and total consumption.
4.3 “Carbon Trading—Carbon Tax” Mixed Policy Simulation Results
The influence of the mixed policy of “carbon trading—carbon tax” on China’s macroeconomy is obtained by simulation, and the changes of main macroeconomic variables are shown in Table 6.
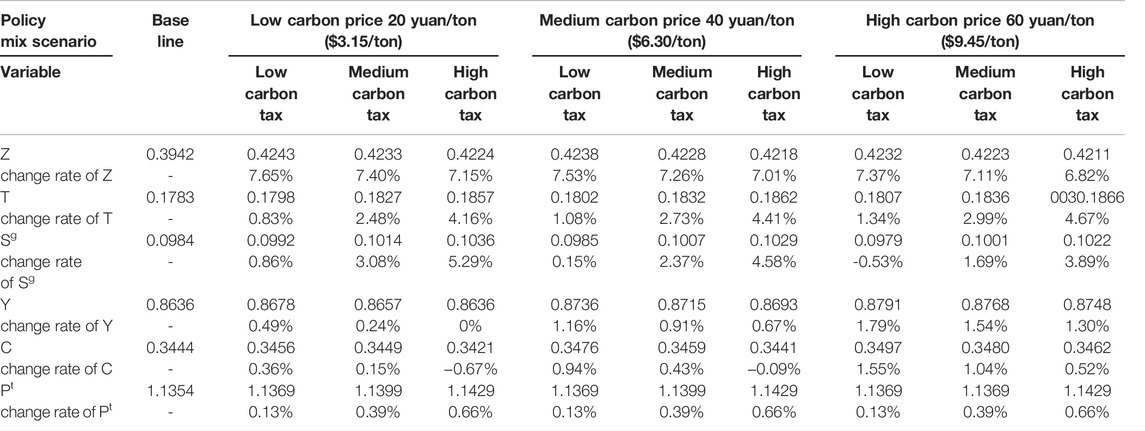
TABLE 6. Simulation results of the “carbon trading—carbon tax” mixed policy (based on carbon trading).
The results of the simulation in Table 6 show that: 1) the government introduces a carbon tax in the case carbon emission trading being launched; when the carbon price is low: 20 yuan/ton ($3.15/ton) and medium: 40 yuan/ton (6.30/ton), and the carbon tax is low: 10 yuan/ton ($1.58/ton) and medium: 30 yuan/ton ($4.73/ton), the increase in total investment was the most significant. When the carbon price is low: 20 yuan/ton ($3.15/ton), and carbon tax is low: 10 yuan/ton ($1.58/ton) and medium: 30 yuan/ton ($4.73/ton), the investment increases by 7.65 and 7.40% compared with the base year. This shows that a lower carbon tax rate would be more effective in promoting investment; 2) the total income of the government, regardless of the level of carbon price, increases most significantly when the carbon tax is high. When the carbon price is low: 20 yuan/ton ($3.15/ton), medium: 40 yuan/ton ($6.30/ton), and high: 60 yuan/ton ($9.45/ton), the revenue of the government will increase by 4.16%, 4.41, and 4.67% compared with the base year, which suggests that an increase in carbon tax could greatly boost government revenues; 3) regardless of the carbon price, the total income of the residents increases the most when the carbon tax is low: 10 yuan/ton ($1.58/ton), which increases by 0.49, 1.16, and 1.79%, respectively, compared with the base year. The increase gradually reduces as the carbon tax increases, which shows that a lower carbon tax will help increase the total income of residents.
Based on the aforementioned conclusions, we put forward the policy suggestions as follows: 1) compared with the single policy, the mixed policy is more beneficial to China’s macro economy; 2) the separate imposition of carbon tax will lead to a decrease in the income of government departments, a decrease in the total income and consumption of household departments, and a rise in the domestic price of consumer goods. Therefore, it is prudent to adopt a single carbon tax; 3) according to the current situation of emission control in China, carbon trading should be implemented independently for a steady period of time before introducing the carbon tax. Furthermore, it should be noted that the carbon tax rate should not be set too high, which will help achieve a “win–win” situation for the environment and economy.
5 Conclusion
The focus of our work not only examines the impact of carbon trading and carbon tax policy on China’s macroeconomy but also studies the “carbon trading–carbon tax” mixed policy and makes a comparative analysis based on the CGE model, providing policy advices for the Chinese government’s carbon emission reduction innovation incentive. This article draws the following conclusions: First, compared with the implementation of a single carbon tax policy, a mixed policy is more advantageous to the macroeconomy, which not only improves the government income significantly but also greatly improves the negative impact of carbon tax on the total income and consumption of residents to a large extent, which is conducive to improving the living standards and well-being of the Chinese people. Second, compared with the implementation of a single carbon trading policy, the mixed policy will significantly increase the income of the government, and government savings will also increase, but what particularly caught our attention is, a high carbon tax will have a large negative impact on domestic prices, total income, and consumption of residents. Therefore, a relatively moderate and low carbon tax, that is, 10–30 yuan ($1.58–4.73) per ton, should be adopted to achieve China’s carbon emission reduction targets and to have a favorable impact on China’s macroeconomy. This article sets three different scenarios in the context of reaching the carbon emissions peak as early as 2030 and comes to the conclusion that a hybrid policy can better help reach a carbon emission peak before 2030.
This article adopts the classical CGE model to simulate the impact of three different carbon emission reduction policies on China’s macroeconomy. However, this model also has some limitations. Because the model is relatively simple, the conclusion is the impact of emission reduction policies on China’s macroeconomy, rather than the specific industries. In the future, more complete data will be considered to analyze the impact of the emission reduction policies on the distribution of various factors and industry structures in China. In addition, since the model is static, in our future studies, we will explore the intertemporal dynamic CGE model and introduce the penalty mechanism for the non-timely performance of carbon trading and tax rebate mechanism of carbon tax into the model to compensate for the deficiencies of the current study and to develop a comprehensive policy support.
Data Availability Statement
The original contributions presented in the study are included in the article/Supplementary Material; further inquiries can be directed to the corresponding author.
Author Contributions
JS and CZ: data collection, data analysis, conception, and formal analysis; JS: writing the original manuscript; CZ: reviewing the manuscript. All authors agreed to submit to the journal.
Funding
This research was supported by Bigdata Modeling and Intelligent Computing Research Institute, Hubei University of Education; Science and Technology Research Project of Education Department of Hubei Province (Q20213004) and the Fundamental Research Funds for the Central Universities (21lzujbkydx029).
Conflict of Interest
The authors declare that the research was conducted in the absence of any commercial or financial relationships that could be construed as a potential conflict of interest.
Publisher’s Note
All claims expressed in this article are solely those of the authors and do not necessarily represent those of their affiliated organizations, or those of the publisher, the editors, and the reviewers. Any product that may be evaluated in this article, or claim that may be made by its manufacturer, is not guaranteed or endorsed by the publisher.
References
Alkaabneh, F. M., Lee, J., Gómez, M. I., and Gao, H. O. (2021). A Systems Approach to Carbon Policy for Fruit Supply Chains: Carbon Tax, Technology Innovation, or Land Sparing? Sci. Total Environ. 767, 144–147. doi:10.1016/j.scitotenv.2020.144211
Bai, Q., and Chen, M. (2016). The Distributionally Robust Newsvendor Problem with Dual Sourcing under Carbon Tax and Cap-And-Trade Regulations. Comput. Industrial Eng. 98 (4), 260–274. doi:10.1016/j.cie.2016.05.042
Bi, H., Xiao, H., and Sun, K. (2019). The Impact of Carbon Market and Carbon Tax on Green Growth Pathway in China: A Dynamic CGE Model Approach. Emerg. Mark. Finance Trade 55, 1–14. doi:10.1080/1540496x.2018.1505609
Böhringer, C., and Müller, A. (2014). Environmental Tax Reforms in Switzerland a Computable General Equilibrium Impact Analysis. Swiss J. Econ. Stat. 150 (1), 1–21. doi:10.1007/bf03399400
Carl, J., and Fedor, D. (2016). Tracking Global Carbon Revenues: a Survey of Carbon Taxes versus Cap-And-Trade in the Real World. Energy Policy 96, 50–77. doi:10.1016/j.enpol.2016.05.023
Carrera, L., Standardi, G., Bosello, F., and Mysiak, J. (2015). Assessing Direct and Indirect Economic Impacts of a Flood Event through the Integration of Spatial and Computable General Equilibrium Modelling. Environ. Model. Softw. 63, 109–122. doi:10.1016/j.envsoft.2014.09.016
Corradini, M., Costantini, V., Markandya, A., Paglialunga, E., and Sforna, G. (2018). A Dynamic Assessment of Instrument Interaction and Timing Alternatives in the EU Low-Carbon Policy Mix Design. Energy Policy 120, 73–84. doi:10.1016/j.enpol.2018.04.068
Devarajan, S., Go, D. S., Lewis, J. D., Robinson, P., and Sinko, P. (1998). “Simple General Equilibrium Modeling,” in Applied Methods for Trade Policy Analysis: A Handbook. London: Cambridge University Press.
Jiang, H. D., Purohit, P., Liang, Q.-M., Dong, K., and Liu, L.-J. (2022b). The Cost-Benefit Comparisons of China's and India's NDCs Based on Carbon Marginal Abatement Cost Curves. Energy Econ. 109, 105946. doi:10.1016/j.eneco.2022.105946
Jiang, H. D., Liu, L. J., Dong, K., and Fu, Y.-W. (2022a). How Will Sectoral Coverage in the Carbon Trading System Affect the Total Oil Consumption in China? A CGE-Based Analysis. Energy Econ. 110, 105996. doi:10.1016/j.eneco.2022.105996
Jiang, M., Zhu, B., Chevallier, J., and Xie, R. (2018). Allocating Provincial CO2 Quotas for the Chinese National Carbon Program. Aust. J. Agric. Resour. Econ. 62, 457–479. doi:10.1111/1467-8489.12261
Liu, X., Zhou, X., Zhu, B., He, K., and Wang, P. (2019). Measuring the Maturity of Carbon Market in China: An Entropy-Based TOPSIS Approach. J. Clean. Prod. 229, 94–103. doi:10.1016/j.jclepro.2019.04.380
Liu, Y., and Lu, Y. (2015). The Economic Impact of Different Carbon Tax Revenue Recycling Schemes in China: A Model-Based Scenario Analysis. Appl. Energy 141, 96–105. doi:10.1016/j.apenergy.2014.12.032
Liu, Z., Adams, M., Cote, R. P., Geng, Y., Chen, Q., Liu, W., et al. (2017). Comprehensive Development of Industrial Symbiosis for the Response of Greenhouse Gases Emission Mitigation: Challenges and Opportunities in China. Energy Policy 102, 88–95. doi:10.1016/j.enpol.2016.12.013
Liu, Z. (2018). Economic Analysis of Energy Production from Coal/Biomass Upgrading; Part 1: Hydrogen Production. Energy Sources, Part B Econ. Plan. Policy 13 (2), 132–136. doi:10.1080/15567249.2017.1410592
Liu, Z., and Baghban, A. (2017). Application of LSSVM for biodiesel production using supercritical ethanol solvent. Energy Sources A: Recovery Util. Environ. Eff. 39 (17), 1869–1874. doi:10.1080/15567036.2017.1380732
Kang, L., Du, H. L., Du, X., Wang, H. T., Ma, W. L., Wang, M. L., et al. (2018). Study on dye wastewater treatment of tunable conductivity solid-waste-based composite cementitious material catalyst. Desalination and Water Treatment 125, 296–301. doi:10.5004/dwt.2018.22910
Shi, Q., Ren, H., Cai, W., and Gao, J. (2019). How to Set the Proper Level of Carbon Tax in the Context of Chinese Construction Sector? A CGE Analysis. J. Clean. Prod. 240, 117955. doi:10.1016/j.jclepro.2019.117955
Tang, L., Shi, J., Yu, L., and Bao, Q. (2017). Economic and Environmental Influences of Coal Resource Tax in China: A Dynamic Computable General Equilibrium Approach. Resour. Conservation Recycl. 117, 34–44. doi:10.1016/j.resconrec.2015.08.016
Tang, L., Zhang, L., and Yu, L. A. (2019). The Impact of Carbon Emission Trading Scheme on Emission Abatement Cost Based on Dynamic CGE Model. J. Syst. Sci. Math. Sci. 39 (1), 51–64. doi:10.12341/jssms13544
Tran, T. M., Siriwardana, M., Meng, S., and Nong, D. (2019). Impact of an Emissions Trading Scheme on Australian Households: a Computable General Equilibrium Analysis. J. Clean. Prod. 221, 439–456. doi:10.1016/j.jclepro.2019.02.273
Vijay, P. O., Sanjib, P., and Joydeep, G. (2020). Recycling Carbon Tax for Inclusive Green Growth: A CGE Analysis of India. Energy Policy 144, 111708. doi:10.1016/j.enpol.2020.111708
Wang, Y. L., Xia, X. Q., and Zhang, Y. (2021). Research on Differential Countermeasures of Carbon Emission Reduction and Low Carbon Publicity in Supply Chain under Carbon Trading Policy. Chin. J. Manag. Sci. 30 (04), 155–166. doi:10.16381/j.cnki.issn1003-207x.2021.0165
Weng, Z., Dai, H., Ma, Z., Xie, Y., and Wang, P. (2018). A General Equilibrium Assessment of Economic Impacts of Provincial Unbalanced Carbon Intensity Targets in China. Resour. Conservation Recycl. 133, 157–168. doi:10.1016/j.resconrec.2018.01.032
Wu, D., and Yang, Y. X. (2021). Differential Game Model of Supply Chain Emission Reduction Considering Consumers' Low-Carbon Preference. Chin. J. Manag. Sci. 29 (04), 126–137. doi:10.16381/j.cnki.issn1003-207x.2018.0884
Zhang, Y., Qi, L., Lin, X., Pan, H., and Sharp, B. (2022). Synergistic Effect of Carbon ETS and Carbon Tax under China's Peak Emission Target: A Dynamic CGE Analysis. Sci. Total Environ. 825, 154076. doi:10.1016/j.scitotenv.2022.154076
Zhou, D., An, Y., Zha, D., Wu, F., and Wang, Q. (2019). Would an Increasing Block Carbon Tax Be Better? A Comparative Study within the Stackelberg Game Framework. J. Environ. Manag. 235, 328–341. doi:10.1016/j.jenvman.2019.01.082
Zhou, M., Liu, Y., Feng, S., Liu, Y., and Lu, Y. (2018). Decomposition of Rebound Effect: An Energy-specific, General Equilibrium Analysis in the Context of China. Appl. Energy 221, 280–298. doi:10.1016/j.apenergy.2018.03.074
Keywords: CGE model, carbon trading policy, carbon tax policy, mixed policy, carbon reduction policies
Citation: Shen J and Zhao C (2022) Carbon Trading or Carbon Tax? A Computable General Equilibrium–Based Study of Carbon Emission Reduction Policy in China. Front. Energy Res. 10:906847. doi: 10.3389/fenrg.2022.906847
Received: 29 March 2022; Accepted: 23 May 2022;
Published: 24 August 2022.
Edited by:
FengSheng Chien, Fuzhou University of International Studies and Trade, ChinaReviewed by:
Hayot Berk Saydaliev, Institute of Forecasting and Macroeconomic Research, UzbekistanHong-Dian Jiang, China University of Geosciences, China
Copyright © 2022 Shen and Zhao. This is an open-access article distributed under the terms of the Creative Commons Attribution License (CC BY). The use, distribution or reproduction in other forums is permitted, provided the original author(s) and the copyright owner(s) are credited and that the original publication in this journal is cited, in accordance with accepted academic practice. No use, distribution or reproduction is permitted which does not comply with these terms.
*Correspondence: Changheng Zhao, Y2h6aGFvMDUwOEB2aXAuc2luYS5jb20=