 Yuxiu Zang
 Weichun Ge1,3
- 1School of Electrical Engineering, Shenyang University of Technology, Shenyang, China
- 2State Grid Shenyang Electric Power Supply Company, Shenyang, China
- 3State Grid Liaoning Electric Power Supply Co., Ltd., Shenyang, China
As a high proportion of clean energy is connected to the power grid, the occupancy rate of the system synchronous machine decreases, the inertia constant of the system decreases, and the difficulty of frequency adjustment continues to increase. The imbalance of frequency is mainly caused by the imbalance of active power, so the problem of frequency can be transformed into the problem of active power balance. According to the droop control principle, the concept of the equivalent unit regulating power coefficient is proposed, and the equivalent unit regulating power is determined by determining the system parameters and frequency offset. In order to reduce the frequency regulation cost in the integrated energy system, a feasible method considering the frequency regulation cost is the proposed variable droop control active power economic optimization method. First, the integrated energy system in this study consists of carbon capture power plants, a wind turbine generator system (WTGS), a photovoltaic power generation system, and energy storage batteries. All four types of power supply leave spare capacity to participate in frequency regulation through droop control. Second, the concept of the equivalent unit regulating power coefficient (equivalent coefficient) and the mathematical model of the equivalent unit regulating power coefficient of the integrated energy system are put forward. Then, within the allowable range of frequency fluctuations, considering carbon trading and ancillary service markets and aiming at the lowest frequency regulation cost, an economical optimal distribution method is established for active power in an integrated energy system including carbon capture power plants, wind power, photovoltaic, and energy storage. Taking a city in the north as an example, the improved moth flame algorithm is used to solve the problem. The simulation results show that the proposed model can improve the frequency regulation characteristics and reduce the frequency regulation cost.
1 Introduction
The frequency regulation task of the traditional power grid is mainly undertaken by thermal power units. With the rapid growth of the proportion of new energy in the power grid, the thermal power units are gradually withdrawn, the traditional frequency regulation units are continuously reduced, and the frequency regulation reserve is continuously reduced. It is even more difficult for traditional generators to meet the power requirements of the system load side as the frequency regulation capability of the grid decreases. Therefore, the renewable energy in the power grid is required to have frequency regulation capability to make up for the reduced frequency regulation unit capacity with the withdrawal of thermal power units (Xie et al., 2019; Xian et al., 2021). Otherwise, there will be serious abandonment of wind and light, which is not conducive to the further development of renewable energy.
For reducing the operating cost of integrated energy in the integrated energy management system, Li et al. (2021a) proposed an IES planning method based on life cycle and energy theory. First, the energy theory is applied to quantify the production efficiency of IES. A complete economic benefit model is established based on the life cycle theory. Compared with the traditional planning scheme considering the average annual cost and energy quality factor, this research method can reduce the planning cost by 23.16% and increase the renewable energy consumption rate by 4.26%. Gao et al. (2022) established a two-tier optimal scheduling model for an integrated energy system with multiple types of energy storage as the core, divided into the day-head scheduling layer and the real-time dispatch layer. This study uses fuzzy control to perform real-time scheduling of electric energy and thermal energy storage, effectively reducing the energy cost of users and improving energy utilization efficiency. Riyaz et al. (2021) discussed the optimum setting point for isolated wind, photovoltaic, diesel, and battery storage electric grid systems. The optimal energy supply for hybrid grid systems means that the load is sufficient for 24 h. This study aims to integrate the battery deprivation costs and the fuel price feature in the optimization model for the hybrid grid. Overall system power generation costs are reduced. Li et al. (2021b) proposed an optimal dispatch framework of PIES, which constructs the operation models under three different time scales, including day-ahead, intraday, and real time. Demand response is also divided into three levels considering its response characteristics and cost composition under different time scales. The example analysis shows that the multi-time scale optimization dispatch model can not only meet the supply and demand balance of PIES, diminish the fluctuation of renewable energy and flatten load curves, but also reduce the operation cost and improve the reliability of energy systems. Researching control and communication methods in the integrated energy system, Wang et al. (2020) proposed a reduced-order small-signal closed-loop transfer function model based on Jordan continued-fraction expansion to assess the dynamic characteristics of the droop-controlled inverter and provide the preprocessing method for the real-time simulation of power systems. Wang et al. (2021a) proposed a reduced-order aggregate model based on a balanced truncation approach to provide the preprocessing approach for the real-time simulation of large-scale converters with inhomogeneous initial conditions in a DC microgrid. This study presents an aggregated approach that involve independent reducing component responses and combine reducing component responses. Based on this, the input-output maps error is reduced. Wang et al. (2021b) proposed a distributed secondary H∞ consensus approach based on the dynamic event-triggered communication method to realize accurate current sharing and efficient operation in the presence of numerous DGs and CPLs.
Regarding the establishment of a comprehensive energy carbon trading mechanism, Sun et al. (2021) minimized the annual total cost of the system by considering the carbon trading cost and studying the operation modes under different carbon trading prices by commercial optimization software. The simulation results show the operation modes in summer are changed with the increase of the carbon trading prices, while the operation modes in winter are not changed with the fluctuation of the carbon trading prices. Wang et al. (2021c) solved the problems of environmental pollution and conflict of interests among multiple stakeholders in the integrated energy system (IES). This study proposes a novel collaborative optimization strategy for a low-carbon economy in IES based on the carbon trading mechanism and Stackelberg game theory. The simulation results verify that in a carbon-constrained environment, all stakeholders can benefit from the proposed transaction mechanism, resulting in an economical and environmentally friendly optimal scheduling of IES. Xiaohui et al. (2019) established an electric–gas-integrated energy system planning model that considers carbon trading. A reward and punishment ladder-type carbon trading cost model is proposed, and its restriction on carbon emission is analyzed. On this basis, a planning model is established to minimize the total costs including the investment cost, operation cost, and carbon trading cost.
For the study of integrated energy frequency adjustment, Pati and Subudhi (2021) illustrated the design and control of load frequency control of a two-area power system. The system is modeled with conventional as well as nonconventional energy sources like wind, solar, and diesel power plants. An effective and efficient controller named tilt integral derivative controller with filter is employed in this study. For tuning controller parameters, a simple yet proficient optimization method called the Jaya algorithm is used. As a high-quality frequency regulation (FR) resource, a community-integrated energy station (CIES) can effectively respond to frequency deviation caused by renewable energy generation, helping to solve the frequency problem of the power system. Li C. et al. (2021) proposed an optimal planning model of CIES considering FR service. An optimal planning model of CIES considering FR service is proposed, with which the revenue of participating in the FR service is obtained under the market mechanism.
Based on the fact that both photovoltaic and wind power use load shedding control, Tian et al. (2016) proposed a control scheme for photovoltaic and wind power to participate in grid frequency regulation by segments, and photovoltaics are preferred to participate in grid frequency regulation. Cai et al. (2013) established a wind–solar storage combined power generation system. Both wind power and photovoltaic systems adopt a double-loop control strategy to ensure the maximum power output. The energy storage battery determines the output power of the energy storage battery by controlling the frequency of the grid connection point to stabilize the power fluctuation of the wind and solar output so that the entire wind–solar storage system can output power smoothly, with minimal impact on the frequency of the entire power grid. Ma et al. (2015) determined the dynamic output strategy of wind turbines and photovoltaic power generation and propose an adaptive droop control method, which adaptively adjusts the droop coefficient of each micro-source through the power margin of the networked power supply, giving full play to the micro-source adjustment potential and power support capability. However, the issue of carbon trading costs is not considered. Ma (2019) carried out mathematical modeling for thermal power frequency regulation standby units, hydropower frequency regulation standby units, wind turbines, and energy storage systems, and establish an optimal control strategy and evaluation system for participating in primary frequency regulation of the power grid, but do not consider the participation of photovoltaic units in frequency regulation.
However, previous studies were not thoughtful. Some did not consider the inconsistency between the planned and actual frequency modulation capacity, and some did not consider the frequency regulation capacity of clean energy itself. This research mainly studies the active power optimal allocation of integrated energy systems including thermal-wind-light-storage. This study uses the integrated energy system including carbon capture power plants, energy storage batteries, PV, and WTGS, and puts forward the equivalent unit regulated power model and cost model, taking into account the power market and carbon trading market mechanism, frequency modulation auxiliary service market and network security constraints. An economic optimization method of variable droop control active power aims at minimizing the total frequency modulation cost of carbon capture power plants, energy storage batteries, PV, and WTGS in the integrated energy system. Taking a certain area in the north as an example, the improved moth flame algorithm is used to solve the problem. It verifies the effectiveness of the method proposed in this study in mitigating the frequency shock caused by the current high proportion of clean energy connected to the grid.
2 Integrated Energy System Structure
In the modern power grid system, the generation system is no longer just thermal power plants. The integrated energy system studied in this research is shown in Figure 1. Its main components include carbon capture power plants (plants), energy storage batteries (batteries), photovoltaic power generation systems (PV), and wind turbine generator system (WTGS). In the comprehensive energy model, it is assumed that all plants are carbon capture power plants. The plants collect, transport, store, and sell part of the carbon dioxide generated by combustion to electricity to gas equipment manufacturers, so as to provide carbon dioxide required for the reaction for electric hydrogen production equipment and obtain income. Whether to participate in frequency regulation the next day is determined by the short-term forecast of clean energy power generation and electricity load, and the enterprise decides to participate in frequency regulation capacity. According to the actual frequency regulation capacity of the enterprise, which determines its participation in frequency regulation income.
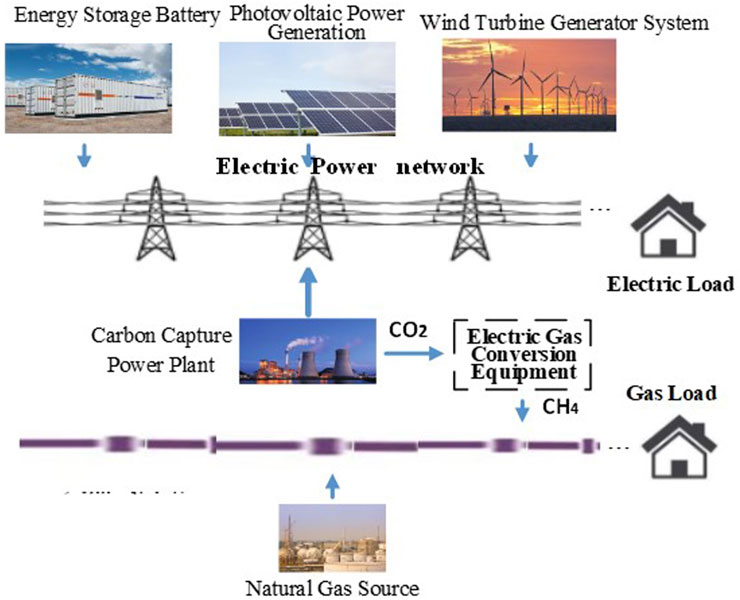
FIGURE 1. Structure of the integrated energy system.
The control block diagram is shown in Figure 2, in this model, when the system frequency changes less than

FIGURE 2. Structure of the integrated energy system.
The plants regulate the power in the equivalent unit
There is a linear relationship between the power increment of plants and the frequency change of the state grid (Xiao et al., 2020). The coefficient of the plant is as follows:
The reasonable setting of the equivalent coefficient of WTGS will avoid the secondary disturbance to the frequency during the speedy recovery of WTGS. When the frequency change rate is high, the fan has frequency regulation ability, which can meet the frequency regulation, reduce unnecessary wind energy loss, and improve wind energy utilization efficiency. Otherwise, the frequency modulation ability of the fan is weak. The droop control introduces the speed influence factor to limit the fan’s participation in frequency modulation, which can avoid the shutdown and off-line accident caused by the fan’s excessive use of kinetic energy to participate in frequency modulation (Liao, 2020).
By adjusting
where
Energy storage batteries participate in frequency modulation through droop control, and the battery’s power status are divided into five types: no power state, minimum power status
The energy storage batteries system participates in system frequency modulation through virtual droop control. The change curve of virtual unit regulated power of energy storage batteries charge and discharge with energy storage batteries SOC can be regarded as the “s" curve (Zarina et al., 2012; Zadkhast et al., 2017). The curve form is divided into three sections according to the amount of energy storage batteries, and the energy storage batteries system are divided into two types according to charging and discharging states. The change of unit regulated power is shown in Table 1.
where
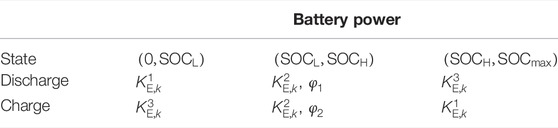
TABLE 1. The equivalent unit coefficient of batteries.
In summary, PV, WTGS, and storage energy batteries adjust power by changing the equivalent coefficient under different conditions to ensure that their systems are in the best state of frequency regulation, avoiding overregulation that leads to off-grid, resulting in a secondary drop in frequency, jeopardizing grid security. (1) can be equivalent to the following matrix:
where
2.1 Integrated Energy System Model
The cost of carbon capture power plants consists of the power generation cost involved in active power regulation and carbon-related costs. Carbon-related costs
Referring to (8), we can get the total cost of carbon capture power plants consisting of power generation cost and carbon-related cost:
where
The cost of WTGS and PV is mainly caused by the abandonment. On the premise of ensuring the safe operation and economy of the system, the amount of abandoned wind and light shall be reasonably reduced. With the increase of the amount of abandoned clean energy, the penalty cost will also increase, so as to restrain the abandonment.
where
Batteries have a limited number of discharges, and energy storage battery loss is related to deep discharge (Liu et al., 2021). As the depth of discharge of the battery increases, the cycle life of the battery continues to decrease. The cost of a single discharge loss when the battery is discharged is
where
3 Objective Function and Constraints
This study proposes that all kinds of power sources in the integrated energy system jointly undertake the task of active power balance, On the basis of ensuring frequency stability, a minimum frequency adjustment cost model of the integrated energy system is established as follows:
where
3.1 Capacity Constraints
where
3.2 System Power Flow Equation Constraint and Transmission Line Power Constraint
where
Output power constraints and ramp rate constraints of carbon capture power plants:
Ensure that the output of the carbon capture power plants at
3.3 Power Constraint of the Energy Storage Batteries System
where
3.4 Dead Zone Constraint
In order to avoid unnecessary frequent action of the system, assuming that the frequency modulation dead zone of primary frequency modulation is
3.5 Energy Balance Constraint
4 Improved Moth Flame Optimization Algorithm
In this study, an improved moth flame optimization (MFO) algorithm is used to solve the nonlinear optimization problem. In MFO, moths are individuals who seek optimization in the search space, save the optimal position that the moth group can find so far, and assign it to the flame. Each moth uses the corresponding flame as the optimization guide, and continuously adjust their flight trajectory to move closer to the global optimal solution. The MFO algorithm is described in detail as follows: The variable of the problem is the position of the moth in the search space. The moth population is represented in the matrix as shown in (18); for all moths, Eq. 19 is used to store the corresponding fitness values. Another key component in the MFO algorithm is the flame, and the flame position is a variable matrix of the same dimension as the moth position, denoted by (20). The objective function value corresponding to the stored flame is shown in Formula 21:
where n is the number of moths and d is the number of variables.
The MFO algorithm assigns each moth a specific flame and uses a logarithmic spiral function to update the moth’s position as shown in the following equation:
where
where l is the current number of iterations and T is the maximum number of iterations.
In the moth optimization algorithm, due to the characteristics of the spiral motion of the moth, the ability of the algorithm to search for optimization in the local scope is enhanced, but the search in the global scope cannot be better. The moth flame-catching optimization algorithm has the advantages of strong parallel search ability and easy programming. Better coefficients can be found with fewer iterations in multidimensional operation optimization. In this study, a chaotic particle swarm algorithm (CLSPSO) is used to optimize the initial position of the swarm particles to increase the global search ability of the algorithm and avoid falling into local minima, which can effectively make up for the inadequacy of the algorithm for global search.
After the algorithm flow is improved, the improved algorithm is used to solve the active power distribution in the integrated energy system. Figure 3 shows the flow chart of applying the improved moth flame algorithm to solve the optimal active power.

FIGURE 3. Algorithm flow chart.
5 Example Simulation
WTGS and PV normally use the maximum power point tracking mode for power generation, and energy storage cooperates with clean energy power generation to reduce wind and light abandonment, peak cutting, and valley filling. When the system is within the frequency fluctuation dead band, the system will not adjust. When the frequency fluctuation exceeds the dead band, the power supply in the system will jointly participate in the frequency adjustment. The specific primary frequency modulation characteristics are related to the actual power supply characteristics of the system. The traditional power supply is mainly power plants, and the primary frequency regulation characteristics of power plants can be approximately regarded as a straight line with a slope
Due to the continuous development of clean energy, the power structure of the power grid has changed greatly. The primary frequency modulation characteristics of an integrated energy system with a high proportion of clean energy power generation are superimposed by different equivalent coefficients.
Taking a region in the north as an example, there are 100 MW carbon capture power plants, 80 mW WTGS, 80mW PV, and 50 MW energy storage batteries. The capacity parameters are shown in the figure below. This study contains multiple inequality constraints and equality constraints. The MATLAB software is selected and the YALMIP toolkit is used for programming and calculation, respectively. The 24 h before the day is taken as the dispatching cycle, and the duration of each dispatching period is 15 min the clean energy output in the dispatching cycle is shown in Figure 4. For the comparison of results, the following three modes are used for comparative analysis:
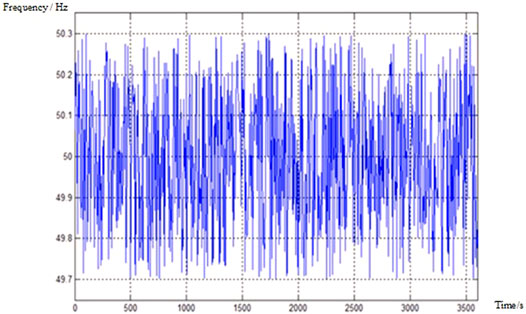
FIGURE 4. The system frequency variation curve.
Mode 1: according to the conventional mode, when the frequency fluctuation exceeds the frequency dead zone due to the change of system active power, only the carbon capture power plants adjust the power output, WTGS and PV continue to maintain the MPPT mode, and the energy storage does not participate in the regulation of active power, and the equivalent unit regulated power
Mode 2: when the frequency exceeds the frequency dead band due to the change of active power in the system, the system as a whole participates in the regulation of active power, but the equivalent coefficient does not change with the power change rate and is always a constant value.
Mode 3: when the frequency exceeds the frequency dead-band due to the change of active power in the system, the system as a whole participates in the regulation of active power, all power supplies participate in frequency modulation, and the equivalent unit is regulated power changes with the actual situation.
Figure 4 shows the system frequency change curve. When the system frequency changes and
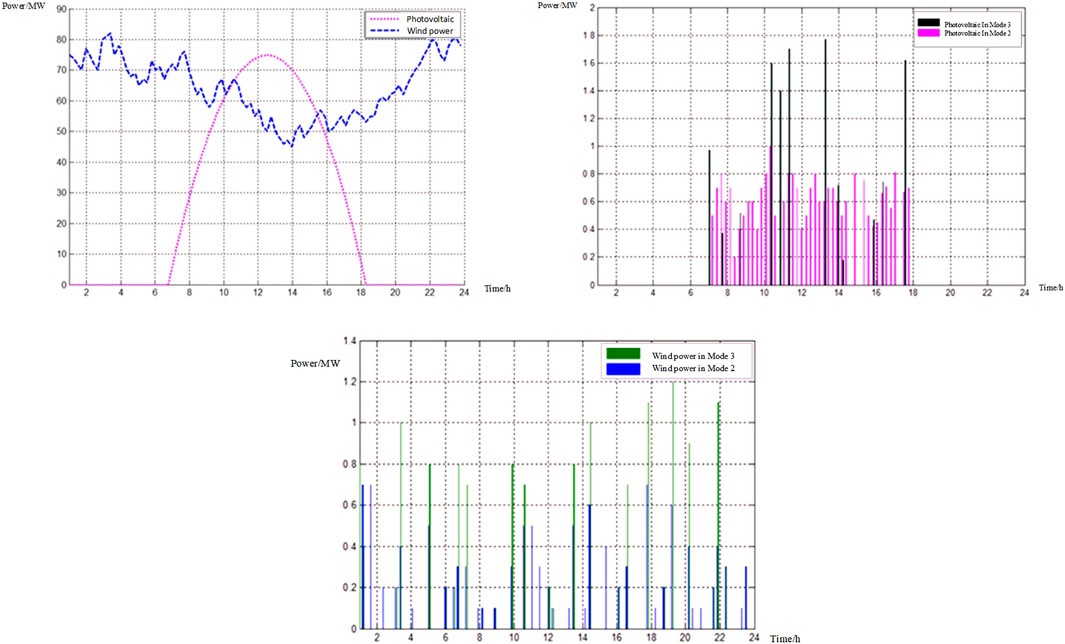
FIGURE 5. (A) The power of WTGS, PV in Mode 1 to the grid, (B) PV participates in active power balance and power regulation in Mode 2 and 3, (C) Active power balance regulation power of WTGS in Mode 2 and 3.
It can be seen from Figure 5C that WTGS has higher power generation at night and can participate in frequency modulation more. When the frequency change rate exceeds the fixed value, in order to ensure the system balance, the participation of WTGS and PV power in power regulation in Mode 3 is significantly greater than that in Mode 2, so as to enhance the ability of the system to regulate active power balance,. The participation of PV and WTGS in active power regulation in Mode 3 is strong, so as to reduce the fluctuation of frequency in the regulation process so that the frequency modulation times of the system are significantly less than that in Mode 2, It shows that the system frequency stability is enhanced in Mode 3 so that the frequency modulation times of the system are significantly less than that in Mode 2. It shows that the system frequency stability is enhanced under Mode 3.
In Mode 3, the regulation mode not only ensures the active power balance of the system but also ensures that the PV does not participate in frequency modulation too frequently. It increases the generation of power and ensures the penetration of clean energy power generation. This mode also alleviates the frequency modulation pressure of synchronous units. It shows that the system frequency stability is enhanced in Mode 3. It ensures the active power balance of the system and PV does not participate in frequency modulation too frequently. In Mode 3, the power generation increases to ensure the penetration of clean energy power generation. This mode also relieves the frequency modulation pressure of the synchronous unit. It shows that the system frequency stability is enhanced in Mode 3. It ensures that the active power of the system is balanced and the frequency is not adjusted too frequently, and the frequency modulation pressure of the synchronous unit is relieved.
As shown in Figure 6, due to the contribution of WTGS and PV to the active power balance adjustment, the power fluctuation of the energy storage batteries are significantly reduced compared with the first two scenarios, and the charge and discharge times are reduced by 6.5% compared with Mode 2. In the three Modes, the minimum SOC of the batteries is 0.27, 0.32, and 0.35, and the maximum SOC is 0.65, 0.63, and 0.6. The SOC of the batteries in Mode 3 ranges from
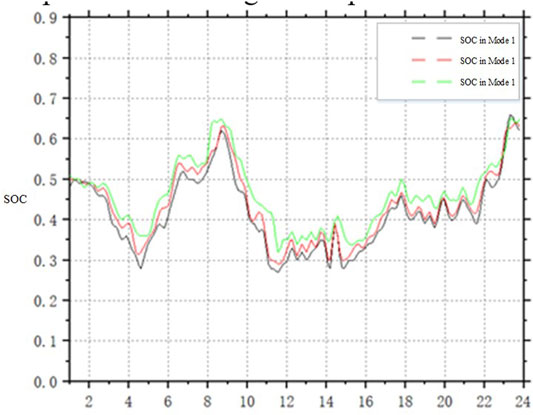
FIGURE 6. The SOC change diagram in Mode 1, 2, and 3.
Figure 7A shows the equivalent coefficient of PV, WTGS, and energy storage batteries of the system in Mode 2 and 3. The principle is the same as that of the power plants. The equivalent coefficient of the power supply is less than or equal to zero. PV and WTGS are in the lower half of the coordinate axis. The energy storage batteries can not only charge and store energy but also act as a load. Therefore, both positive and negative values exist. The PV system can only participate in the system regulation during the daytime power generation period. In Mode 2, the frequency change rate is not considered, and the power is adjusted according to the fixed unit regulated power coefficient. When the frequency data is collected in the second window time, it decreases from 50.19 to 49.827 Hz, and the active power imbalance is jointly provided by the three. The regulation capacity of PV and WTGS is limited. When the maximum capacity regulation has been adopted for WTGS and PV, the residual active power gap can only be provided by carbon capture power plants. Excessive frequency change will cause system fluctuation. Although the wind power, WTGS, and PV participate adjust the power actively, it does not solve the actual problem. At this time, if the frequency change rate is large, it is very likely to produce frequency overrun warnings and affect system safety. As can be seen from Figure 8, in the same window period, due to WTGS and the energy storage batteries increasing the equivalent unit regulation power, it has greater active power regulation ability, and the frequency rises rapidly to avoid frequency collapse.
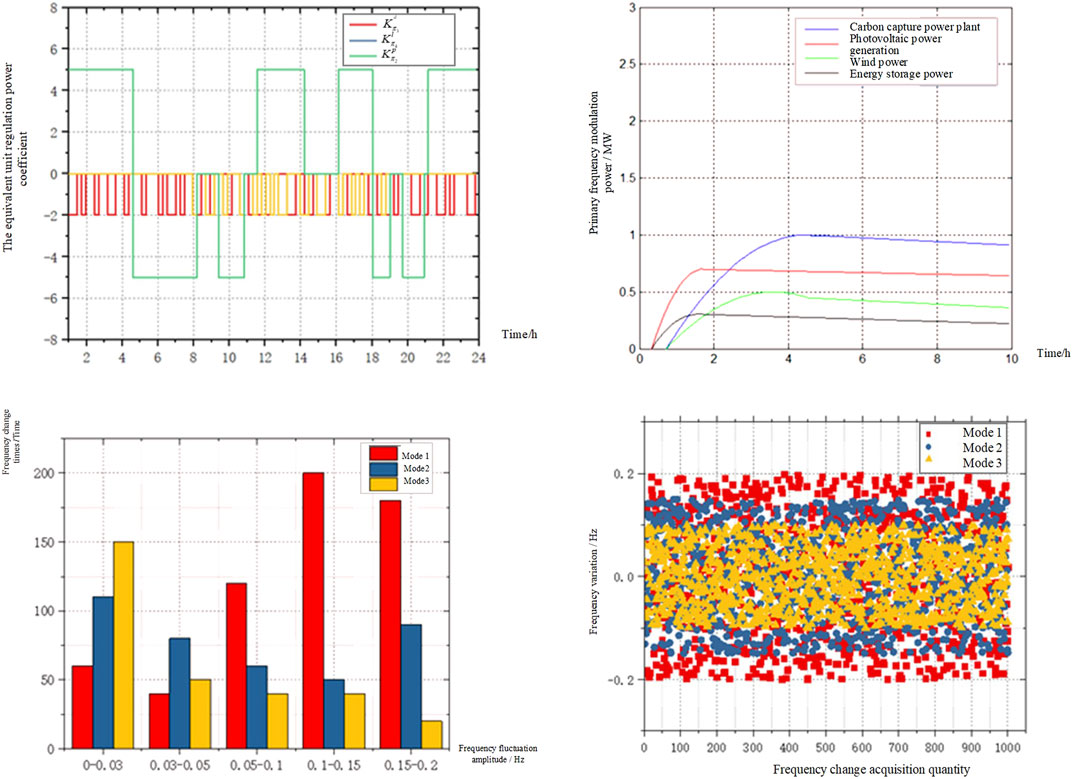
FIGURE 7. (A) The variation diagram of system equivalent unit regulated power coefficient in Mode 2; (B) the active power adjustment curve of each power in the system; (C) the frequency variation amplitude in Mode 3; (D) the distribution of frequency variation in mode three.

FIGURE 8. The variation diagram of system equivalent unit regulated power coefficient in Mode 2.
As can be seen from Figure 7B,C, after monitoring the system frequency for 1,000 consecutive windows, it can be seen that the number of system frequency fluctuations in Mode1, 2, and 3 gradually decreases. The number of dead zones exceeding the system frequency in Mode 3 is less than that in 1 and 2, which means that the system has a fast active power regulation speed and large regulation capacity, and finally enhances the ability of the system to resist frequency fluctuation. In Mode 3, compared with Mode 1, the number of frequency fluctuations exceeding the dead band is reduced by 70%. The active power imbalance of the system caused by frequency fluctuation has improved significantly. According to the scatter diagram of frequency change data in Figure 7D, the system frequency change in Mode 3 is reduced by about 40% compared with Mode 1 and 20% compared with Mode 2.
Figure 8 shows the system equivalent unit regulation power coefficient diagram. The variable equivalent coefficient means the variable regulation capacity. In this way, while meeting the regulation of active power, reduce the regulation times and reduce the lost wind energy, improve the utilization rate of clean energy as much as possible on the premise of meeting the system safety.
It can be observed that the droop coefficient is adjusted with the frequency deviation. The larger the frequency deviation, the greater the droop coefficient. The more additional power the fan provides, the frequency deviation decreases, the droop coefficient decreases, and the additional power provided decreases. Although WTGS participates in active power regulation to ensure the system’s active power balance at some time, the power to the grid is reduced, but due to the rapid recovery of system frequency the total regulation times are reduced, and the total power used for frequency modulation is reduced.
It can be seen from Figure 9 that the adjustment speed of active power support is also different for different power generation forms, which is mainly related to the operation characteristics (parameter setting) of the power supply itself. Affected by the climbing rate, the active power of thermal power units changes relatively slowly compared with power electronic components, and the frequency recovery speed is also relatively slow. The response speed of WTGS and PV participating in power regulation is significantly better than that of traditional generator sets. When PV works, due to the smaller PV inertia time constant compared with WTGS, the regulation speed of active power during the day is faster and the frequency stability is better.
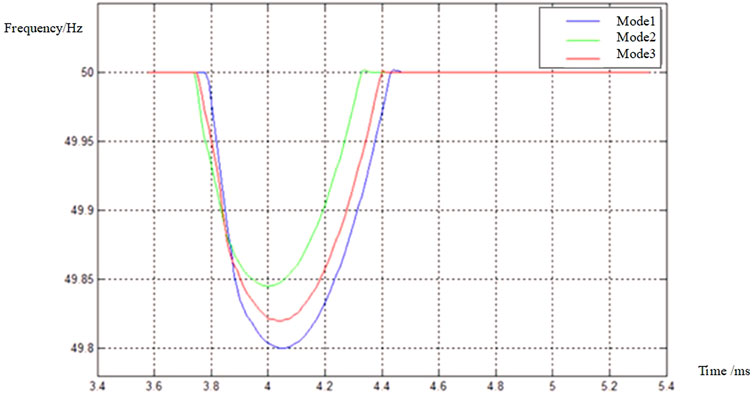
FIGURE 9. The frequency variation curve in three Modes.
The energy storage battery can stabilize the fluctuation in the process of active power regulation, make the effect of active power regulation smooth, and avoid the decline of power quality in the fluctuating sawtooth floating band. So, although the clean energy power generation in Mode 3 is lower than that in Mode 2, the system frequency is relatively stable due to the system’s active power balance, which provides the possibility to improve the grid connection penetration of clean energy. It can be seen from Figure 9 that when the frequency offset occurs at this time of the system, the carbon capture power plants, WTGS, PV, and energy storage battery all participate in the primary frequency modulation process. In this process, PV and energy storage battery supply improves the response speed of the system to the power imbalance and first responds to the unbalanced power. The non-power plant’s supply alleviates the pressure caused by the active power imbalance of the system.
It can be seen that under the control of the three modes, the frequency change of modes 1–3 is from large to small, the frequency response speed of Mode 1 is the slowest and the frequency change is the largest, the maximum frequency fluctuation is 0.2 Hz, and the frequency fluctuation amplitude of Mode 2 is reduced by 0.025 Hz. In Mode 3, the frequency adjustment speed is the fastest and the frequency fluctuation is the smallest of the three Modes, the frequency fluctuation amplitude of Mode 3 is reduced by 20% compared with Mode 1 and 8.5% compared with Mode 2. As can be seen from Table 2, compared with mode1 and mode 2, the cost of curtailing wind and light has increased in mode 3, but the overall cost is the lowest.
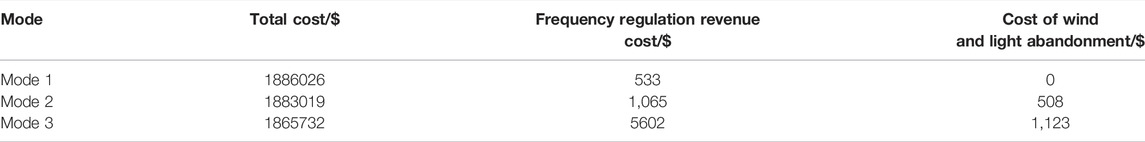
TABLE 2. The cost comparison in three modes.
6 Summary and Outlook
In this study, from the perspective of ensuring the system frequency stability by controlling the active power of the system, for the integrated energy system including carbon capture power plants, wind turbine generator system, photovoltaic power generation systems, and energy storage batteries, when the system frequency fluctuation exceeds the dead zone, the variable droop control is used to change the system participation. Active power regulation power, an optimal control model of active power cost of an integrated energy system is proposed. The results show:
1) After a high proportion of power electronic components are connected to the power grid, the system inertia is reduced, and the ability of the power grid to resist system frequency fluctuation is reduced. Connecting various energy forms to the power grid and participating in active power regulation can significantly enhance the frequency modulation ability of the power grid.
2) When multiple power sources participate in the system active power regulation, according to the actual system frequency change, the variable equivalent unit regulation power has a better control effect and the lowest cost than the single equivalent unit regulation power.
3) According to the variable equivalent unit regulation power, the number of active power regulations is significantly reduced, and the fluctuation range of system frequency is significantly reduced. Compared with the traditional method, it is increased by 20%, and compared with the single equivalent unit regulation power, it is increased by 8.5%.4. Reasonable use of clean energy and energy storage to participate in active power regulation, although reducing the power of clean energy on-grid, but reducing the cost of frequency regulation, enhancing the system’s ability to resist the imbalance of active power due to the system, reducing the system’s lack of regulation ability, and reducing the risk of system security possibility.
4) Rational use of clean energy and energy storage to participate in active power regulation can reduce the online power of clean energy, but reduce the cost of frequency modulation, enhance the ability of the system to resist the imbalance of active power, and reduce the possibility that the insufficient regulation ability of the system may endanger the safety of the system.
5) There are also some limitations in this study. This study assumes that all power supplies participate in frequency modulation at the same time. The sensitivity of clean energy to frequency is different. How to set frequency response or FM priority in the emergency frequency range according to this characteristic is an issue that has not yet been considered in this study.
Data Availability Statement
The original contributions presented in the study are included in the article/Supplementary Material; further inquiries can be directed to the corresponding author.
Author Contributions
YZ is responsible for the determination of the research direction of the paper, WG is responsible for the editing of the text, and SW is responsible for the determination of the method. LZ is responsible for the data source. CT is responsible for optimized calculations.
Funding
This work was supported by the State Grid Corporation Headquarters Technology Project Research and Application of Industrial Flexible Load Participation in New Energy Consumption Coordinated Decision-Making Technology (Item Code: 5108-202228048A-1-1-ZN).
Conflict of Interest
YZ, LZ, and CT were employed by State Grid Shenyang Electric Power Supply Company. WG and SW were employed by State Grid Liaoning Electric Power Supply Co., Ltd.
Publisher’s Note
All claims expressed in this article are solely those of the authors and do not necessarily represent those of their affiliated organizations, or those of the publisher, the editors, and the reviewers. Any product that may be evaluated in this article, or claim that may be made by its manufacturer, is not guaranteed or endorsed by the publisher.
References
Cai, G. W., Kong, L. G., Pan, C., Yang, D. Y., and Sun, Z. L. (2013). Modeling and Grid-Connected Control Strategy of Wind-Solar Storage Combined Power Generation System. J. Electrotech. Technol. 28 (9), 196–204. doi:10.3969/j.issn.1000-6753.2013.09.024
Gao, Q., Zhang, X., Yang, M., Chen, X., Zhou, H., and Yang, Q. (2022). Fuzzy Decision-Based Optimal Energy Dispatch for Integrated Energy Systems with Energy Storage. Front. Energy Res. 9. doi:10.3389/fenrg.2021.809024
Kayikçi, M., and Milanovic, J. V. (2009). Dynamic Contribution of DFIG-Based Wind Plants to System Frequency Disturbances. IEEE Trans. Power Syst. 24 (2), 859–867. doi:10.1109/tpwrs.2009.2016062
Li, C., Li, P., Yu, H., Li, H., Zhao, J., Li, S., et al. (2021). Optimal Planning of Community Integrated Energy Station Considering Frequency Regulation Service. J. Mod. Power Syst. Clean Energy 9 (2), 264–273. doi:10.35833/MPCE.2019.000056
Li, P., Wang, Z., Wang, N., Yang, W., Li, M., Zhou, X., et al. (2021a). Stochastic Robust Optimal Operation of Community Integrated Energy System Based on Integrated Demand Response. Int. J. Electr. Power & Energy Syst. 128, 106735. doi:10.1016/j.ijepes.2020.106735
Li, P., Zhang, F., Ma, X., Yao, S., Zhong, Z., Yang, P., et al. (2021b). Multi-Time Scale Economic Optimization Dispatch of the Park Integrated Energy System. Front. Energy Res. 9, 743619. doi:10.3389/fenrg.2021.743619
Liao, J. L. (2020). Modeling and Optimization of Primary Frequency Modulation Capability of High-Power Thermal Power Units. Hangzhou: Zhejiang University.
Liu, T. Q., Zhang, Q., and He, C. (2021). Coordinated and Optimized Operation of Gas-Electricity Integrated Energy Distribution Network System Considering Combined Gas-Electricity Demand Response. Chin. J. Electr. Eng. 41 (05), 1664–1677. doi:10.13334/j.0258-8013.pcsee.200385
Ma, C. H., Pan, Z. Y., Liu, C. N., and Li, W. B. (2015). Research on Frequency Modulation of Solar Energy Storage Microgrid Based on Adaptive Droop Control. Power Syst. Prot. control 43 (23), 7. doi:10.7667/j.issn.1674-3415.2015.23.004
Ma, Y. B. (2019). Optimal Control Strategy of Wind-Storage Combined System Participating in Primary Frequency Regulation of Power Grid. Jilin: Northeast Electric Power University.
Mishra, S., Zarina, P. P., and Sekhar, P. C. (2013). “A Novel Controller for Frequency Regulation in a Hybrid System with High PV Penetration,” in IEEE Power & Energy Society General Meeting (Vancouver, BC, Canada: IEEE), 1–5. doi:10.1109/pesmg.2013.6672143
Pati, S. S., and Subudhi, U. (2021). “Frequency Regulation of Solar-Wind Integrated Multi-Area System with SMES and SSSC,” in IEEE International Power and Renewable Energy Conference (IPRECON), Kollam, India, 1–4. doi:10.1109/IPRECON52453.2021.9640854
Riyaz, A., Sadhu, P. K., Iqbal, A., Tariq, M., Urooj, S., and Alrowais, F. M. (2021). Power Management of Hybrid Grid System with Battery Deprivation Cost Using Artificial Neural Network. Front. Energy Res. 9, 774408. doi:10.3389/fenrg.2021.774408
Ros-Mercado, R. Z., and Borraz-Sánchez, C. (2015). Optimization Problems in Natural Gas Transportation Systems: A State-Of-The-Art Review. Appl. Energy 147, 536–555. doi:10.1016/j.apenergy.2015.03.017
Sun, P., Hao, X., Wang, J., Shen, D., and Tian, L. (2021). Low‐carbon Economic Operation for Integrated Energy System Considering Carbon Trading Mechanism. Energy Sci. Eng. 9 (11), 2064–2078. doi:10.1002/ese3.967
Tian, C., Tian, L., Li, D., Lu, X., and Chang, X. (2016). Control Strategy for Tracking Photovoltaic Output Power Based on Hybrid Energy Storage System. J. Electrotech. Technol. 31 (14), 75–83. doi:10.3969/j.issn.1000-6753.2016.14.009
Tian, F., Jia, Y. B., Ren, H. Q., Bai, Y., and Huang, T. (2020). Source-load" Low-Carbon Economic Dispatch of Integrated Energy System Considering Carbon Capture System. Power Grid Technol. 44 (09), 3346–3355. doi:10.13335/j.1000-3673.pst.2020.0728
Wang, R., Cheng, S., Zuo, X., and Liu, Y. (2021c). Optimal Management of Multi Stakeholder Integrated Energy System Considering Dual Incentive Demand Response and Carbon Trading Mechanism[J]. Int. J. Energy Res. 46, 6246–6263. doi:10.1002/er.7561
Wang, R., Sun, Q., Han, J., Zhou, J., Hu, W., Zhang, H., et al. (2021b). Energy-Management Strategy of Battery Energy Storage Systems in DC Microgrids: A Distributed Dynamic Event-Triggered H∞ Consensus Control. IEEE Trans. Syst. Man. Cybern. Syst., 1–10. doi:10.1109/TSMC.2021.3129184
Wang, R., Sun, Q., Tu, P., Xiao, J., Gui, Y., and Wang, P. (2021a). Reduced-Order Aggregate Model for Large-Scale Converters with Inhomogeneous Initial Conditions in DC Microgrids. IEEE Trans. Energy Convers. 36 (3), 2473–2484. doi:10.1109/tec.2021.3050434
Wang, R., Sun, Q. Y., Zhang, P. J., Gui, Y. H., Qin, D. H., and Wang, P. (2020). Reduced-Order Transfer Function Model of the Droop-Controlled Inverter via Jordan Continued-Fraction Expansion. IEEE Trans. Energy Convers. 35 (3), 1585–1595. doi:10.1109/TEC.2020.2980033
Xian, L., Wen, Y. F., Lu, Y. D., and Lin, X. H. (2021). Research on Frequency Stability Constrained Optimal Scheduling Model of Microgrid with Virtual Synchronous Machine [J/OL]. Chin. J. Electr. Eng. 114. doi:10.13334/j.0258-8013.pcsee.210127
Xiao, Y. P., Zhang, L., Zhang, X., and Liu, Q. X. (2020). Coordination Mechanism for Market Clearing of Spot Electric Energy Including Independent Energy Storage and Frequency Regulation Auxiliary Services. Chin. J. Electr. Eng. 40 (S1), 167–180. doi:10.13334/j.0258-8013.pcsee.200977
Xiaohui, Z., Xiaoyan, L., Jiaqing, Z., and Wenbo, G. (2019). Electricity–gas-integrated Energy Planning Based on Reward and Penalty Ladder-type Carbon Trading Cost. IET Generation, Transm. Distribution 13 (23), 5263–5270. doi:10.1049/iet-gtd.2019.0666
Xie, P., Cai, Z. X., Liu, P., Li, X. H., Zhang, Y., and Sun, Y. (2019). Cooperative Optimization of Energy Storage Capacity of Wind-Solar-Storage Microgrid System Considering the Coupled Effects of Uncertainties on Multiple Time Scales [J]. Chin. J. Electr. Eng. 39 (24), 7126–7136+7486. doi:10.13334/j.0258-8013.pcsee.181193
Yang, B. (2018). Research on the Control Strategy of Energy Storage Participating in Power Grid Frequency Regulation Considering Load Forecasting. Changsha: Hunan University.
Zadkhast, S., Garcia-Gonzalez, P., Frías, P., and Bauer, P. (2017). Design of Plug-In Electric Vehicle's Frequency-Droop Controller for Primary Frequency Control and Performance Assessment. IEEE Trans. Power Syst. 32 (6), 4241–4254. doi:10.1109/tpwrs.2017.2661241
Zarina, P. P., Mishra, S., and Sekhar, P. C. (2012). “Deriving Inertial Response from a Non-inertial PV System for Frequency Regulation,” in IEEE International Conference on Power Electronics, Drives and Energy Systems (Bengaluru, India: IEEE), 1–5. doi:10.1109/pedes.2012.6484409
Zhao, J. J., Xu, C. L., Lv, X., and Xu, C. S. (2017). Microgrid Primary Frequency Regulation Reserve Capacity and Energy Storage Optimization Configuration Method. Chin. J. Electr. Eng. 37 (15), 4324–4332+4572. doi:10.13334/j.0258-8013.pcsee.161312
Zhao, J. Q., Sun Zhong, H., Yang, Y. H., Wang, Y. H., Hu, G. S., and Chen, G. (2020). Research on the Transaction Mechanism of Distributed Photovoltaics Participating in Frequency Modulation Auxiliary Services. Glob. Energy Internet 3 (05), 477–486.
Keywords: integrated energy system, primary frequency modulation, adaptive droop control, ancillary service market, economic optimization, improved moth flame algorithm
Citation: Zang Y, Ge W, Wang S, Zhao L and Tan C (2022) An Economical Optimization Method for Active Power With Variable Droop Control Considering Frequency Regulation Costs in Integrated Energy Systems. Front. Energy Res. 10:905454. doi: 10.3389/fenrg.2022.905454
Received: 27 March 2022; Accepted: 21 April 2022;
Published: 02 June 2022.
Edited by:
Rui Wang, Northeastern University, ChinaCopyright © 2022 Zang, Ge, Wang, Zhao and Tan. This is an open-access article distributed under the terms of the Creative Commons Attribution License (CC BY). The use, distribution or reproduction in other forums is permitted, provided the original author(s) and the copyright owner(s) are credited and that the original publication in this journal is cited, in accordance with accepted academic practice. No use, distribution or reproduction is permitted which does not comply with these terms.
*Correspondence: Yuxiu Zang, eGl1ZGl1Yml1QDE2My5jb20=